You are not logged in.
This means you
CAN ONLY VIEW reports that were published prior to Tuesday, April 8, 2025.
You
MUST UPGRADE YOUR MEMBERSHIP if you want to see any current reports.
AFTER MARKET UPDATE - FRIDAY, FEBRUARY 19TH, 2021
Previous After Market Report Next After Market Report >>>
|
|
|
|
DOW |
+0.98 |
31,494.32 |
+0.00% |
|
Volume |
1,065,772,843 |
+13% |
|
Volume |
6,650,615,800 |
+4% |
|
NASDAQ |
+9.11 |
13,874.46 |
+0.07% |
|
Advancers |
2,118 |
67% |
|
Advancers |
2,706 |
68% |
|
S&P 500 |
-7.26 |
3,906.71 |
-0.19% |
|
Decliners |
1,054 |
33% |
|
Decliners |
1,251 |
32% |
|
Russell 2000 |
+48.30 |
2,266.69 |
+2.18% |
|
52 Wk Highs |
231 |
|
|
52 Wk Highs |
305 |
|
|
S&P 600 |
+21.65 |
1,288.77 |
+1.71% |
|
52 Wk Lows |
8 |
|
|
52 Wk Lows |
11 |
|
|
 |
Breadth Positive as Leadership Improves and Small Caps Lead
Kenneth J. Gruneisen - Passed the CAN SLIM® Master's Exam
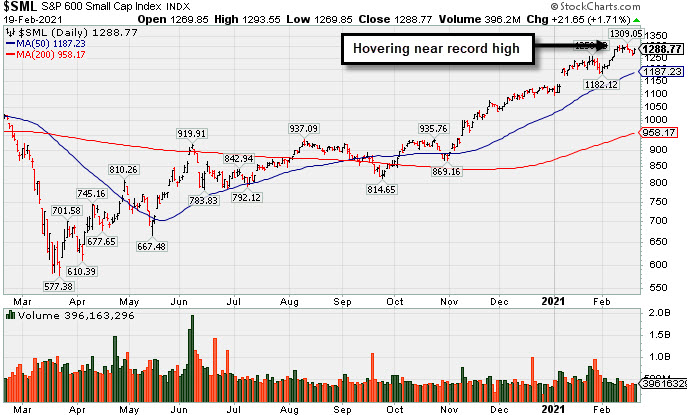
The Dow gained less than one point, bringing its weekly increase to 0.1%. The Nasdaq Composite was up less than 0.1%, paring its weekly decline to 1.6%. The volume totals Friday were higher than the prior session on the NYSE and on the Nasdaq exchange, inflated by options expirations. Advancers led decliners by more than a 2-1 margin on the NYSE and on the Nasdaq exchange. Leadership improved as there were 89 high-ranked companies from the Leaders List that hit new 52-week highs and were listed on the BreakOuts Page, versus the total of 23 on the prior session. New 52-week highs totals expanded and easily outnumbered shrinking new 52-week lows totals on both exchanges. The major indices are in a confirmed uptrend (M criteria) with healthy leadership provided by many stocks hitting new highs. Investors are reminded to always make buying and selling decisions based based on the strict criteria and rules of the fact-based investment system. PICTURED: The S&P 600 Small Cap Index posted a +1.7% gain on Friday, outpacing its larger peers while hovering near its record high.
U.S. stocks finished mixed on Friday as market participants weighed positive economic updates and the week's Treasury rout. Investors remained optimistic about a swift economic recovery, sending the small-cap Russell 2000 soaring 2%. The S&P 500 dipped 0.2% bringing its losing streak to four sessions (its longest such stretch of the year). However, the benchmark index still ended the week in negative territory, shedding 0.7% as rising bond yields and questions surrounding elevated valuations have provided a headwind to equities.
The latest batch of economic data buoyed investor sentiment on Friday. An update from research firm Markit showed U.S. services sector activity accelerated to the highest level since March 2015, while manufacturing activity decelerated but remained firmly in expansionary territory. Separately, a release revealed U.S. existing home sales unexpectedly rose 0.6% in January. Treasuries extended a recent sell-off, with the yield on the 10-year note up five basis points to 1.34%, having jumped 14 basis points on the week. In commodities, WTI crude slipped 2.6% to $58.97/barrel to end a two-week winning streak.
Six of 11 S&P 500 sectors closed in negative territory, with the more cyclical-oriented Materials, Energy, and Industrial groups bucking the downtrend. In earnings, Deere & Co. (DE +9.91%) aggressively plowed into new high territory after exceeding consensus profit and sales projections and raising forward guidance. Applied Materials (AMAT +5.32%) rose to a record high as the chip manufacturer delivered a top and bottom line beat and offered an upbeat outlook. |
 Kenneth J. Gruneisen started out as a licensed stockbroker in August 1987, a couple of months prior to the historic stock market crash that took the Dow Jones Industrial Average down -22.6% in a single day. He has published daily fact-based fundamental and technical analysis on high-ranked stocks online for two decades. Through FACTBASEDINVESTING.COM, Kenneth provides educational articles, news, market commentary, and other information regarding proven investment systems that work in good times and bad.
Comments contained in the body of this report are technical opinions only and are not necessarily those of Gruneisen Growth Corp. The material herein has been obtained from sources believed to be reliable and accurate, however, its accuracy and completeness cannot be guaranteed. Our firm, employees, and customers may effect transactions, including transactions contrary to any recommendation herein, or have positions in the securities mentioned herein or options with respect thereto. Any recommendation contained in this report may not be suitable for all investors and it is not to be deemed an offer or solicitation on our part with respect to the purchase or sale of any securities. |
|
 |
Financial, Tech, and Commodity-Linked Groups Rose
Kenneth J. Gruneisen - Passed the CAN SLIM® Master's Exam
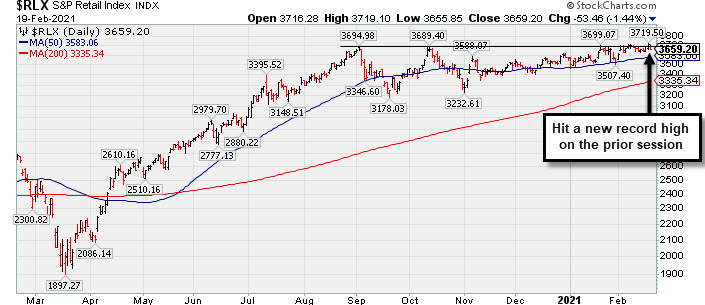
The Bank Index ($BKX +2.35%) and Broker/Dealer Index ($XBD +1.74%) both posted influential gain that helped lift the major indices while weakness from the Retail Index ($RLX -1.44%) created a drag. The Semiconductor Index ($SOX +2.44%) posted a big gain and led the tech sector while the Networking Index ($NWX +0.24%) and the Biotech Index ($BTK +0.13%) posted much smaller gains. Commodity-linked groups had a positive bias as the Oil Services Index ($OSX +1.93%) and the Integrated Oil Index ($XOI +1.88%) both outpaced the Gold & Silver Index ($XAU +0.78%).
PICTURED: The Retail Index ($RLX -1.44%) is perched near a record high hit on Thursday.
| Oil Services |
$OSX |
51.97 |
+0.98 |
+1.93% |
+17.23% |
| Integrated Oil |
$XOI |
947.01 |
+17.46 |
+1.88% |
+19.50% |
| Semiconductor |
$SOX |
3,223.46 |
+76.67 |
+2.44% |
+15.31% |
| Networking |
$NWX |
815.58 |
+1.96 |
+0.24% |
+13.73% |
| Broker/Dealer |
$XBD |
440.10 |
+7.54 |
+1.74% |
+16.55% |
| Retail |
$RLX |
3,659.20 |
-53.46 |
-1.44% |
+2.69% |
| Gold & Silver |
$XAU |
136.78 |
+1.06 |
+0.78% |
-5.14% |
| Bank |
$BKX |
113.92 |
+2.62 |
+2.35% |
+16.35% |
| Biotech |
$BTK |
6,041.82 |
+7.59 |
+0.13% |
+5.28% |
|
|
|
 |
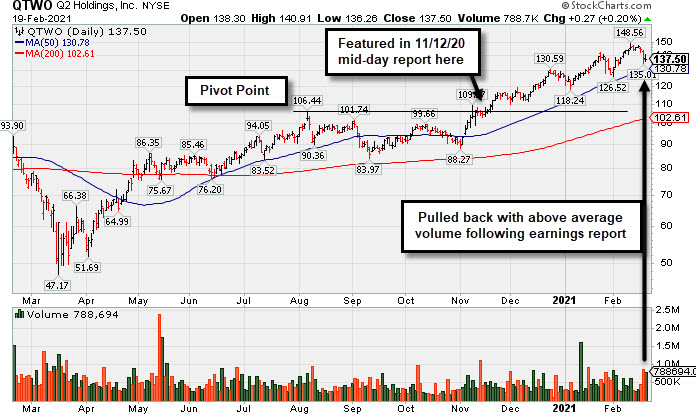
Pullback on Heavy Volume Followed Weak Quarterly Earnings Report
Kenneth J. Gruneisen - Passed the CAN SLIM® Master's Exam
Q2 Holdings Inc (QTWO +$0.27 or +0.20% to $137.50) halted its slide on Friday. It suffered a big volume-driven losses on Thursday after reporting Dec '20 quarterly earnings -95% on +26% sales revenues versus the year ago period, below the +25% minimum earnings guideline (C criteria), raising fundamental concerns. Volume and volatility often increase near earnings news. Its Earnings Per Share Rating is now 75, down from 96 when last shown in the FSU section on 1/26/21 with an annotated graph under the headline, "Perched Near All-Time High Stubbornly Holding Ground".
QTWO has been repeatedly noted as "extended from any sound base". Its 50-day moving average (DMA) line ($130.78) defines important near term support to watch above the prior low ($126.52 on 2/01/21)
It traded up as much as +41.3% since first highlighted in yellow with new pivot point cited based on its 8/06/20 high plus 10 cents in the 11/12/20 mid-day report (read here). It had great earning increases with strong underlying sales revenues growth for the Jun and Sep '20 quarters versus the year ago periods. Annual earnings growth has been strong. It completed new Public Offerings on 6/06/19 and 5/13/20. The company hails from the Computer Sftwr-Financial group. There are only 53.9 million shares outstanding (S criteria).
The number of top-rated funds owning its shares rose from 404 in Dec '19 to 482 in Dec '20, a reassuring sign concerning the I criteria. Its current Up/Down Volume Ratio of 1.6 is an unbiased indication its shares have been neutral concerning accumulation/distribution over the past 50 days.
|
|
|
Color Codes Explained :
Y - Better candidates highlighted by our
staff of experts.
G - Previously featured
in past reports as yellow but may no longer be buyable under the
guidelines.
***Last / Change / Volume data in this table is the closing quote data***
Symbol/Exchange
Company Name
Industry Group |
PRICE |
CHANGE
(%Change) |
Day High |
Volume
(% DAV)
(% 50 day avg vol) |
52 Wk Hi
% From Hi |
Featured
Date |
Price
Featured |
Pivot Featured |
|
Max Buy |
 CRL
-
NYSE
CRL
-
NYSE
Charles River Labs Intl
DRUGS - Biotechnology
|
$289.55
|
-2.96
-1.01% |
$295.40
|
473,100
148.77% of 50 DAV
50 DAV is 318,000
|
$303.79
-4.69%
|
12/17/2020
|
$247.06
|
PP = $257.98
|
|
MB = $270.88
|
Most Recent Note - 2/17/2021 12:16:19 PM
G - Reported Dec '20 quarterly earnings +19% on +14% sales revenues versus the year ago period, below the +25% minimum earnings guideline (C criteria). Hitting a new record high today. Volume and volatility often increase near earnings news.
>>> FEATURED STOCK ARTICLE : Testing Important Support on Pullback - 1/29/2021 |
View all notes |
Set NEW NOTE alert |
Company Profile |
SEC
News |
Chart |
Request a new note
C
A
S
I |
AMD
-
NYSE
Advanced Micro Devices
ELECTRONICS - Semiconductor - Broad Line
|
$89.58
|
+0.94
1.06% |
$90.42
|
29,172,329
652.65% of 50 DAV
50 DAV is 4,469,800
|
$99.23
-9.72%
|
11/18/2020
|
$82.54
|
PP = $88.72
|
|
MB = $93.16
|
 Most Recent Note - 2/19/2021 12:18:56 PM
G - Still quietly sputtering below its 50 DMA line ($91.73) which is now downward sloping. Its current Relative Strength rating of 59 is well below the 80+ minimum guideline for buy candidates, however, it remains only -9.5% off its high. Fundamentals remain strong after it reported Dec '20 quarterly earnings +63% on +53% sales revenues versus the year ago period.
>>> FEATURED STOCK ARTICLE : Close Above 50-Day Moving Average But Relative Strength a Concern - 2/10/2021 |
View all notes |
Set NEW NOTE alert |
Company Profile |
SEC
News |
Chart |
Request a new note
C
A
S
I |
AMRC
-
NYSE
Ameresco Inc Cl A
ENERGY - Alternative
|
$64.28
|
+1.57
2.50% |
$65.46
|
293,486
63.66% of 50 DAV
50 DAV is 461,000
|
$70.26
-8.51%
|
12/15/2020
|
$46.72
|
PP = $47.10
|
|
MB = $49.46
|
Most Recent Note - 2/19/2021 5:41:53 PM
G - Posted a gain today with light volume. Recently retreating from its all-time high, it is extended from any sound base. Its 50-day moving average (DMA) line ($56.43) defines near-term support to watch.
>>> FEATURED STOCK ARTICLE : Rebounding After Retreat From Record High - 2/1/2021 |
View all notes |
Set NEW NOTE alert |
Company Profile |
SEC
News |
Chart |
Request a new note
C
A
S
I |
TREX
-
NYSE
Trex Company Inc
MATERIALS and CONSTRUCTION - General Building Materials
|
$102.61
|
+0.26
0.25% |
$104.37
|
769,581
111.37% of 50 DAV
50 DAV is 691,000
|
$107.64
-4.67%
|
6/26/2020
|
$54.53
|
PP = $66.47
|
|
MB = $69.79
|
Most Recent Note - 2/16/2021 5:39:48 PM
G - Recently wedged to new all-time highs with gains backed by below average volume. Its 50 DMA line ($89.56) and prior low define important support to watch on pullbacks. Due to report Dec '20 quarterly results on 2/22/21. Sep '20 quarterly earnings were +14% on +19% sales revenues versus the year ago period, below the +25% minimum guideline (C criteria) raising fundamental concerns. See the latest FSU analysis for more details and a new annotated graph.
>>> FEATURED STOCK ARTICLE : Wedged to New Highs With Earnings Report Due Soon - 2/16/2021 |
View all notes |
Set NEW NOTE alert |
Company Profile |
SEC
News |
Chart |
Request a new note
C
A
S
I |
CLFD
-
NASDAQ
Clearfield Inc
TELECOMMUNICATIONS - Cables / Satalite Equipment
|
$36.09
|
+1.59
4.61% |
$36.49
|
126,657
81.19% of 50 DAV
50 DAV is 156,000
|
$38.75
-6.86%
|
1/20/2021
|
$31.38
|
PP = $28.42
|
|
MB = $29.84
|
Most Recent Note - 2/19/2021 5:33:49 PM
G - Perched near its all-time high, very extended from any sound base. Its 50 DMA line ($29.35) and prior highs in the $28 area define important near-term support to watch. Reported Dec '20 quarterly earnings +475% on +40% sales revenues versus the year ago period, continuing its strong earning track record.
>>> FEATURED STOCK ARTICLE : Perched Near Record High With Earnings Report Due Soon - 1/27/2021 |
View all notes |
Set NEW NOTE alert |
Company Profile |
SEC
News |
Chart |
Request a new note
C
A
S
I |
Symbol/Exchange
Company Name
Industry Group |
PRICE |
CHANGE
(%Change) |
Day High |
Volume
(% DAV)
(% 50 day avg vol) |
52 Wk Hi
% From Hi |
Featured
Date |
Price
Featured |
Pivot Featured |
|
Max Buy |
NOW
-
NYSE
Servicenow Inc
Computer Sftwr-Enterprse
|
$570.73
|
-5.07
-0.88% |
$582.11
|
1,945,648
143.60% of 50 DAV
50 DAV is 1,354,900
|
$598.37
-4.62%
|
8/20/2020
|
$453.34
|
PP = $454.79
|
|
MB = $477.53
|
Most Recent Note - 2/17/2021 5:34:27 PM
G - Holding its ground stubbornly, it closed today only -2.9% off its all-time high, and volume totals have been cooling. Relative Strength rating has slumped to 67, well below the 80+ minimum guideline for buy candidates. A new pivot point was not cited due to fundamental concerns noted as its impressive rally has continued. Gapped up on 1/28/21 promptly rebounding above its 50 DMA line ($547). Fundamental concerns remain after it reported Dec '20 quarterly earnings +22% on +31% sales revenues versus the year ago period, its 2nd consecutive comparison below the +25% minimum guideline (C criteria) of the fact-based investment system.
>>> FEATURED STOCK ARTICLE : Hit New Highs With Latest Gains Backed by Light Volume - 2/5/2021 |
View all notes |
Set NEW NOTE alert |
Company Profile |
SEC
News |
Chart |
Request a new note
C
A
S
I |
SMPL
-
NASDAQ
Simply Good Foods Co
Food-Confectionery
|
$28.12
|
-0.43
-1.51% |
$29.04
|
453,601
40.27% of 50 DAV
50 DAV is 1,126,300
|
$32.03
-12.21%
|
12/28/2020
|
$30.40
|
PP = $31.44
|
|
MB = $33.01
|
Most Recent Note - 2/19/2021 5:32:39 PM
G - Pulled back today for a 5th consecutive loss and violated its 50 DMA line ($28.35) raising concerns. Its Relative Strength Rating is 59, well below the 80+ minimum guideline. Its prior low ($26.78) defines the next important near term support to watch.
>>> FEATURED STOCK ARTICLE : Pulling Back Quietly After Rebounding Near All-Time High - 2/17/2021 |
View all notes |
Set NEW NOTE alert |
Company Profile |
SEC
News |
Chart |
Request a new note
C
A
S
I |
ALRM
-
NASDAQ
Alarm.com Holdings Inc
Security/Sfty
|
$99.29
|
+1.60
1.64% |
$100.84
|
304,239
67.31% of 50 DAV
50 DAV is 452,000
|
$108.67
-8.63%
|
2/9/2021
|
$71.88
|
PP = $108.67
|
|
MB = $114.10
|
Most Recent Note - 2/16/2021 6:00:25 PM
Y - There was a "negative reversal" today. Due to report Dec '20 quarterly results on 2/25/21. Color code was recently changed to yellow as it was noted that a valid secondary buy point exists up to 5% above the prior high since it found support at its 10 week moving average (WMA) line.
>>> FEATURED STOCK ARTICLE : Perched Near Prior High After Finding Support at 10 WMA - 2/11/2021 |
View all notes |
Set NEW NOTE alert |
Company Profile |
SEC
News |
Chart |
Request a new note
C
A
S
I |
TEAM
-
NASDAQ
Atlassian Corp Plc Cl A
Comp Sftwr-Spec Enterprs
|
$258.41
|
+1.68
0.65% |
$262.40
|
1,966,452
142.29% of 50 DAV
50 DAV is 1,382,000
|
$258.77
-0.14%
|
10/12/2020
|
$193.77
|
PP = $199.60
|
|
MB = $209.58
|
Most Recent Note - 2/16/2021 5:54:47 PM
G - Quietly hovering at its all-time high. Rebounded impressively from a brief dip below its 50 DMA line ($235.70). Recent low ($208.62 on 1/27/21) defines important near-term support to watch. Its current Relative Strength Rating is 70, below the +80 minimum guideline for buy candidates. Fundamental concerns remain after earnings rose +0% on +23% sales revenues for the Dec '20 quarter versus the year ago period, its 2nd comparison below the +25% minimum earnings guideline (C criteria).
>>> FEATURED STOCK ARTICLE : Quietly Touched a New High Despite Fundamental Concerns Noted - 2/8/2021 |
View all notes |
Set NEW NOTE alert |
Company Profile |
SEC
News |
Chart |
Request a new note
C
A
S
I |
SHOP
-
NYSE
Shopify Inc Cl A
Computer Sftwr-Enterprse
|
$1,435.01
|
+50.44
3.64% |
$1,438.64
|
1,321,907
99.99% of 50 DAV
50 DAV is 1,322,000
|
$1,499.75
-4.32%
|
2/2/2021
|
$1,218.72
|
PP = $1,285.28
|
|
MB = $1,349.54
|
Most Recent Note - 2/19/2021 5:29:45 PM
G - Posted a big gain on average volume today. Prior high ($1,285 on 12/22/20) defines important support to watch above its 50 DMA line ($1,209). Reported Dec '20 quarterly earnings +267% on +94% sales revenues versus the year ago period.
>>> FEATURED STOCK ARTICLE : Perched Within Striking Distance of New Pivot Point - 2/3/2021 |
View all notes |
Set NEW NOTE alert |
Company Profile |
SEC
News |
Chart |
Request a new note
C
A
S
I |
Symbol/Exchange
Company Name
Industry Group |
PRICE |
CHANGE
(%Change) |
Day High |
Volume
(% DAV)
(% 50 day avg vol) |
52 Wk Hi
% From Hi |
Featured
Date |
Price
Featured |
Pivot Featured |
|
Max Buy |
YETI
-
NYSE
Yeti Holdings Inc
Leisure-Products
|
$74.99
|
+3.74
5.25% |
$75.18
|
2,037,316
138.88% of 50 DAV
50 DAV is 1,467,000
|
$80.89
-7.29%
|
2/19/2021
|
$74.99
|
PP = $80.99
|
|
MB = $85.04
|
Most Recent Note - 2/19/2021 5:39:34 PM
Y - Rebounded toward prior highs with today's big volume-driven gain helping it make more progress above its 50 DMA line ($71.45). Color code is changed to yellow with new pivot point cited based on its 1/14/21 high plus 10 cents as it has formed a 6-week flat base. Subsequent gains above the pivot point backed by at least 40% above average volume may trigger a new (or add-on) technical buy signal. Reported Dec '20 quarterly earnings +72% on +26% sales revenues versus the year ago period. Prior low ($64.80) on 2/01/21) defines important near term support where a violation may trigger a more worrisome technical sell signal. See the latest FSU analysis for more details and a new annotated graph.
>>> FEATURED STOCK ARTICLE : Rebounded Just Above 50-Day Moving Average Line - 2/18/2021 |
View all notes |
Set NEW NOTE alert |
Company Profile |
SEC
News |
Chart |
Request a new note
C
A
S
I |
BJ
-
NYSE
BJs Wholesale Club Hldgs
Retail-DiscountandVariety
|
$44.66
|
-0.11
-0.25% |
$45.24
|
2,150,152
96.02% of 50 DAV
50 DAV is 2,239,300
|
$50.18
-11.00%
|
1/28/2021
|
$44.74
|
PP = $47.56
|
|
MB = $49.94
|
Most Recent Note - 2/17/2021 5:30:07 PM
G - Volume totals have been cooling while stubbornly holding its ground. Color code is changed to green as its Relative Strength rating has slumped to 63, well below the 80+ minimum for buy candidates. The prior low and 50 DMA line define important near term support in the $40 area.
>>> FEATURED STOCK ARTICLE : Pulled Back After Breakout Capped 7-Day Winning Streak - 1/28/2021 |
View all notes |
Set NEW NOTE alert |
Company Profile |
SEC
News |
Chart |
Request a new note
C
A
S
I |
DOCU
-
NASDAQ
Docusign Inc
Computer Sftwr-Enterprse
|
$265.16
|
+4.17
1.60% |
$269.91
|
2,162,499
72.45% of 50 DAV
50 DAV is 2,985,000
|
$290.23
-8.64%
|
1/12/2021
|
$253.50
|
PP = $256.10
|
|
MB = $268.91
|
Most Recent Note - 2/16/2021 5:46:59 PM
Y - Up again today wedging higher with gains lacking great volume since its rebound above the 50 DMA line ($241) helped its outlook improve. Faces little resistance due to overhead supply. Fundamentals remain strong.
>>> FEATURED STOCK ARTICLE : Consolidating Back Above 50-Day Moving Average Near Prior High - 2/9/2021 |
View all notes |
Set NEW NOTE alert |
Company Profile |
SEC
News |
Chart |
Request a new note
C
A
S
I |
DT
-
NYSE
Dynatrace Inc
Computer Sftwr-Enterprse
|
$52.88
|
-0.11
-0.21% |
$54.82
|
2,214,376
90.38% of 50 DAV
50 DAV is 2,450,000
|
$56.77
-6.85%
|
2/4/2021
|
$51.39
|
PP = $48.95
|
|
MB = $51.40
|
Most Recent Note - 2/17/2021 5:31:58 PM
G - Pulled back with below average volume today for a 6th consecutive loss, retreating from its all-time high following a streak of 6 consecutive gains. Prior highs in the $48 area define initial support to watch above its 50 DMA line ($44.58). Fundamentals remain strong after it reported Dec '20 earnings +70% on +28% sales revenues versus the year ago period.
>>> FEATURED STOCK ARTICLE : Breakout Action Returns Dynatrace to Featured Stocks List - 2/4/2021 |
View all notes |
Set NEW NOTE alert |
Company Profile |
SEC
News |
Chart |
Request a new note
C
A
S
I |
QTWO
-
NYSE
Q2 Holdings Inc
Computer Sftwr-Financial
|
$137.50
|
+0.27
0.20% |
$140.91
|
788,694
162.55% of 50 DAV
50 DAV is 485,200
|
$148.56
-7.44%
|
11/12/2020
|
$105.14
|
PP = $106.54
|
|
MB = $111.87
|
Most Recent Note - 2/19/2021 5:28:16 PM
G - Halted its slide today after suffering a big volume-driven loss on the prior session. Weak action came after it reported Dec '20 quarterly earnings -95% on +26% sales revenues versus the year ago period, below the +25% minimum earnings guideline (C criteria), raising fundamental concerns. Volume and volatility often increase near earnings news. Extended from any sound base, its 50 DMA line ($130) defines important near term support to watch above the prior low ($126.52 on 2/01/21). See the latest FSU analysis for more details and a new annotated graph.
>>> FEATURED STOCK ARTICLE : Pullback on Heavy Volume Followed Weak Quarterly Earnings Report - 2/19/2021 |
View all notes |
Set NEW NOTE alert |
Company Profile |
SEC
News |
Chart |
Request a new note
C
A
S
I |
Symbol/Exchange
Company Name
Industry Group |
PRICE |
CHANGE
(%Change) |
Day High |
Volume
(% DAV)
(% 50 day avg vol) |
52 Wk Hi
% From Hi |
Featured
Date |
Price
Featured |
Pivot Featured |
|
Max Buy |
AXON
-
NASDAQ
Axon Enterprise Inc
Security/Sfty
|
$177.00
|
+3.25
1.87% |
$180.99
|
457,654
65.85% of 50 DAV
50 DAV is 695,000
|
$212.37
-16.65%
|
12/22/2020
|
$127.84
|
PP = $130.51
|
|
MB = $137.04
|
Most Recent Note - 2/16/2021 5:58:19 PM
G - Suffered a big volume-driven loss today, yet it is still well above support at its 50 DMA line ($146). Fundamentals remain strong. Formerly traded under the ticker symbol AAXN where prior notes and detailed analysis may be reviewed.
>>> FEATURED STOCK ARTICLE : Extended From Prior Base Following Streak fo Volume-Driven Gains - 2/2/2021 |
View all notes |
Set NEW NOTE alert |
Company Profile |
SEC
News |
Chart |
Request a new note
C
A
S
I |
|
|
|
THESE ARE NOT BUY RECOMMENDATIONS!
Comments contained in the body of this report are technical
opinions only. The material herein has been obtained
from sources believed to be reliable and accurate, however,
its accuracy and completeness cannot be guaranteed.
This site is not an investment advisor, hence it does
not endorse or recommend any securities or other investments.
Any recommendation contained in this report may not
be suitable for all investors and it is not to be deemed
an offer or solicitation on our part with respect to
the purchase or sale of any securities. All trademarks,
service marks and trade names appearing in this report
are the property of their respective owners, and are
likewise used for identification purposes only.
This report is a service available
only to active Paid Premium Members.
You may opt-out of receiving report notifications
at any time. Questions or comments may be submitted
by writing to Premium Membership Services 665 S.E. 10 Street, Suite 201 Deerfield Beach, FL 33441-5634 or by calling 1-800-965-8307
or 954-785-1121.
|
|
|