You are not logged in.
This means you
CAN ONLY VIEW reports that were published prior to Thursday, March 20, 2025.
You
MUST UPGRADE YOUR MEMBERSHIP if you want to see any current reports.
AFTER MARKET UPDATE - WEDNESDAY, FEBRUARY 17TH, 2021
Previous After Market Report Next After Market Report >>>
|
|
|
|
DOW |
+90.27 |
31,613.02 |
+0.29% |
|
Volume |
967,452,604 |
-5% |
|
Volume |
7,179,005,800 |
-5% |
|
NASDAQ |
-80.62 |
13,966.88 |
-0.57% |
|
Advancers |
1,390 |
44% |
|
Advancers |
1,563 |
40% |
|
S&P 500 |
-1.26 |
3,931.33 |
-0.03% |
|
Decliners |
1,791 |
56% |
|
Decliners |
2,384 |
60% |
|
Russell 2000 |
-16.78 |
2,256.11 |
-0.74% |
|
52 Wk Highs |
164 |
|
|
52 Wk Highs |
237 |
|
|
S&P 600 |
-7.06 |
1,286.82 |
-0.55% |
|
52 Wk Lows |
10 |
|
|
52 Wk Lows |
18 |
|
|
 |
Major Indices Were Mixed With Less Leadership
Kenneth J. Gruneisen - Passed the CAN SLIM® Master's Exam
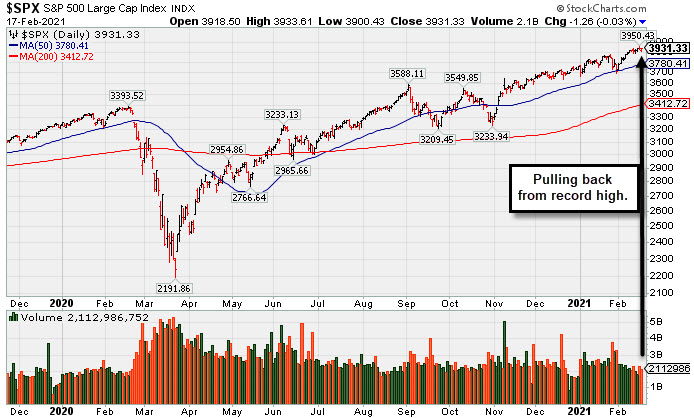
The Dow rose 90 points, closing at a new all-time high for a third consecutive session. The S&P 500 fell less than 0.1%, while the Nasdaq Composite slid 0.6% amid weakness in tech-related companies. The volume totals were lighter than the prior session on the NYSE and on the Nasdaq exchange. Decliners led advancers by a 9-7 margin on the NYSE and 3-2 on the Nasdaq exchange. There were 45 high-ranked companies from the Leaders List that hit new 52-week highs and were listed on the BreakOuts Page, versus the total of 139 on the prior session. New 52-week highs totals contracted yet still easily outnumbered new 52-week lows totals on both exchanges. The major indices are in a confirmed uptrend (M criteria) with healthy leadership provided by many stocks hitting new highs. Investors are reminded to always make buying and selling decisions based based on the strict criteria and rules of the fact-based investment system. PICTURED: The S&P 500 Index is quietly pulling back from its record high.
U.S. stocks fluctuated on Wednesday as investors assessed the latest economic data and moves in Treasury yields. The minutes from the Federal Reserve's January meeting also garnered attention, as the release reiterated the U.S. central bank's stance that accommodate monetary policy would remain in place for some time.
Stronger than expected economic updates highlighted the recovery in the U.S. economy, but also fueled concerns surrounding a rapid rise in inflation. A report showed retail sales surged 5.3% in January, its second-largest monthly advance on record and rebounding from the prior month's downwardly revised 1% decline. Meanwhile, producer prices jumped 1.3% last month, the biggest gain since 2009 and well above expectations of a 0.4% increase. Finally, the NAHB Housing Market Index showed homebuilder sentiment improved modestly in February. Despite the better-than-anticipated data, Treasuries rebounded from their recent sell-off. The yield on the 10-year note briefly touched 1.33% before reversing its advance, slipping two basis points to 1.28%.
Eight of 11 S&P 500 sectors finished in positive territory. Energy paced the gains with WTI crude adding 1.9% to $61.21/barrel, near its best level in two years despite Saudi Arabia reportedly planning to boost production. Information Technology shares led laggards, with chipmakers weighing on the group. In corporate news, Verizon (VZ +5.24%) and Chevron (CVX +3.02%) both rose after Warren Buffett's Berkshire Hathaway (BRKB -0.03%) disclosed a large stake both companies. |
 Kenneth J. Gruneisen started out as a licensed stockbroker in August 1987, a couple of months prior to the historic stock market crash that took the Dow Jones Industrial Average down -22.6% in a single day. He has published daily fact-based fundamental and technical analysis on high-ranked stocks online for two decades. Through FACTBASEDINVESTING.COM, Kenneth provides educational articles, news, market commentary, and other information regarding proven investment systems that work in good times and bad.
Comments contained in the body of this report are technical opinions only and are not necessarily those of Gruneisen Growth Corp. The material herein has been obtained from sources believed to be reliable and accurate, however, its accuracy and completeness cannot be guaranteed. Our firm, employees, and customers may effect transactions, including transactions contrary to any recommendation herein, or have positions in the securities mentioned herein or options with respect thereto. Any recommendation contained in this report may not be suitable for all investors and it is not to be deemed an offer or solicitation on our part with respect to the purchase or sale of any securities. |
|
 |
Retail, Bank, Biotech, and Integrated Oil Indexes Rose
Kenneth J. Gruneisen - Passed the CAN SLIM® Master's Exam
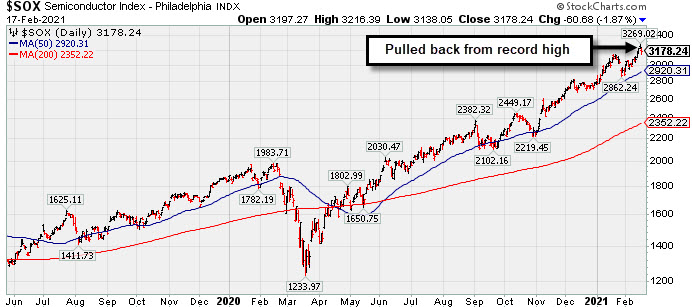
Gains from the Retail Index ($RLX +1.16%) and Bank Index ($BKX +0.39%) were a positive influence on the major averages while the Broker/Dealer Index ($XBD -0.55%) edged lower. The tech sector was mixed as the Biotech Index ($BTK +1.00%) rose while the Semiconductor Index ($SOX -1.83%) and Networking Index ($NWX -1.49%) both lost ground. Commodity-linked groups also were mixed as the Integrated Oil Index ($XOI +1.21%) posted a gain while the Oil Services Index ($OSX -0.15%) ended slightly lower and the Gold & Silver Index ($XAU -1.84%) fell.
PICTURED: The Semiconductor Index ($SOX -1.83%) pulled back from a record high. It found prompt support well above the 50-day moving average (DMA) line during the recent consolidation.
| Oil Services |
$OSX |
53.21 |
-0.08 |
-0.15% |
+20.04% |
| Integrated Oil |
$XOI |
951.81 |
+11.42 |
+1.21% |
+20.10% |
| Semiconductor |
$SOX |
3,179.57 |
-59.35 |
-1.83% |
+13.74% |
| Networking |
$NWX |
821.10 |
-12.44 |
-1.49% |
+14.50% |
| Broker/Dealer |
$XBD |
437.03 |
-2.40 |
-0.55% |
+15.74% |
| Retail |
$RLX |
3,691.44 |
+42.18 |
+1.16% |
+3.60% |
| Gold & Silver |
$XAU |
137.43 |
-2.57 |
-1.84% |
-4.69% |
| Bank |
$BKX |
112.23 |
+0.43 |
+0.39% |
+14.62% |
| Biotech |
$BTK |
6,129.13 |
+60.53 |
+1.00% |
+6.80% |
|
|
|
 |
Pulling Back Quietly After Rebounding Near All-Time High
Kenneth J. Gruneisen - Passed the CAN SLIM® Master's Exam
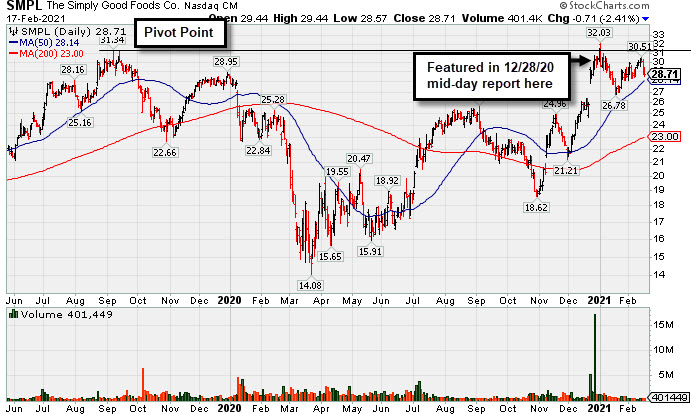
Simply Good Foods Co (SMPL -$0.71 or -2.41% to $28.71) pulled back for a third consecutive loss with light volume. It has recently been perched within striking distance of its 52-week high, however its Relative Strength Rating is 64, still below the 80+ minimum guideline. Its 50-day moving average (DMA) line ($28.02) defines near term support to watch above the prior low ($26.78) .
SMPL was last shown in this FSU section on 1/21/21 with an annotated graph included under the headline, "Relative Strength Rating Suffered During Stalling Action". It was first highlighted in yellow with pivot point cited based on its 9/09/19 high plus 10 cents in the 12/28/20 mid-day report (read here).
Fundamentals remain strong. It report Nov '20 quarterly earnings +32% on +52% sales revenues versus the year ago period, its 4th consecutive quarterly comparison above the +25% minimum earnings guideline (C criteria). Its annual earnings history (A criteria) has been strong.
SMPL completed a new Pubic Offering on 10/09/19. The company has a Timeliness Rating of C and Sponsorship Rating of C. The number of top-rated funds owning its shares fell from 442 in Dec '19 to 347 in Dec '20, however, its current Up/Down Volume Ratio of 2.9 is an unbiased indication its shares have been under accumulation over the past 50 days.
Some leadership has been provided by other companies in the Food/Beverage Sector, however, the Food-Confectionery industry group has a Group Relative Strength Rating of 4 (E) which is a concern regarding the L criteria. There are only 5 companies listed in the group.
|
|
|
Color Codes Explained :
Y - Better candidates highlighted by our
staff of experts.
G - Previously featured
in past reports as yellow but may no longer be buyable under the
guidelines.
***Last / Change / Volume data in this table is the closing quote data***
Symbol/Exchange
Company Name
Industry Group |
PRICE |
CHANGE
(%Change) |
Day High |
Volume
(% DAV)
(% 50 day avg vol) |
52 Wk Hi
% From Hi |
Featured
Date |
Price
Featured |
Pivot Featured |
|
Max Buy |
 CRL
-
NYSE
CRL
-
NYSE
Charles River Labs Intl
DRUGS - Biotechnology
|
$299.48
|
+12.74
4.44% |
$303.79
|
747,677
248.15% of 50 DAV
50 DAV is 301,300
|
$295.77
1.25%
|
12/17/2020
|
$247.06
|
PP = $257.98
|
|
MB = $270.88
|
 Most Recent Note - 2/17/2021 12:16:19 PM
G - Reported Dec '20 quarterly earnings +19% on +14% sales revenues versus the year ago period, below the +25% minimum earnings guideline (C criteria). Hitting a new record high today. Volume and volatility often increase near earnings news.
>>> FEATURED STOCK ARTICLE : Testing Important Support on Pullback - 1/29/2021 |
View all notes |
Set NEW NOTE alert |
Company Profile |
SEC
News |
Chart |
Request a new note
C
A
S
I |
AMD
-
NYSE
Advanced Micro Devices
ELECTRONICS - Semiconductor - Broad Line
|
$89.94
|
-1.52
-1.66% |
$90.96
|
32,158,623
75.24% of 50 DAV
50 DAV is 42,740,200
|
$99.23
-9.36%
|
11/18/2020
|
$82.54
|
PP = $88.72
|
|
MB = $93.16
|
Most Recent Note - 2/17/2021 5:28:11 PM
G - Quietly slumped back below its 50 DMA line ($91.92) with 2 consecutive quiet losses. Its current Relative Strength rating of 60 is well below the 80+ minimum guideline for buy candidates, however, it remains only -9.4% off its high. Fundamentals remain strong after it reported Dec '20 quarterly earnings +63% on +53% sales revenues versus the year ago period.
>>> FEATURED STOCK ARTICLE : Close Above 50-Day Moving Average But Relative Strength a Concern - 2/10/2021 |
View all notes |
Set NEW NOTE alert |
Company Profile |
SEC
News |
Chart |
Request a new note
C
A
S
I |
AMRC
-
NYSE
Ameresco Inc Cl A
ENERGY - Alternative
|
$64.62
|
-1.74
-2.62% |
$65.78
|
356,779
78.41% of 50 DAV
50 DAV is 455,000
|
$70.26
-8.03%
|
12/15/2020
|
$46.72
|
PP = $47.10
|
|
MB = $49.46
|
Most Recent Note - 2/17/2021 12:07:11 PM
G - Retreating from its all-time high, it is extended from any sound base. Its 50-day moving average (DMA) line ($55.60) defines near-term support to watch..
>>> FEATURED STOCK ARTICLE : Rebounding After Retreat From Record High - 2/1/2021 |
View all notes |
Set NEW NOTE alert |
Company Profile |
SEC
News |
Chart |
Request a new note
C
A
S
I |
TREX
-
NYSE
Trex Company Inc
MATERIALS and CONSTRUCTION - General Building Materials
|
$104.56
|
-0.11
-0.11% |
$105.57
|
513,035
73.50% of 50 DAV
50 DAV is 698,000
|
$107.64
-2.86%
|
6/26/2020
|
$54.53
|
PP = $66.47
|
|
MB = $69.79
|
Most Recent Note - 2/16/2021 5:39:48 PM
G - Recently wedged to new all-time highs with gains backed by below average volume. Its 50 DMA line ($89.56) and prior low define important support to watch on pullbacks. Due to report Dec '20 quarterly results on 2/22/21. Sep '20 quarterly earnings were +14% on +19% sales revenues versus the year ago period, below the +25% minimum guideline (C criteria) raising fundamental concerns. See the latest FSU analysis for more details and a new annotated graph.
>>> FEATURED STOCK ARTICLE : Wedged to New Highs With Earnings Report Due Soon - 2/16/2021 |
View all notes |
Set NEW NOTE alert |
Company Profile |
SEC
News |
Chart |
Request a new note
C
A
S
I |
CLFD
-
NASDAQ
Clearfield Inc
TELECOMMUNICATIONS - Cables / Satalite Equipment
|
$36.33
|
-1.77
-4.65% |
$38.15
|
241,362
160.91% of 50 DAV
50 DAV is 150,000
|
$38.75
-6.25%
|
1/20/2021
|
$31.38
|
PP = $28.42
|
|
MB = $29.84
|
Most Recent Note - 2/17/2021 12:09:21 PM
G - Retreating from its all-time high with a big loss today following 3 consecutive gains with above average volume. Very extended from any sound base. Prior highs in the $28 area define important support to watch coinciding with its 50 DMA line ($28.92). Reported Dec '20 quarterly earnings +475% on +40% sales revenues versus the year ago period, continuing its strong earning track record.
>>> FEATURED STOCK ARTICLE : Perched Near Record High With Earnings Report Due Soon - 1/27/2021 |
View all notes |
Set NEW NOTE alert |
Company Profile |
SEC
News |
Chart |
Request a new note
C
A
S
I |
Symbol/Exchange
Company Name
Industry Group |
PRICE |
CHANGE
(%Change) |
Day High |
Volume
(% DAV)
(% 50 day avg vol) |
52 Wk Hi
% From Hi |
Featured
Date |
Price
Featured |
Pivot Featured |
|
Max Buy |
NOW
-
NYSE
Servicenow Inc
Computer Sftwr-Enterprse
|
$580.94
|
-4.80
-0.82% |
$583.14
|
863,835
63.85% of 50 DAV
50 DAV is 1,353,000
|
$598.37
-2.91%
|
8/20/2020
|
$453.34
|
PP = $454.79
|
|
MB = $477.53
|
Most Recent Note - 2/17/2021 5:34:27 PM
G - Holding its ground stubbornly, it closed today only -2.9% off its all-time high, and volume totals have been cooling. Relative Strength rating has slumped to 67, well below the 80+ minimum guideline for buy candidates. A new pivot point was not cited due to fundamental concerns noted as its impressive rally has continued. Gapped up on 1/28/21 promptly rebounding above its 50 DMA line ($547). Fundamental concerns remain after it reported Dec '20 quarterly earnings +22% on +31% sales revenues versus the year ago period, its 2nd consecutive comparison below the +25% minimum guideline (C criteria) of the fact-based investment system.
>>> FEATURED STOCK ARTICLE : Hit New Highs With Latest Gains Backed by Light Volume - 2/5/2021 |
View all notes |
Set NEW NOTE alert |
Company Profile |
SEC
News |
Chart |
Request a new note
C
A
S
I |
SMPL
-
NASDAQ
Simply Good Foods Co
Food-Confectionery
|
$28.71
|
-0.71
-2.41% |
$29.44
|
401,449
34.88% of 50 DAV
50 DAV is 1,150,900
|
$32.03
-10.37%
|
12/28/2020
|
$30.40
|
PP = $31.44
|
|
MB = $33.01
|
Most Recent Note - 2/17/2021 5:25:41 PM
G - Pulled back for a 3rd consecutive loss today with light volume after it was perched within striking distance of its 52-week high. Its Relative Strength Rating is 60, still below the 80+ minimum guideline. Its 50 DMA line ($28.14) and prior low ($26.78) define near term support to watch. See the latest FSU analysis for more details and a new annotated graph.
>>> FEATURED STOCK ARTICLE : Pulling Back Quietly After Rebounding Near All-Time High - 2/17/2021 |
View all notes |
Set NEW NOTE alert |
Company Profile |
SEC
News |
Chart |
Request a new note
C
A
S
I |
ALRM
-
NASDAQ
Alarm.com Holdings Inc
Security/Sfty
|
$97.41
|
-3.21
-3.19% |
$99.42
|
409,179
90.33% of 50 DAV
50 DAV is 453,000
|
$108.67
-10.36%
|
2/9/2021
|
$71.88
|
PP = $108.67
|
|
MB = $114.10
|
Most Recent Note - 2/16/2021 6:00:25 PM
Y - There was a "negative reversal" today. Due to report Dec '20 quarterly results on 2/25/21. Color code was recently changed to yellow as it was noted that a valid secondary buy point exists up to 5% above the prior high since it found support at its 10 week moving average (WMA) line.
>>> FEATURED STOCK ARTICLE : Perched Near Prior High After Finding Support at 10 WMA - 2/11/2021 |
View all notes |
Set NEW NOTE alert |
Company Profile |
SEC
News |
Chart |
Request a new note
C
A
S
I |
TEAM
-
NASDAQ
Atlassian Corp Plc
Comp Sftwr-Spec Enterprs
|
$250.53
|
+1.58
0.63% |
$251.27
|
1,122,805
80.21% of 50 DAV
50 DAV is 1,399,900
|
$257.01
-2.52%
|
10/12/2020
|
$193.77
|
PP = $199.60
|
|
MB = $209.58
|
Most Recent Note - 2/16/2021 5:54:47 PM
G - Quietly hovering at its all-time high. Rebounded impressively from a brief dip below its 50 DMA line ($235.70). Recent low ($208.62 on 1/27/21) defines important near-term support to watch. Its current Relative Strength Rating is 70, below the +80 minimum guideline for buy candidates. Fundamental concerns remain after earnings rose +0% on +23% sales revenues for the Dec '20 quarter versus the year ago period, its 2nd comparison below the +25% minimum earnings guideline (C criteria).
>>> FEATURED STOCK ARTICLE : Quietly Touched a New High Despite Fundamental Concerns Noted - 2/8/2021 |
View all notes |
Set NEW NOTE alert |
Company Profile |
SEC
News |
Chart |
Request a new note
C
A
S
I |
SHOP
-
NYSE
Shopify Inc Cl A
Computer Sftwr-Enterprse
|
$1,425.00
|
-49.00
-3.32% |
$1,459.62
|
3,628,518
285.49% of 50 DAV
50 DAV is 1,271,000
|
$1,499.75
-4.98%
|
2/2/2021
|
$1,218.72
|
PP = $1,285.28
|
|
MB = $1,349.54
|
Most Recent Note - 2/17/2021 12:47:56 PM
G - Reported Dec '20 quarterly earnings +267% on +94% sales revenues versus the year ago period. Rebounded considerably from today's big early loss after briefly undercutting its "max buy" level. Prior high ($1,285 on 12/22/20) defines important support to watch above its 50 DMA line ($1,195).
>>> FEATURED STOCK ARTICLE : Perched Within Striking Distance of New Pivot Point - 2/3/2021 |
View all notes |
Set NEW NOTE alert |
Company Profile |
SEC
News |
Chart |
Request a new note
C
A
S
I |
Symbol/Exchange
Company Name
Industry Group |
PRICE |
CHANGE
(%Change) |
Day High |
Volume
(% DAV)
(% 50 day avg vol) |
52 Wk Hi
% From Hi |
Featured
Date |
Price
Featured |
Pivot Featured |
|
Max Buy |
YETI
-
NYSE
Yeti Holdings Inc
Leisure-Products
|
$67.65
|
-1.83
-2.63% |
$69.50
|
2,310,419
162.25% of 50 DAV
50 DAV is 1,424,000
|
$80.89
-16.37%
|
11/5/2020
|
$57.25
|
PP = $55.14
|
|
MB = $57.90
|
Most Recent Note - 2/16/2021 6:04:24 PM
G - Suffered a big loss and closed below the 50 DMA line ($71) today and above average volume was behind 2 losses in the past 3 sessions. Reported Dec '20 quarterly earnings +72% on +26% sales revenues versus the year ago period. It has not formed a sound base of sufficient length. Prior low ($64.80) on 2/01/21) defines important near term support where a violation may trigger a more worrisome technical sell signal.
>>> FEATURED STOCK ARTICLE : 50-Day Moving Average and Prior Lows Define Near-Term Support - 1/22/2021 |
View all notes |
Set NEW NOTE alert |
Company Profile |
SEC
News |
Chart |
Request a new note
C
A
S
I |
BJ
-
NYSE
BJs Wholesale Club Hldgs
Retail-DiscountandVariety
|
$43.81
|
+0.35
0.81% |
$43.96
|
1,008,827
43.61% of 50 DAV
50 DAV is 2,313,300
|
$50.18
-12.69%
|
1/28/2021
|
$44.74
|
PP = $47.56
|
|
MB = $49.94
|
Most Recent Note - 2/17/2021 5:30:07 PM
G - Volume totals have been cooling while stubbornly holding its ground. Color code is changed to green as its Relative Strength rating has slumped to 63, well below the 80+ minimum for buy candidates. The prior low and 50 DMA line define important near term support in the $40 area.
>>> FEATURED STOCK ARTICLE : Pulled Back After Breakout Capped 7-Day Winning Streak - 1/28/2021 |
View all notes |
Set NEW NOTE alert |
Company Profile |
SEC
News |
Chart |
Request a new note
C
A
S
I |
DOCU
-
NASDAQ
Docusign Inc
Computer Sftwr-Enterprse
|
$254.98
|
-9.71
-3.67% |
$262.21
|
2,372,120
67.83% of 50 DAV
50 DAV is 3,497,000
|
$290.23
-12.15%
|
1/12/2021
|
$253.50
|
PP = $256.10
|
|
MB = $268.91
|
Most Recent Note - 2/16/2021 5:46:59 PM
Y - Up again today wedging higher with gains lacking great volume since its rebound above the 50 DMA line ($241) helped its outlook improve. Faces little resistance due to overhead supply. Fundamentals remain strong.
>>> FEATURED STOCK ARTICLE : Consolidating Back Above 50-Day Moving Average Near Prior High - 2/9/2021 |
View all notes |
Set NEW NOTE alert |
Company Profile |
SEC
News |
Chart |
Request a new note
C
A
S
I |
DT
-
NYSE
Dynatrace Inc
Computer Sftwr-Enterprse
|
$52.50
|
-0.47
-0.89% |
$52.75
|
1,643,983
67.65% of 50 DAV
50 DAV is 2,430,000
|
$56.77
-7.52%
|
2/4/2021
|
$51.39
|
PP = $48.95
|
|
MB = $51.40
|
Most Recent Note - 2/17/2021 5:31:58 PM
G - Pulled back with below average volume today for a 6th consecutive loss, retreating from its all-time high following a streak of 6 consecutive gains. Prior highs in the $48 area define initial support to watch above its 50 DMA line ($44.58). Fundamentals remain strong after it reported Dec '20 earnings +70% on +28% sales revenues versus the year ago period.
>>> FEATURED STOCK ARTICLE : Breakout Action Returns Dynatrace to Featured Stocks List - 2/4/2021 |
View all notes |
Set NEW NOTE alert |
Company Profile |
SEC
News |
Chart |
Request a new note
C
A
S
I |
QTWO
-
NYSE
Q2 Holdings Inc
Computer Sftwr-Financial
|
$144.56
|
-2.14
-1.46% |
$145.84
|
454,047
94.99% of 50 DAV
50 DAV is 478,000
|
$148.56
-2.69%
|
11/12/2020
|
$105.14
|
PP = $106.54
|
|
MB = $111.87
|
Most Recent Note - 2/16/2021 5:51:37 PM
G - Due to report Dec '20 quarterly results on Wednesday, 2/17/21 after the close. Volume and volatility often increase near earnings news. Inched high with today's gain on light volume, getting more extended from any sound base. Its 50 DMA line ($129.35) defines important near term support to watch on pullbacks.
>>> FEATURED STOCK ARTICLE : Perched Near All-Time High Stubbornly Holding Ground - 1/26/2021 |
View all notes |
Set NEW NOTE alert |
Company Profile |
SEC
News |
Chart |
Request a new note
C
A
S
I |
Symbol/Exchange
Company Name
Industry Group |
PRICE |
CHANGE
(%Change) |
Day High |
Volume
(% DAV)
(% 50 day avg vol) |
52 Wk Hi
% From Hi |
Featured
Date |
Price
Featured |
Pivot Featured |
|
Max Buy |
AXON
-
NASDAQ
Axon Enterprise Inc
Security/Sfty
|
$178.38
|
+2.45
1.39% |
$180.89
|
784,789
115.24% of 50 DAV
50 DAV is 681,000
|
$212.37
-16.01%
|
12/22/2020
|
$127.84
|
PP = $130.51
|
|
MB = $137.04
|
Most Recent Note - 2/16/2021 5:58:19 PM
G - Suffered a big volume-driven loss today, yet it is still well above support at its 50 DMA line ($146). Fundamentals remain strong. Formerly traded under the ticker symbol AAXN where prior notes and detailed analysis may be reviewed.
>>> FEATURED STOCK ARTICLE : Extended From Prior Base Following Streak fo Volume-Driven Gains - 2/2/2021 |
View all notes |
Set NEW NOTE alert |
Company Profile |
SEC
News |
Chart |
Request a new note
C
A
S
I |
|
|
|
THESE ARE NOT BUY RECOMMENDATIONS!
Comments contained in the body of this report are technical
opinions only. The material herein has been obtained
from sources believed to be reliable and accurate, however,
its accuracy and completeness cannot be guaranteed.
This site is not an investment advisor, hence it does
not endorse or recommend any securities or other investments.
Any recommendation contained in this report may not
be suitable for all investors and it is not to be deemed
an offer or solicitation on our part with respect to
the purchase or sale of any securities. All trademarks,
service marks and trade names appearing in this report
are the property of their respective owners, and are
likewise used for identification purposes only.
This report is a service available
only to active Paid Premium Members.
You may opt-out of receiving report notifications
at any time. Questions or comments may be submitted
by writing to Premium Membership Services 665 S.E. 10 Street, Suite 201 Deerfield Beach, FL 33441-5634 or by calling 1-800-965-8307
or 954-785-1121.
|
|
|