You are not logged in.
This means you
CAN ONLY VIEW reports that were published prior to Wednesday, March 26, 2025.
You
MUST UPGRADE YOUR MEMBERSHIP if you want to see any current reports.
AFTER MARKET UPDATE - TUESDAY, JANUARY 2ND, 2018
Previous After Market Report Next After Market Report >>>
|
|
|
|
DOW |
+104.79 |
24,824.01 |
+0.42% |
|
Volume |
815,219,600 |
+15% |
|
Volume |
1,931,694,280 |
+23% |
|
NASDAQ |
+103.51 |
7,006.90 |
+1.50% |
|
Advancers |
1,853 |
62% |
|
Advancers |
1,574 |
61% |
|
S&P 500 |
+22.20 |
2,695.81 |
+0.83% |
|
Decliners |
1,125 |
38% |
|
Decliners |
991 |
39% |
|
Russell 2000 |
+14.50 |
1,550.01 |
+0.94% |
|
52 Wk Highs |
187 |
|
|
52 Wk Highs |
174 |
|
|
S&P 600 |
+6.71 |
942.97 |
+0.72% |
|
52 Wk Lows |
35 |
|
|
52 Wk Lows |
24 |
|
|
 |
Breadth Positive as Major Indices Charged Higher With Higher Volume
Kenneth J. Gruneisen - Passed the CAN SLIM® Master's Exam
All U.S. equities advanced Tuesday. The Dow climbed 104 points to 24824 while the S&P 500 added 22 points to 2695. The Nasdaq Composite gained 103 points to 7006. Volume totals reported were higher than the prior session totals on the NYSE and on the Nasdaq exchange. Advancers led decliners by 3-2 margin on the NYSE and on the Nasdaq exchange. There were 54 high-ranked companies from the Leaders List that made new 52-week highs and were listed on the BreakOuts Page, versus the total of 55 on the prior session. New 52-week highs totals expanded and outnumbered new 52-week lows on the NYSE and on the Nasdaq exchange. The Featured Stocks Page provides the latest analysis on noteworthy high-ranked leaders. Charts used courtesy of www.stockcharts.com
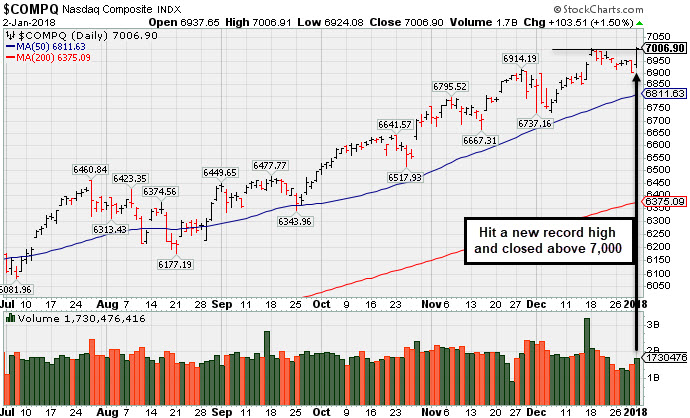
PICTURED: The Nasdaq Composite Index hit a new r its record high with volume totals cooling.
The major averages (M criteria) are in a confirmed uptrend. Investors should only consider stocks meeting all key criteria of the fact-based investment system as they trigger technical buy signals.
The major averages began 2018 on a positive note as investors remain optimistic about the strength of the U.S. economy. On the data front, research firm Markit revised its update on U.S. manufacturing to 55.1 in December from the previously reported 55. That represented the highest level in 11 months. In central bank news, an outer focus remains on Wednesday afternoon’s scheduled release of the FOMC’s December meeting minutes.
Seven of 11 S&P 500 sectors ended higher with Technology shares pacing gains. Google parent Alphabet (GOOG +1.76%) and Apple (AAPL +1.79%) both rose. Consumer Discretionary and Energy shares also outperformed. AutoZone Inc. (AZO +3.54%) and Advanced Auto Parts (AAP +6.42%) on expectations these retailers may benefit from the recent cold spell that has gripped the U.S. Utilities were notable underperformers today with PG&E Corp. (PCG -0.76%) and Scana Corp. (SCG -2.29%).
Treasuries finished lower along the curve as the yield on the benchmark 10- year note advanced five basis points to 2.46%. In commodities, NYMEX WTI crude was off less than 0.1% to $60.40/barrel. COMEX gold climbed 0.7% to $1318.10/ounce, the highest level since September. |
 Kenneth J. Gruneisen started out as a licensed stockbroker in August 1987, a couple of months prior to the historic stock market crash that took the Dow Jones Industrial Average down -22.6% in a single day. He has published daily fact-based fundamental and technical analysis on high-ranked stocks online for two decades. Through FACTBASEDINVESTING.COM, Kenneth provides educational articles, news, market commentary, and other information regarding proven investment systems that work in good times and bad.
Comments contained in the body of this report are technical opinions only and are not necessarily those of Gruneisen Growth Corp. The material herein has been obtained from sources believed to be reliable and accurate, however, its accuracy and completeness cannot be guaranteed. Our firm, employees, and customers may effect transactions, including transactions contrary to any recommendation herein, or have positions in the securities mentioned herein or options with respect thereto. Any recommendation contained in this report may not be suitable for all investors and it is not to be deemed an offer or solicitation on our part with respect to the purchase or sale of any securities. |
|
 |
Tech, Retail, Financial and Commodity-Linked
Kenneth J. Gruneisen - Passed the CAN SLIM® Master's Exam
The Retail Index ($RLX +1.36%) outpaced the Bank Index ($BKX +0.37%) and the Broker/Dealer Index ($XBD +0.51%) on Monday. Commodity-linked groups had a positive bias as the Gold & Silver Index ($XAU +3.36%) outpaced the Integrated Oil Index ($XOI +1.58%) and the Oil Services Index ($OSX +0.68%). The tech sector had a solidly positive bias as the Semiconductor Index ($SOX +2.77%) and the Biotechnology Index ($BTK +2.37%) both outpaced the Networking Index ($NWX +0.96%). Charts courtesy wwwstockcharts.com
 PICTURED: The Gold & Silver Index ($XAU +3.36%) is hovering near its record high.
| Oil Services |
$OSX |
150.57 |
+1.02 |
+0.68% |
-18.07% |
| Integrated Oil |
$XOI |
1,356.61 |
+21.05 |
+1.58% |
+6.99% |
| Semiconductor |
$SOX |
1,287.70 |
+34.65 |
+2.77% |
+42.06% |
| Networking |
$NWX |
495.23 |
+4.69 |
+0.96% |
+11.01% |
| Broker/Dealer |
$XBD |
266.60 |
+1.36 |
+0.51% |
+29.87% |
| Retail |
$RLX |
1,757.31 |
+23.54 |
+1.36% |
+30.85% |
| Gold & Silver |
$XAU |
88.14 |
+2.87 |
+3.37% |
+11.77% |
| Bank |
$BKX |
107.11 |
+0.40 |
+0.37% |
+16.69% |
| Biotech |
$BTK |
4,322.11 |
+99.90 |
+2.37% |
+40.56% |
|
|
|
 |
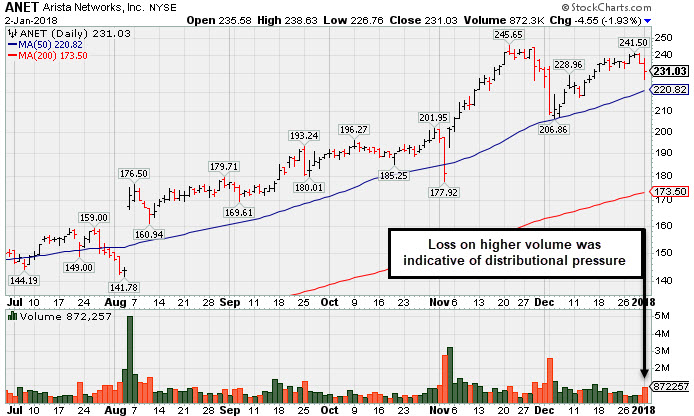
Encountering Distributional Pressure After Wedging Near Prior High
Kenneth J. Gruneisen - Passed the CAN SLIM® Master's Exam
Arista Networks Inc (ANET -4.55 or -1.93% to $231.03) ended the session -6% off its all-time high. Its 50-day moving average (DMA) line ($220.82) defines near-term support above the prior low ($206.86 on 12/05/17). Subsequent violations would trigger technical sell signals.
Fundamentals remain very strong, as ANET reported earnings +95% on +51% sales revenues for the Sep '17 quarter. It has shown strong and steady increases in quarterly sales revenues while earnings have routinely been well above the +25% minimum guideline (C criteria). Its annual earnings (A criteria) growth has been strong, however, its history is limited since its $43 IPO in June of 2014.
ANET traded up as much as +161.8% since first highlighted at $93.80 in yellow with pivot point cited based on its 2015 high plus 10 cents in the 11/21/16 mid-day report (read here). It was last shown in this FSU section on 12/06/17 with an annotated graph under the headline, "Halted Volume-Driven Pullback at 50-Day Moving Average Line."
The number of top-rated funds owning its shares rose from 360 in Dec '15 to 691 Sep '17, a reassuring sign concerning the I criteria. Its current Up/Down Volume Ratio of 1.7 is an unbiased indication its shares have been under accumulation over the past 50 days. The high-ranked Computer - Networking firm has a Timeliness Rating of A and a Sponsorship Rating of B. Its small supply of 45.3 million shares (S criteria) in the public float may contribute to greater volatility in the event of institutional buying or selling.
|
|
|
Color Codes Explained :
Y - Better candidates highlighted by our
staff of experts.
G - Previously featured
in past reports as yellow but may no longer be buyable under the
guidelines.
***Last / Change / Volume data in this table is the closing quote data***
Symbol/Exchange
Company Name
Industry Group |
PRICE |
CHANGE
(%Change) |
Day High |
Volume
(% DAV)
(% 50 day avg vol) |
52 Wk Hi
% From Hi |
Featured
Date |
Price
Featured |
Pivot Featured |
|
Max Buy |
THO
-
NYSE
Thor Industries Inc
AUTOMOTIVE - Recreational Vehicles
|
$155.36
|
+4.64
3.08% |
$155.74
|
706,868
115.13% of 50 DAV
50 DAV is 614,000
|
$156.86
-0.96%
|
12/19/2017
|
$153.92
|
PP = $156.96
|
|
MB = $164.81
|
Most Recent Note - 12/27/2017 6:07:51 PM
Y - Holding its ground stubbornly near its all-time high while volume totals have been cooling. Subsequent gains above the pivot point backed by at least +40% above average volume may trigger a new (or add-on) technical buys signal. Its 50 DMA line ($140.45) and prior highs in the $138 area define near-term support to watch. Fundamentals remain strong. See the latest FSU analysis for more details and a new annotated graph.
>>> FEATURED STOCK ARTICLE : Holding Ground in Tight Range Near High - 12/27/2017 |
View all notes |
Set NEW NOTE alert |
Company Profile |
SEC
News |
Chart |
Request a new note
C
A
S
I |
PFBC
-
NASDAQ
Preferred Bank Los Angls
BANKING - Regional - Pacific Banks
|
$58.33
|
-0.45
-0.77% |
$59.27
|
57,813
75.47% of 50 DAV
50 DAV is 76,600
|
$66.58
-12.39%
|
10/10/2017
|
$59.38
|
PP = $59.08
|
|
MB = $62.03
|
Most Recent Note - 12/28/2017 5:16:31 PM
G - Color code is changed to green after sputtering below its 50 DMA line. Relative Strength rank has slumped. Fundamentals remain strong. See the latest FSU analysis for more details and an annotated graph.
>>> FEATURED STOCK ARTICLE : Concerns Raised by Relative Strength and 50 DMA Line Breach - 12/28/2017 |
View all notes |
Set NEW NOTE alert |
Company Profile |
SEC
News |
Chart |
Request a new note
C
A
S
I |
ROG
-
NYSE
Rogers Corp
CONSUMER NON-DURABLES - Rubber and Plastics
|
$171.89
|
+9.97
6.16% |
$174.50
|
340,877
198.18% of 50 DAV
50 DAV is 172,000
|
$168.07
2.27%
|
12/29/2017
|
$162.92
|
PP = $168.17
|
|
MB = $176.58
|
 Most Recent Note - 1/2/2018 7:36:48 PM
Y - Hit a new high today with a big gain backed by +98% above average volume triggering a technical buy signal. It was highlighted in yellow with pivot point cited based on its 11/22/17 high plus 10 cents in the 12/29/17 mid-day report. Found support above its 50 DMA line ($155). See the latest FSU analysis for more details and an annotated graph.
>>> FEATURED STOCK ARTICLE : Hovering Near Prior High After 3rd Strong Quarterly Earnings - 12/29/2017 |
View all notes |
Set NEW NOTE alert |
Company Profile |
SEC
News |
Chart |
Request a new note
C
A
S
I |
AVGO
-
NASDAQ
Avago Technologies Ltd
ELECTRONICS - Semiconductor - Broad Line
|
$267.01
|
+10.11
3.94% |
$267.50
|
3,312,872
97.82% of 50 DAV
50 DAV is 3,386,800
|
$285.68
-6.54%
|
10/30/2017
|
$261.19
|
PP = $259.46
|
|
MB = $272.43
|
Most Recent Note - 1/2/2018 7:15:25 PM
G - Rebounded above its 50 DMA line ($264.32) with today's gain on near average volume. The recent low ($254.20 on 12/06/17) defines important support where more damaging losses would raise greater concerns. Fundamentals remain strong.
>>> FEATURED STOCK ARTICLE : Testing Support at Prior Highs and 50-Day Average - 12/8/2017 |
View all notes |
Set NEW NOTE alert |
Company Profile |
SEC
News |
Chart |
Request a new note
C
A
S
I |
TPL
-
NYSE
Texas Pacific Land Trust
FINANCIAL SERVICES - Diversified Investments
|
$460.59
|
+13.96
3.13% |
$476.01
|
38,531
321.09% of 50 DAV
50 DAV is 12,000
|
$458.00
0.57%
|
12/21/2017
|
$419.50
|
PP = $435.09
|
|
MB = $456.84
|
Most Recent Note - 1/2/2018 1:36:05 PM
G - Hit yet another new all-time high with today's volume-driven gain. Color code is changed to green after rising above its "max buy" level. Gain on 12/27/17 was marked by +63% above average volume, enough to clinch a proper technical buy signal under the fact-based investment system's gudelines.
>>> FEATURED STOCK ARTICLE : Real Estate Trust Perched Within Striking Distance of Prior High - 12/21/2017 |
View all notes |
Set NEW NOTE alert |
Company Profile |
SEC
News |
Chart |
Request a new note
C
A
S
I |
Symbol/Exchange
Company Name
Industry Group |
PRICE |
CHANGE
(%Change) |
Day High |
Volume
(% DAV)
(% 50 day avg vol) |
52 Wk Hi
% From Hi |
Featured
Date |
Price
Featured |
Pivot Featured |
|
Max Buy |
YY
-
NASDAQ
YY Inc Ads
INTERNET - Internet Service Providers
|
$121.46
|
+8.40
7.43% |
$122.00
|
1,948,174
135.48% of 50 DAV
50 DAV is 1,438,000
|
$123.48
-1.64%
|
12/29/2017
|
$113.06
|
PP = $123.58
|
|
MB = $129.76
|
Most Recent Note - 1/2/2018 1:59:46 PM
Y - Today's volume-driven gain has it approaching the new pivot point cited based on its 11/21/17 high plus 10 cents. Subsequent volume-driven gains above the pivot point may trigger a new (or add-on) technical buy signal. Its 50 DMA line ($103.26) and recent low ($98.50 on 12/06/17) define important near-term support where violations may trigger technical sell signals. This China-based Internet - Content firm's fundamentals remain strong.
>>> FEATURED STOCK ARTICLE : Fundamentals Remain Strong; Extended From Any Sound Base - 12/11/2017 |
View all notes |
Set NEW NOTE alert |
Company Profile |
SEC
News |
Chart |
Request a new note
C
A
S
I |
HTHT
-
NASDAQ
China Lodging Group Ads
LEISURE - Lodging
|
$158.86
|
+14.43
9.99% |
$159.35
|
1,003,895
157.10% of 50 DAV
50 DAV is 639,000
|
$146.25
8.62%
|
12/22/2017
|
$138.07
|
PP = $142.90
|
|
MB = $150.05
|
Most Recent Note - 1/2/2018 7:33:32 PM
G - Color code is changed to green after a considerable volume-driven gain triggered a new (or add-on) technical buy signal yet quickly lifted it well above its "max buy" level.
>>> FEATURED STOCK ARTICLE : Sales Revenues Growth Rate Shows Acceleration - 12/22/2017 |
View all notes |
Set NEW NOTE alert |
Company Profile |
SEC
News |
Chart |
Request a new note
C
A
S
I |
PATK
-
NASDAQ
Patrick Industries Inc
Bldg-Mobile/Mfg and RV
|
$70.00
|
+0.55
0.79% |
$71.00
|
230,843
161.43% of 50 DAV
50 DAV is 143,000
|
$70.40
-0.57%
|
10/26/2017
|
$90.90
|
PP = $87.90
|
|
MB = $92.30
|
Most Recent Note - 1/2/2018 1:17:02 PM
G - Extended from any sound base and it touched another new all-time high today. Prior high in the $64 area and its 50 DMA line ($63.27) define important near-term support to watch where violations would raise concerns. Fundamentals remain strong. Shares split 3/2 effective 12/11/17, so do not be confused by the impact on the share prices.
>>> FEATURED STOCK ARTICLE : Hovering Near High Following 3:2 Share Split - 12/15/2017 |
View all notes |
Set NEW NOTE alert |
Company Profile |
SEC
News |
Chart |
Request a new note
C
A
S
I |
ESNT
-
NYSE
Essent Group Ltd
Finance-MrtgandRel Svc
|
$43.83
|
+0.41
0.94% |
$43.88
|
705,750
79.63% of 50 DAV
50 DAV is 886,300
|
$47.29
-7.32%
|
10/9/2017
|
$39.75
|
PP = $41.54
|
|
MB = $43.62
|
Most Recent Note - 12/26/2017 11:21:17 AM
G - Quietly consolidating above its 50 DMA line ($44.19) and recent low ($43.07 on 12/01/17) defining near-term support. Fundamentals remain strong.
>>> FEATURED STOCK ARTICLE : Pulling Back After Recently Wedging Higher - 12/14/2017 |
View all notes |
Set NEW NOTE alert |
Company Profile |
SEC
News |
Chart |
Request a new note
C
A
S
I |
FIVE
-
NASDAQ
Five Below Inc
Retail-DiscountandVariety
|
$69.16
|
+2.84
4.28% |
$69.75
|
1,226,369
122.03% of 50 DAV
50 DAV is 1,005,000
|
$68.98
0.26%
|
1/2/2018
|
$69.16
|
PP = $68.99
|
|
MB = $72.44
|
Most Recent Note - 1/2/2018 7:25:04 PM
Y - Hit a new all-time high with today's big gain backed by +22% above average volume. Gains backed by +40% above average volume may clinch a convincing technical buy signal from an advanced base pattern. Color code is changed to yellow after a tight 4-week consolidation. Its 50 DMA line ($61.41) defines near-term support above prior highs in the $57-58 area. Fundamentals remain strong.
>>> FEATURED STOCK ARTICLE : Retail - Discount & Variety Firm Has Strong Fundamentals - 12/19/2017 |
View all notes |
Set NEW NOTE alert |
Company Profile |
SEC
News |
Chart |
Request a new note
C
A
S
I |
Symbol/Exchange
Company Name
Industry Group |
PRICE |
CHANGE
(%Change) |
Day High |
Volume
(% DAV)
(% 50 day avg vol) |
52 Wk Hi
% From Hi |
Featured
Date |
Price
Featured |
Pivot Featured |
|
Max Buy |
OLED
-
NASDAQ
Universal Display Corp
Elec-Misc Products
|
$173.75
|
+1.10
0.64% |
$176.35
|
560,182
61.16% of 50 DAV
50 DAV is 916,000
|
$192.75
-9.86%
|
8/31/2017
|
$128.22
|
PP = $127.78
|
|
MB = $134.17
|
Most Recent Note - 12/27/2017 6:10:51 PM
G - Found support above its 50 DMA line ($165.29) and above the prior low ($158.00 on 12/05/17). Subsequent losses leading to violations may trigger technical sell signals. Has not formed a sound base pattern. Fundamentals remain strong.
>>> FEATURED STOCK ARTICLE : Consolidating After +50% Rally Since First Featured 8/31/17 - 12/13/2017 |
View all notes |
Set NEW NOTE alert |
Company Profile |
SEC
News |
Chart |
Request a new note
C
A
S
I |
ANET
-
NYSE
Arista Networks Inc
TELECOMMUNICATIONS - Communication Equipment
|
$231.03
|
-4.55
-1.93% |
$238.63
|
872,253
100.96% of 50 DAV
50 DAV is 864,000
|
$245.65
-5.95%
|
10/27/2017
|
$195.65
|
PP = $196.37
|
|
MB = $206.19
|
Most Recent Note - 1/2/2018 7:11:28 PM
G - Pulled back on higher volume after wedging up near its all-time high. Its 50 DMA line ($220) defines near-term support above the prior low ($206.86 on 12/05/17). Subsequent violations would trigger technical sell signals. See the latest FSU analysis for more details and a new annotated graph.
>>> FEATURED STOCK ARTICLE : Encountering Distributional Pressure After Wedging Near Prior High - 1/2/2018 |
View all notes |
Set NEW NOTE alert |
Company Profile |
SEC
News |
Chart |
Request a new note
C
A
S
I |
GRUB
-
NYSE
Grubhub Inc
COMPUTER SOFTWARE and SERVICES - Technical and System Software
|
$71.26
|
-0.54
-0.75% |
$72.01
|
1,594,195
113.95% of 50 DAV
50 DAV is 1,399,000
|
$74.81
-4.74%
|
6/21/2017
|
$47.33
|
PP = $46.94
|
|
MB = $49.29
|
Most Recent Note - 12/26/2017 11:38:26 AM
G - Perched near its all-time high, very extended from any sound base, its 50 DMA line ($64.22) defines initial support above prior highs near $57. Bullish action has continued although the 2 latest quarters were below the +25% minimum earnings guideline (C criteria), raising fundamental concerns with regard to the fact-based investment system.
>>> FEATURED STOCK ARTICLE : Extended From Any Base, Grubhub Hits Another New Record High - 12/18/2017 |
View all notes |
Set NEW NOTE alert |
Company Profile |
SEC
News |
Chart |
Request a new note
C
A
S
I |
IBP
-
NYSE
Installed Building Prod
DIVERSIFIED SERVICES - Business/Management Services
|
$75.75
|
-0.20
-0.26% |
$77.35
|
151,565
79.77% of 50 DAV
50 DAV is 190,000
|
$79.40
-4.60%
|
12/26/2017
|
$75.00
|
PP = $79.50
|
|
MB = $83.48
|
Most Recent Note - 12/26/2017 6:41:51 PM
Y - Color code is changed to yellow with new pivot point cited based on its 12/04/17 high plus 10 cents after forming an advanced ascending base. Recently found support at its 50 DMA line ($69.63). Subsequent losses leading to a violation of the 50 DMA line or recent low ($68.30 on 12/13/17) may trigger technical sell signals. Fundamentals remain strong. See the latest FSU analysis for more details and a new annotated graph.
>>> FEATURED STOCK ARTICLE : Building on an Advanced Ascending Base Pattern - 12/26/2017 |
View all notes |
Set NEW NOTE alert |
Company Profile |
SEC
News |
Chart |
Request a new note
C
A
S
I |
OLLI
-
NASDAQ
Ollie's Bargain Outlet
Retail-DiscountandVariety
|
$51.95
|
-1.30
-2.44% |
$53.25
|
919,576
178.21% of 50 DAV
50 DAV is 516,000
|
$54.30
-4.33%
|
11/21/2017
|
$46.78
|
PP = $47.00
|
|
MB = $49.35
|
Most Recent Note - 1/2/2018 7:28:55 PM
G - Pulled back today with above average volume indicative of distributional pressure. It is extended from its prior base. Its 50 DMA line defines important near-term support coinciding with prior highs in the $46 area. Fundamentals remain strong.
>>> FEATURED STOCK ARTICLE : Extended From Latest Base and Perched Near Record High - 12/20/2017 |
View all notes |
Set NEW NOTE alert |
Company Profile |
SEC
News |
Chart |
Request a new note
C
A
S
I |
Symbol/Exchange
Company Name
Industry Group |
PRICE |
CHANGE
(%Change) |
Day High |
Volume
(% DAV)
(% 50 day avg vol) |
52 Wk Hi
% From Hi |
Featured
Date |
Price
Featured |
Pivot Featured |
|
Max Buy |
HLI
-
NYSE
Houlihan Lokey Inc Cl A
Finance-Invest Bnk/Bkrs
|
$45.79
|
+0.36
0.79% |
$45.80
|
190,477
75.29% of 50 DAV
50 DAV is 253,000
|
$46.99
-2.55%
|
9/18/2017
|
$37.04
|
PP = $39.78
|
|
MB = $41.77
|
Most Recent Note - 12/26/2017 11:22:41 AM
G - Perched near its all-time high, extended from any sound base. Its 50 DMA line ($43.23) defines near-term support to watch. Made gradual progress since 10/26/17 when it priced a Secondary Offering. Fundamentals remain strong.
>>> FEATURED STOCK ARTICLE : Wedging Higher With Recent Gains Lacking Great Volume - 12/12/2017 |
View all notes |
Set NEW NOTE alert |
Company Profile |
SEC
News |
Chart |
Request a new note
C
A
S
I |
|
|
|
THESE ARE NOT BUY RECOMMENDATIONS!
Comments contained in the body of this report are technical
opinions only. The material herein has been obtained
from sources believed to be reliable and accurate, however,
its accuracy and completeness cannot be guaranteed.
This site is not an investment advisor, hence it does
not endorse or recommend any securities or other investments.
Any recommendation contained in this report may not
be suitable for all investors and it is not to be deemed
an offer or solicitation on our part with respect to
the purchase or sale of any securities. All trademarks,
service marks and trade names appearing in this report
are the property of their respective owners, and are
likewise used for identification purposes only.
This report is a service available
only to active Paid Premium Members.
You may opt-out of receiving report notifications
at any time. Questions or comments may be submitted
by writing to Premium Membership Services 665 S.E. 10 Street, Suite 201 Deerfield Beach, FL 33441-5634 or by calling 1-800-965-8307
or 954-785-1121.
|
|
|