You are not logged in.
This means you
CAN ONLY VIEW reports that were published prior to Wednesday, March 26, 2025.
You
MUST UPGRADE YOUR MEMBERSHIP if you want to see any current reports.
AFTER MARKET UPDATE - WEDNESDAY, DECEMBER 27TH, 2017
Previous After Market Report Next After Market Report >>>
|
|
|
|
DOW |
+28.09 |
24,774.30 |
+0.11% |
|
Volume |
548,051,290 |
+4% |
|
Volume |
1,382,179,530 |
+8% |
|
NASDAQ |
+3.09 |
6,939.34 |
+0.04% |
|
Advancers |
1,607 |
56% |
|
Advancers |
1,448 |
51% |
|
S&P 500 |
+2.12 |
2,682.62 |
+0.08% |
|
Decliners |
1,269 |
44% |
|
Decliners |
1,377 |
49% |
|
Russell 2000 |
-0.29 |
1,543.94 |
-0.02% |
|
52 Wk Highs |
132 |
|
|
52 Wk Highs |
105 |
|
|
S&P 600 |
-0.56 |
939.71 |
-0.06% |
|
52 Wk Lows |
24 |
|
|
52 Wk Lows |
23 |
|
|
 |
Major Indices Quietly Inched Higher
Kenneth J. Gruneisen - Passed the CAN SLIM® Master's Exam
Stocks inched higher amid light trading on Wednesday. The Dow added 28 points to 24774. The S&P 500 advanced 2 points to 2682 and the NASDAQ Composite was up 3 points to 6939. Volume totals reported were low but slightly higher than the prior session totals on the NYSE and on the Nasdaq exchange. Advancers led decliners by a 4-3 margin on the NYSE but only a narrow margin on the Nasdaq exchange. There were 51 high-ranked companies from the Leaders List that made new 52-week highs and were listed on the BreakOuts Page, matching the total of 51 on the prior session. New 52-week highs totals outnumbered new 52-week lows on the NYSE and on the Nasdaq exchange. The Featured Stocks Page provides the latest analysis on noteworthy high-ranked leaders. Charts used courtesy of www.stockcharts.com
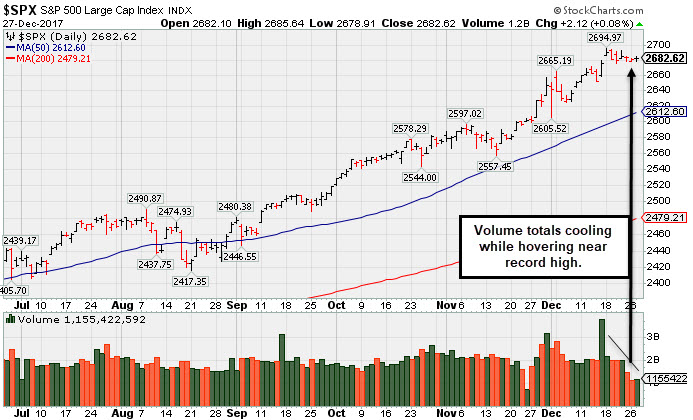 PICTURED: The S&P 500 Index is hovering near its record high with volume totals cooling. The index is up +25.2% year-to-date.
The major averages (M criteria) are in a confirmed uptrend. Investors should only consider stocks meeting all key criteria of the fact-based investment system as they trigger technical buy signals.
The U.S. dollar and Treasury yields declined on Wednesday following a round of economic updates. The Conference Board reported that consumer confidence fell to 122.1 in December from a revised 17-year high reading of 128.6 in the prior month. A separate release showed that pending home sales rose 0.2% in November, above analyst estimates of a 0.4% decrease. Following the updates, the yield on the 10-year Treasury note dipped seven basis points, the most since September, to finish at 2.41%.
Seven of 11 sectors in the S&P 500 finished higher on the session while index volume was nearly 40% below its 30-day moving average. Utilities outperformed with SCANA Corp (SCG +1.00%) up while Telecom lagged as CenturyLink (CTL -1.67%) fell. Facebook (FB +0.93%) edged higher to pace a mild rebound in Tech shares. Following negative analyst commentary, Celgene (CELG -2.35%) and Tesla (TSLA -1.78%) both fell.
In commodities, NYMEX WTI crude was off 0.6% to $59.59/barrel after climbing above $60/barrel overnight for the first time since June 2015. Gold added 0.2% as the U.S. dollar slid 0.2% against its peers. |
 Kenneth J. Gruneisen started out as a licensed stockbroker in August 1987, a couple of months prior to the historic stock market crash that took the Dow Jones Industrial Average down -22.6% in a single day. He has published daily fact-based fundamental and technical analysis on high-ranked stocks online for two decades. Through FACTBASEDINVESTING.COM, Kenneth provides educational articles, news, market commentary, and other information regarding proven investment systems that work in good times and bad.
Comments contained in the body of this report are technical opinions only and are not necessarily those of Gruneisen Growth Corp. The material herein has been obtained from sources believed to be reliable and accurate, however, its accuracy and completeness cannot be guaranteed. Our firm, employees, and customers may effect transactions, including transactions contrary to any recommendation herein, or have positions in the securities mentioned herein or options with respect thereto. Any recommendation contained in this report may not be suitable for all investors and it is not to be deemed an offer or solicitation on our part with respect to the purchase or sale of any securities. |
|
 |
Tech Sector Provided Leadership on Quiet Session
Kenneth J. Gruneisen - Passed the CAN SLIM® Master's Exam
The Biotechnology Index ($BTK +0.32%), Networking Index ($NWX +0.76%) and the Semiconductor Index ($SOX +0.36%) each posted a modest gain as the tech sector provided some leadership. The rest of the market was indecisive as the Retail Index ($RLX -0.05%), Bank Index ($BKX -0.16%) and Broker/Dealer Index ($XBD -0.14%) each ended slightly in the red. Commodity-linked groups also edged lower on Wednesday as the Gold & Silver Index ($XAU -0.39%), Integrated Oil Index ($XOI -0.28%) and the Oil Services Index ($OSX -0.10%) each ended the session slightly lower. Charts courtesy wwwstockcharts.com
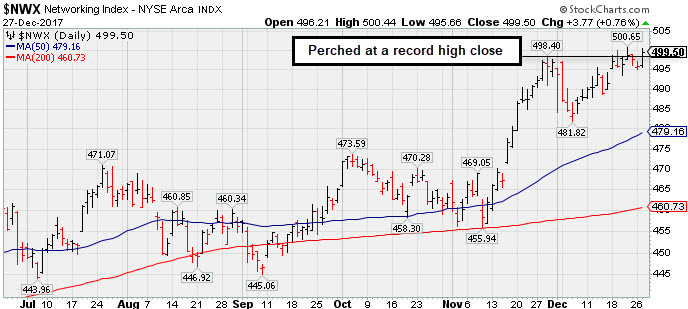 PICTURED: The Networking Index ($NWX +0.76%) is perched at a record high close.
| Oil Services |
$OSX |
148.89 |
-0.15 |
-0.10% |
-18.99% |
| Integrated Oil |
$XOI |
1,338.66 |
-3.82 |
-0.28% |
+5.57% |
| Semiconductor |
$SOX |
1,263.36 |
+4.48 |
+0.36% |
+39.37% |
| Networking |
$NWX |
499.50 |
+3.77 |
+0.76% |
+11.97% |
| Broker/Dealer |
$XBD |
266.17 |
-0.20 |
-0.07% |
+29.66% |
| Retail |
$RLX |
1,741.16 |
-1.63 |
-0.09% |
+29.65% |
| Gold & Silver |
$XAU |
85.32 |
-0.33 |
-0.39% |
+8.19% |
| Bank |
$BKX |
107.15 |
-0.12 |
-0.11% |
+16.73% |
| Biotech |
$BTK |
4,257.66 |
+13.48 |
+0.32% |
+38.46% |
|
|
|
 |
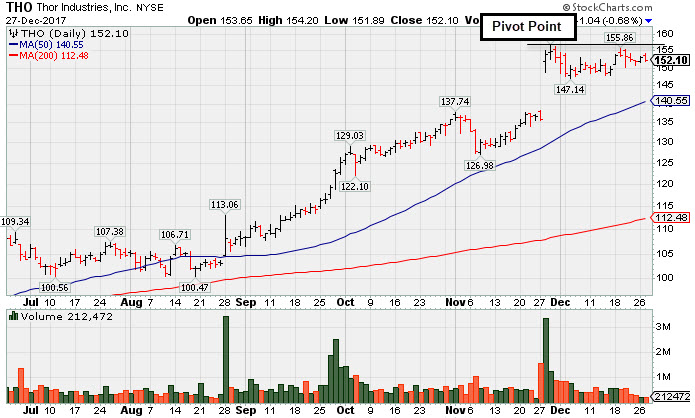
Holding Ground in Tight Range Near High
Kenneth J. Gruneisen - Passed the CAN SLIM® Master's Exam
Thor Industries Inc (THO -$1.04 or -0.68% to $152.10) has been holding its ground stubbornly near its all-time high while volume totals have been cooling. Regular readers saw it noted on 12/19/17 after an advanced "3-week tight" base was identified. A new pivot point was cited while its color code was changed to yellow. Subsequent gains above the pivot point backed by at least +40% above average volume may trigger a new (or add-on) technical buys signal.
Its 50-day moving average (DMA) line ($140.90) and prior highs in the $138 area define near-term support to watch. Fundamentals remain strong. Recently it reported earnings +63% on +31% sales revenues for the Oct '17 quarter, continuing its strong earnings track record. The past 5 quarters were above the +25% minimum earnings guideline (C criteria) of the fact-based investment system. Its annual earnings history (A criteria) has been good. Return on Equity is reported at 26%, well above the 17% minimum guideline.
The Elkhart, IN based Building - Mobile/Mfg & RV firm was last shown in this FSU section on 12/07/17 with an annotated graph under the headline, "Very Extended From Prior Base and Hovering Near Record High". It was highlighted in yellow with pivot point cited based on its 4/27/17 high in the 6/07/17 mid-day report (read here). It had gapped up on 6/06/17, clearing a "double bottom" base while rebounding toward prior highs.
THO has earned a current Timeliness rating of A and a Sponsorship rating of B. The number of top-rated funds owning its shares rose from 489 in Mar '16 to 612 in Sep '17. Its current Up/Down Volume Ratio of 1.0 is an unbiased indication its shares have been neutral concerning accumulation/distribution over the past 50 days (I criteria). Its small supply of only 49.5 million shares (S criteria) in the public float can contribute to greater volatility in the event of institutional buying or selling. |
|
|
Color Codes Explained :
Y - Better candidates highlighted by our
staff of experts.
G - Previously featured
in past reports as yellow but may no longer be buyable under the
guidelines.
***Last / Change / Volume data in this table is the closing quote data***
Symbol/Exchange
Company Name
Industry Group |
PRICE |
CHANGE
(%Change) |
Day High |
Volume
(% DAV)
(% 50 day avg vol) |
52 Wk Hi
% From Hi |
Featured
Date |
Price
Featured |
Pivot Featured |
|
Max Buy |
THO
-
NYSE
Thor Industries Inc
AUTOMOTIVE - Recreational Vehicles
|
$152.10
|
-1.04
-0.68% |
$154.20
|
212,307
33.59% of 50 DAV
50 DAV is 632,000
|
$156.86
-3.03%
|
12/19/2017
|
$153.92
|
PP = $156.96
|
|
MB = $164.81
|
 Most Recent Note - 12/27/2017 6:07:51 PM
Y - Holding its ground stubbornly near its all-time high while volume totals have been cooling. Subsequent gains above the pivot point backed by at least +40% above average volume may trigger a new (or add-on) technical buys signal. Its 50 DMA line ($140.45) and prior highs in the $138 area define near-term support to watch. Fundamentals remain strong. See the latest FSU analysis for more details and a new annotated graph.
>>> FEATURED STOCK ARTICLE : Holding Ground in Tight Range Near High - 12/27/2017 |
View all notes |
Set NEW NOTE alert |
Company Profile |
SEC
News |
Chart |
Request a new note
C
A
S
I |
PFBC
-
NASDAQ
Preferred Bank Los Angls
BANKING - Regional - Pacific Banks
|
$60.10
|
-0.12
-0.20% |
$60.81
|
50,779
66.38% of 50 DAV
50 DAV is 76,500
|
$66.58
-9.73%
|
10/10/2017
|
$59.38
|
PP = $59.08
|
|
MB = $62.03
|
Most Recent Note - 12/26/2017 11:31:19 AM
Y - Still quietly consolidating below its "max buy" level. Met resistance in the $66 area and found support recently near its 50 DMA line ($61.063). Fundamentals remain strong.
>>> FEATURED STOCK ARTICLE : Challenged High After Finding Support at 50 Day Moving Average - 12/5/2017 |
View all notes |
Set NEW NOTE alert |
Company Profile |
SEC
News |
Chart |
Request a new note
C
A
S
I |
AVGO
-
NASDAQ
Avago Technologies Ltd
ELECTRONICS - Semiconductor - Broad Line
|
$259.12
|
+1.02
0.40% |
$261.61
|
3,548,785
105.24% of 50 DAV
50 DAV is 3,372,000
|
$285.68
-9.30%
|
10/30/2017
|
$261.19
|
PP = $259.46
|
|
MB = $272.43
|
Most Recent Note - 12/26/2017 11:19:59 AM
G - Gapped down today slumping below its 50 DMA line ($262.96) toward the recent low ($254.20 on 12/06/17). More damaging losses would raise greater concerns. Fundamentals remain strong.
>>> FEATURED STOCK ARTICLE : Testing Support at Prior Highs and 50-Day Average - 12/8/2017 |
View all notes |
Set NEW NOTE alert |
Company Profile |
SEC
News |
Chart |
Request a new note
C
A
S
I |
TPL
-
NYSE
Texas Pacific Land Trust
FINANCIAL SERVICES - Diversified Investments
|
$450.06
|
+6.88
1.55% |
$458.00
|
21,136
176.13% of 50 DAV
50 DAV is 12,000
|
$445.00
1.14%
|
12/21/2017
|
$419.50
|
PP = $435.09
|
|
MB = $456.84
|
Most Recent Note - 12/27/2017 1:28:12 PM
Y - Hitting another new all-time high with today's 7th consecutive gain. Rose above its pivot point on the prior session with +35% above average volume. Previously noted - "Highlighted in yellow with pivot point cited based on its 10/13/17 high plus 10 cents in the 12/21/17 mid-day report. Subsequent gains above the pivot point backed by at least +40% above average volume are needed to trigger a proper technical buy signal. "
>>> FEATURED STOCK ARTICLE : Real Estate Trust Perched Within Striking Distance of Prior High - 12/21/2017 |
View all notes |
Set NEW NOTE alert |
Company Profile |
SEC
News |
Chart |
Request a new note
C
A
S
I |
YY
-
NASDAQ
YY Inc Ads
INTERNET - Internet Service Providers
|
$114.95
|
+1.10
0.97% |
$115.96
|
369,124
24.97% of 50 DAV
50 DAV is 1,478,000
|
$123.48
-6.91%
|
9/25/2017
|
$80.26
|
PP = $83.10
|
|
MB = $87.26
|
Most Recent Note - 12/22/2017 6:42:59 PM
G - Found support above its prior high ($97.59 on 10/16/17) and above its 50 DMA line ($101.20) while building on a new base. Fundamentals remain strong.
>>> FEATURED STOCK ARTICLE : Fundamentals Remain Strong; Extended From Any Sound Base - 12/11/2017 |
View all notes |
Set NEW NOTE alert |
Company Profile |
SEC
News |
Chart |
Request a new note
C
A
S
I |
Symbol/Exchange
Company Name
Industry Group |
PRICE |
CHANGE
(%Change) |
Day High |
Volume
(% DAV)
(% 50 day avg vol) |
52 Wk Hi
% From Hi |
Featured
Date |
Price
Featured |
Pivot Featured |
|
Max Buy |
HTHT
-
NASDAQ
China Lodging Group Ads
LEISURE - Lodging
|
$140.59
|
-0.11
-0.08% |
$141.52
|
611,653
98.02% of 50 DAV
50 DAV is 624,000
|
$142.80
-1.55%
|
12/22/2017
|
$138.07
|
PP = $142.90
|
|
MB = $150.05
|
Most Recent Note - 12/22/2017 6:30:21 PM
Y - Color code is changed to yellow with new pivot point cited based on its 10/25/17 high plus 10 cents. Subsequent volume-driven gains for new highs may trigger a new (or add-on) technical buy signal. Posted 7 consecutive gains while approaching prior highs. Rebounded above its 50 DMA line helping its outlook to improve. Fundamentals remain strong. See the latest FSU analysis for more details and a new annotated graph.
>>> FEATURED STOCK ARTICLE : Sales Revenues Growth Rate Shows Acceleration - 12/22/2017 |
View all notes |
Set NEW NOTE alert |
Company Profile |
SEC
News |
Chart |
Request a new note
C
A
S
I |
PATK
-
NASDAQ
Patrick Industries Inc
Bldg-Mobile/Mfg and RV
|
$68.60
|
+0.10
0.15% |
$69.20
|
55,573
39.14% of 50 DAV
50 DAV is 142,000
|
$69.72
-1.61%
|
10/26/2017
|
$90.90
|
PP = $87.90
|
|
MB = $92.30
|
Most Recent Note - 12/26/2017 11:29:16 AM
G - Perched at its all-time high while on track today for a 4th consecutive gain. Prior high in the $64 area and its 50 DMA line ($62.24) define important near-term support to watch where violations would raise concerns. Fundamentals remain strong. Shares split 3/2 effective 12/11/17, so do not be confused by the impact on the share prices.
>>> FEATURED STOCK ARTICLE : Hovering Near High Following 3:2 Share Split - 12/15/2017 |
View all notes |
Set NEW NOTE alert |
Company Profile |
SEC
News |
Chart |
Request a new note
C
A
S
I |
ESNT
-
NYSE
Essent Group Ltd
Finance-MrtgandRel Svc
|
$44.42
|
-0.71
-1.57% |
$45.26
|
337,335
36.43% of 50 DAV
50 DAV is 926,000
|
$47.29
-6.07%
|
10/9/2017
|
$39.75
|
PP = $41.54
|
|
MB = $43.62
|
Most Recent Note - 12/26/2017 11:21:17 AM
G - Quietly consolidating above its 50 DMA line ($44.19) and recent low ($43.07 on 12/01/17) defining near-term support. Fundamentals remain strong.
>>> FEATURED STOCK ARTICLE : Pulling Back After Recently Wedging Higher - 12/14/2017 |
View all notes |
Set NEW NOTE alert |
Company Profile |
SEC
News |
Chart |
Request a new note
C
A
S
I |
FIVE
-
NASDAQ
Five Below Inc
Retail-DiscountandVariety
|
$67.84
|
+0.37
0.55% |
$68.45
|
698,609
69.38% of 50 DAV
50 DAV is 1,007,000
|
$68.98
-1.65%
|
10/6/2017
|
$57.13
|
PP = $54.23
|
|
MB = $56.94
|
Most Recent Note - 12/26/2017 11:18:07 AM
G - Rising near its all-time high with today's early gain. Very extended from its prior base, its 50 DMA line ($60.49) defines near-term support above prior highs in the $57-58 area. Fundamentals remain strong.
>>> FEATURED STOCK ARTICLE : Retail - Discount & Variety Firm Has Strong Fundamentals - 12/19/2017 |
View all notes |
Set NEW NOTE alert |
Company Profile |
SEC
News |
Chart |
Request a new note
C
A
S
I |
OLED
-
NASDAQ
Universal Display Corp
Elec-Misc Products
|
$176.35
|
+5.75
3.37% |
$176.95
|
753,741
82.11% of 50 DAV
50 DAV is 918,000
|
$192.75
-8.51%
|
8/31/2017
|
$128.22
|
PP = $127.78
|
|
MB = $134.17
|
Most Recent Note - 12/27/2017 6:10:51 PM
G - Found support above its 50 DMA line ($165.29) and above the prior low ($158.00 on 12/05/17). Subsequent losses leading to violations may trigger technical sell signals. Has not formed a sound base pattern. Fundamentals remain strong.
>>> FEATURED STOCK ARTICLE : Consolidating After +50% Rally Since First Featured 8/31/17 - 12/13/2017 |
View all notes |
Set NEW NOTE alert |
Company Profile |
SEC
News |
Chart |
Request a new note
C
A
S
I |
Symbol/Exchange
Company Name
Industry Group |
PRICE |
CHANGE
(%Change) |
Day High |
Volume
(% DAV)
(% 50 day avg vol) |
52 Wk Hi
% From Hi |
Featured
Date |
Price
Featured |
Pivot Featured |
|
Max Buy |
ANET
-
NYSE
Arista Networks Inc
TELECOMMUNICATIONS - Communication Equipment
|
$239.50
|
+3.84
1.63% |
$240.49
|
390,526
45.25% of 50 DAV
50 DAV is 863,000
|
$245.65
-2.50%
|
10/27/2017
|
$195.65
|
PP = $196.37
|
|
MB = $206.19
|
Most Recent Note - 12/26/2017 11:36:37 AM
G - Perched within close striking distance of its all-time high. . Its 50 DMA line ($217) defines near-term support above the prior low ($206.86 on 12/05/17). Subsequent violations would trigger technical sell signals.
>>> FEATURED STOCK ARTICLE : Halted Volume-Driven Pullback at 50-Day Moving Average Line - 12/6/2017 |
View all notes |
Set NEW NOTE alert |
Company Profile |
SEC
News |
Chart |
Request a new note
C
A
S
I |
GRUB
-
NYSE
Grubhub Inc
COMPUTER SOFTWARE and SERVICES - Technical and System Software
|
$73.14
|
+0.92
1.27% |
$73.62
|
498,993
35.21% of 50 DAV
50 DAV is 1,417,000
|
$74.81
-2.23%
|
6/21/2017
|
$47.33
|
PP = $46.94
|
|
MB = $49.29
|
Most Recent Note - 12/26/2017 11:38:26 AM
G - Perched near its all-time high, very extended from any sound base, its 50 DMA line ($64.22) defines initial support above prior highs near $57. Bullish action has continued although the 2 latest quarters were below the +25% minimum earnings guideline (C criteria), raising fundamental concerns with regard to the fact-based investment system.
>>> FEATURED STOCK ARTICLE : Extended From Any Base, Grubhub Hits Another New Record High - 12/18/2017 |
View all notes |
Set NEW NOTE alert |
Company Profile |
SEC
News |
Chart |
Request a new note
C
A
S
I |
IBP
-
NYSE
Installed Building Prod
DIVERSIFIED SERVICES - Business/Management Services
|
$76.25
|
+1.25
1.67% |
$76.35
|
110,756
58.29% of 50 DAV
50 DAV is 190,000
|
$79.40
-3.97%
|
12/26/2017
|
$75.00
|
PP = $79.50
|
|
MB = $83.48
|
Most Recent Note - 12/26/2017 6:41:51 PM
Y - Color code is changed to yellow with new pivot point cited based on its 12/04/17 high plus 10 cents after forming an advanced ascending base. Recently found support at its 50 DMA line ($69.63). Subsequent losses leading to a violation of the 50 DMA line or recent low ($68.30 on 12/13/17) may trigger technical sell signals. Fundamentals remain strong. See the latest FSU analysis for more details and a new annotated graph.
>>> FEATURED STOCK ARTICLE : Building on an Advanced Ascending Base Pattern - 12/26/2017 |
View all notes |
Set NEW NOTE alert |
Company Profile |
SEC
News |
Chart |
Request a new note
C
A
S
I |
OLLI
-
NASDAQ
Ollie's Bargain Outlet
Retail-DiscountandVariety
|
$53.25
|
-0.20
-0.37% |
$54.30
|
251,828
48.99% of 50 DAV
50 DAV is 514,000
|
$53.85
-1.11%
|
11/21/2017
|
$46.78
|
PP = $47.00
|
|
MB = $49.35
|
Most Recent Note - 12/26/2017 11:27:43 AM
G - Extended from its prior base, hitting yet another new all-time high today. Its 50 DMA line defines important near-term support coinciding with prior highs in the $46 area. Fundamentals remain strong.
>>> FEATURED STOCK ARTICLE : Extended From Latest Base and Perched Near Record High - 12/20/2017 |
View all notes |
Set NEW NOTE alert |
Company Profile |
SEC
News |
Chart |
Request a new note
C
A
S
I |
HLI
-
NYSE
Houlihan Lokey Inc Cl A
Finance-Invest Bnk/Bkrs
|
$45.36
|
-0.42
-0.92% |
$46.06
|
186,041
73.24% of 50 DAV
50 DAV is 254,000
|
$46.99
-3.47%
|
9/18/2017
|
$37.04
|
PP = $39.78
|
|
MB = $41.77
|
Most Recent Note - 12/26/2017 11:22:41 AM
G - Perched near its all-time high, extended from any sound base. Its 50 DMA line ($43.23) defines near-term support to watch. Made gradual progress since 10/26/17 when it priced a Secondary Offering. Fundamentals remain strong.
>>> FEATURED STOCK ARTICLE : Wedging Higher With Recent Gains Lacking Great Volume - 12/12/2017 |
View all notes |
Set NEW NOTE alert |
Company Profile |
SEC
News |
Chart |
Request a new note
C
A
S
I |
Symbol/Exchange
Company Name
Industry Group |
PRICE |
CHANGE
(%Change) |
Day High |
Volume
(% DAV)
(% 50 day avg vol) |
52 Wk Hi
% From Hi |
Featured
Date |
Price
Featured |
Pivot Featured |
|
Max Buy |
|
|
|
THESE ARE NOT BUY RECOMMENDATIONS!
Comments contained in the body of this report are technical
opinions only. The material herein has been obtained
from sources believed to be reliable and accurate, however,
its accuracy and completeness cannot be guaranteed.
This site is not an investment advisor, hence it does
not endorse or recommend any securities or other investments.
Any recommendation contained in this report may not
be suitable for all investors and it is not to be deemed
an offer or solicitation on our part with respect to
the purchase or sale of any securities. All trademarks,
service marks and trade names appearing in this report
are the property of their respective owners, and are
likewise used for identification purposes only.
This report is a service available
only to active Paid Premium Members.
You may opt-out of receiving report notifications
at any time. Questions or comments may be submitted
by writing to Premium Membership Services 665 S.E. 10 Street, Suite 201 Deerfield Beach, FL 33441-5634 or by calling 1-800-965-8307
or 954-785-1121.
|
|
|