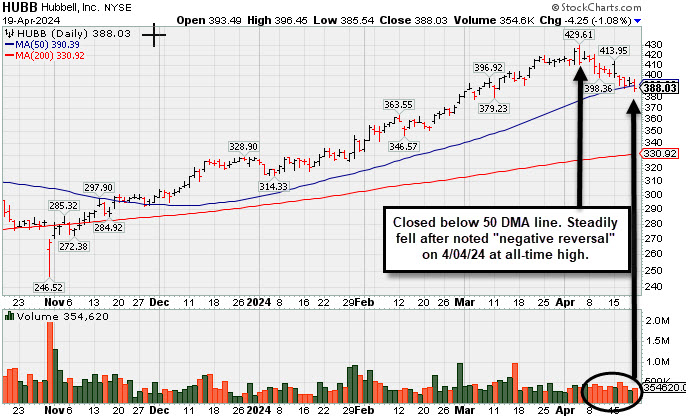
Closed Just Below 50-Day Moving Average With Quiet Loss - Friday, April 19, 2024
Hubbell (HUBB -$4.25 or -1.08% to $388.03) pulled back further today with below average volume. It closed just below its 50-day moving average (DMA) line ($390.70) raising concerns amid a deteriorating market environment (M criteria). It has steadily been slumping with 8 losses in the past 10 sessions after a noted "negative reversal" at its all-time high on 4/04/24.HUBB was highlighted yellow in the earlier mid-day report (read here) with pivot point cited based on its 1/22/24 high as it rose from a cup-with-handle base. It was last shown in great detail in this FSU section on 3/22/24 with an annotated graph under the headline "Hubbell Perched at All-Time High After 5 Weekly Gains".
Quarterly earnings increases have been above the +25% minimum (C criteria). Annual earnings history (A criteria) had a downturn in FY '20 like many companies during the pandemic. It has a 95 Earnings Per Share Rating, well above the 80+ minimum for buy candidates.
The high-ranked Electrical-Power/Equipmt firm has 53.6 million shares outstanding (S criteria) which can contribute to greater price volatility in the event of institutional buying or selling. The number of top-rated funds owning its shares rose from 805 in Jun '22 to 1,820 in Mar '24, a reassuring sign concerning the I criteria. The current Up/Down Volume Ratio of 1.5 is an unbiased indication it has been under slight accumulation over the past 50 days. It has an A Timeliness Rating and a B Sponsorship Rating.
Chart courtesy of www.stockcharts.com
| Symbol/Exchange Company Name Industry Group | PRICE | CHANGE | Day High | Volume (% DAV) (% 50 day avg vol) | 52 Wk Hi | Featured Date | Price Featured | Pivot Featured |
| Max Buy | ||||||||
Novo Nordisk ADR Medical-Ethical Drugs | $122.71 | -0.04 -0.03% | $124.54 | 5,176,334 50 DAV is 4,860,000 | $138.28 -11.26% | 3/1/2024 | $124.23 | PP = $124.97 |
| MB = $131.22 | ||||||||
| Most Recent Note - 4/17/2024 3:56:57 PM G - Color code is changed to green while sputtering below its 50 DMA line ($125.96) while volume totals have still been cooling. Losses below prior lows raised concerns and triggered a technical sell signal. A rebound above the 50 DMA line is needed for its outlook to improve. >>> FEATURED STOCK ARTICLE : Volume Cools While Consolidating Above 50-Day Moving Average Line - 4/3/2024 | View all notes | Set NEW NOTE alert | Company Profile | SEC News | Chart | Request a new note | ||||||||
Axon Enterprise Security/Sfty | $293.61 | -3.99 -1.34% | $299.53 | 551,167 50 DAV is 524,000 | $329.87 -10.99% | 4/5/2024 | $309.90 | PP = $325.73 |
| MB = $342.02 | ||||||||
| Most Recent Note - 4/17/2024 3:43:19 PM Y - Testing its 50 DMA line ($298.68) today after 3 consecutive losses. Color code was changed to yellow with new pivot point cited based on its 3/04/24 high plus 10 cents. A gain above the pivot point backed by at least +40% above average volume is needed to trigger a proper technical buy signal. Fundamentals remain strong. >>> FEATURED STOCK ARTICLE : Volume Totals Cooling While Building a New Base - 4/8/2024 | View all notes | Set NEW NOTE alert | Company Profile | SEC News | Chart | Request a new note | ||||||||
TransDigm Group Aerospace/Defense | $1,187.70 | -25.80 -2.13% | $1,226.33 | 231,349 50 DAV is 206,000 | $1,248.39 -4.86% | 4/12/2024 | $1,224.21 | PP = $1,246.32 |
| MB = $1,308.64 | ||||||||
| Most Recent Note - 4/17/2024 4:03:56 PM Y - Color code is changed to yellow after holding its ground in a tight range near its all-time high. New pivot point was cited based on its 4/04/24 high plus 10 cents. Subsequent gains above the pivot point backed by at least +40% above average volume are needed to trigger a proper new technical buy signal. Its 50 DMA line ($1,187) defines near-term support to watch. >>> FEATURED STOCK ARTICLE : Volume Totals Cooling While Perched Near High - 4/9/2024 | View all notes | Set NEW NOTE alert | Company Profile | SEC News | Chart | Request a new note | ||||||||
Paccar Trucks and Parts-Hvy Duty | $111.19 | -2.57 -2.26% | $114.34 | 4,538,444 50 DAV is 2,195,000 | $125.50 -11.40% | 1/23/2024 | $100.35 | PP = $98.57 |
| MB = $103.50 | ||||||||
G - Violated its 50 DMA line ($115) this week triggering a technical sell signal and it is on track today for a 6th consecutive loss. A prompt rebound above the 50 DMA line is needed for its outlook to improve. Fundamentals remain strong. >>> FEATURED STOCK ARTICLE : Pulling Back From High and Slumping Toward 50-Day Moving Average - 4/12/2024 | View all notes | Set NEW NOTE alert | Company Profile | SEC News | Chart | Request a new note | ||||||||
Hubbell Electrical-Power/Equipmt | $388.03 | -4.25 -1.08% | $396.45 | 354,620 50 DAV is 402,000 | $429.61 -9.68% | 1/30/2024 | $343.26 | PP = $336.83 |
| MB = $353.67 | ||||||||
G - Closed below its 50 DMA line ($390) with a loss today on near-average volume raising concerns. Slumped for 8 losses in the span of 10 sessions after a noted "negative reversal" at its all-time high on 4/04/24. See the latest FSU analysis for more details and a new annotated graph. >>> FEATURED STOCK ARTICLE : Closed Just Below 50-Day Moving Average With Quiet Loss - 4/19/2024 | View all notes | Set NEW NOTE alert | Company Profile | SEC News | Chart | Request a new note | ||||||||
| Symbol/Exchange Company Name Industry Group | PRICE | CHANGE | Day High | Volume (% DAV) (% 50 day avg vol) | 52 Wk Hi | Featured Date | Price Featured | Pivot Featured |
| Max Buy | ||||||||
U.S. Lime & Minerals Bldg-Cement/Concrt/Ag | $296.76 | +1.75 0.59% | $296.80 | 24,204 50 DAV is 23,000 | $308.00 -3.65% | 2/9/2024 | $254.68 | PP = $265.09 |
| MB = $278.34 | ||||||||
| Most Recent Note - 4/17/2024 4:04:26 PM G - Still hovering in a tight range in recent weeks near its all-time high, stubbornly holding its ground despite encountering some distributional pressure. Its 50 DMA line ($279) defines near-term support to watch. >>> FEATURED STOCK ARTICLE : Gain With Light Volume for Best Ever Close - 4/5/2024 | View all notes | Set NEW NOTE alert | Company Profile | SEC News | Chart | Request a new note | ||||||||
ServiceNow Computer Sftwr-Enterprse | $713.91 | -17.45 -2.39% | $726.03 | 1,539,981 50 DAV is 1,126,000 | $815.32 -12.44% | 2/22/2024 | $771.75 | PP = $815.32 |
| MB = $856.09 | ||||||||
Another damaging volume-driven loss since slumping below the prior low ($730) raised more serious concerns along with broader market weakness (M criteria). It will be dropped from the Featured Stocks list tonight. A rebound above the 50 DMA line ($766) is needed for its outlook to improve. >>> FEATURED STOCK ARTICLE : Quietly Consolidating Near 50-Day Moving Average Line - 4/11/2024 | View all notes | Set NEW NOTE alert | Company Profile | SEC News | Chart | Request a new note | ||||||||
Paymentus Holdings Finance-CrdtCard/PmtPr | $19.31 | -0.27 -1.38% | $19.68 | 169,893 50 DAV is 389,000 | $25.21 -23.40% | 3/5/2024 | $19.97 | PP = $18.89 |
| MB = $19.83 | ||||||||
| Most Recent Note - 4/18/2024 5:55:56 PM G - Still testing its 50 DMA line ($19.46) which defines important near-term support above prior highs in the $18 range. More damaging losses would raise greater concerns. >>> FEATURED STOCK ARTICLE : Consolidating After Powerful Breakout and Volume-Driven Gains - 3/27/2024 | View all notes | Set NEW NOTE alert | Company Profile | SEC News | Chart | Request a new note | ||||||||
HubSpot Comp Sftwr-Spec Enterprs | $631.24 | -18.34 -2.82% | $662.52 | 810,700 50 DAV is 532,000 | $693.85 -9.02% | 4/4/2024 | $686.66 | PP = $660.10 |
| MB = $693.11 | ||||||||
Y - Pulled back today testing its 50 DMA line ($625) with a loss on +52% above-average volume. Stalled after highlighted yellow in the 4/04/24 mid-day report with pivot point cited based on its 2/09/24 high plus 10 cents. Initial support is at its prior highs and its 50 DMA line ($626). Fundamentals remain strong. Faces some resistance due to old overhead supply up to the $866 level. >>> FEATURED STOCK ARTICLE : Encountered Distributional Pressure and Finished Below Pivot Point - 4/4/2024 | View all notes | Set NEW NOTE alert | Company Profile | SEC News | Chart | Request a new note | ||||||||
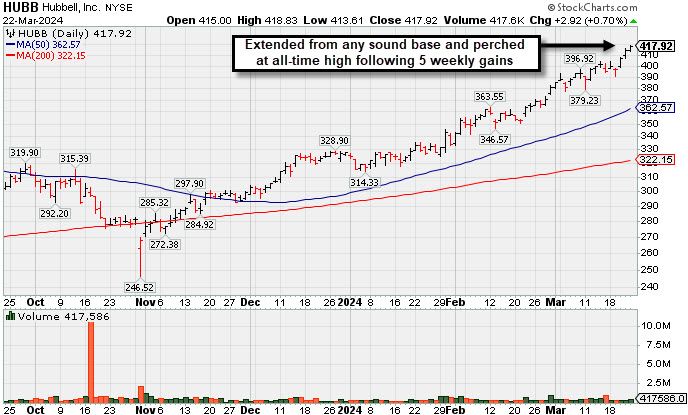
Hubbell Perched at All-Time High After 5 Weekly Gains - Friday, March 22, 2024
Hubbell (HUBB +$2.92 or +0.70% to $417.92) hit yet another new all-time high with today's 3rd consecutive gain backed by near average volume, getting very extended from the previously noted base. Its 50-day moving average (DMA) line ($363) defines important support to watch on pullbacks.HUBB was highlighted yellow in the earlier mid-day report (read here) with pivot point cited based on its 1/22/24 high as it rose from a cup-with-handle base. It was last shown in great detail in this FSU section on 2/28/24 with an annotated graph under the headline "Inched to New Highs With Average Volume".
Quarterly earnings increases have been above the +25% minimum (C criteria). Annual earnings history (A criteria) had a downturn in FY '20 like many companies during the pandemic. It has a 95 Earnings Per Share Rating, well above the 80+ minimum for buy candidates.
The high-ranked Electrical-Power/Equipmt firm has 53.6 million shares outstanding (S criteria) which can contribute to greater price volatility in the event of institutional buying or selling. The number of top-rated funds owning its shares rose from 805 in Jun '22 to 1,755 in Dec '23, a reassuring sign concerning the I criteria. The current Up/Down Volume Ratio of 1.7 is an unbiased indication it has been under slight accumulation over the past 50 days. It has an A Timeliness Rating and a B Sponsorship Rating.
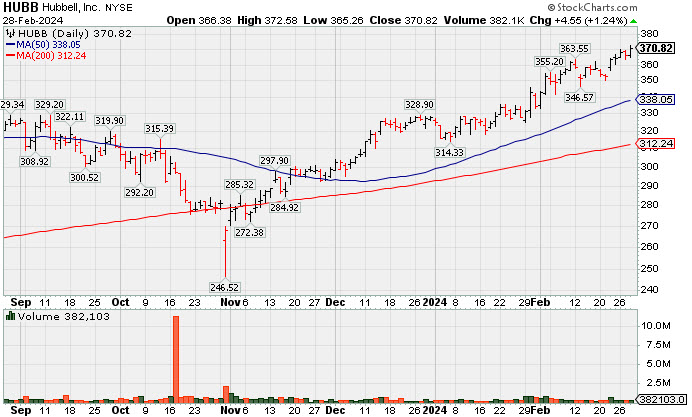
Inched to New Highs With Average Volume - Wednesday, February 28, 2024
Hubbell (HUBB+$4.55 or +1.24% to $370.82) posted a small gain today with average volume for a new all-time high, getting more extended from the previously noted base. The prior high ($340) along with its 50-day moving average (DMA) line ($339.15) define important near-term support to watch on pullbacks.HUBB was highlighted yellow in the earlier mid-day report (read here) with pivot point cited based on its 1/22/24 high as it rose from a cup-with-handle base. It was last shown in great detail in this FSU section on 1/30/24 with an annotated graph under the headline "Volume Heavy Behind Breakout Gain for Hubbell".
Quarterly earnings increases have been above the +25% minimum (C criteria). Annual earnings history (A criteria) had a downturn in FY '20 like many companies during the pandemic. It has a 94 Earnings Per Share Rating, well above the 80+ minimum for buy candidates.
The high-ranked Electrical-Power/Equipmt firm has 53.6 million shares outstanding (S criteria) which can contribute to greater price volatility in the event of institutional buying or selling. The number of top-rated funds owning its shares rose from 805 in Jun '22 to 1,727 in Dec '23, a reassuring sign concerning the I criteria. The current Up/Down Volume Ratio of 1.3 is an unbiased indication it has been under slight accumulation over the past 50 days. It has an A Timeliness Rating and a B Sponsorship Rating.
Chart courtesy of www.stockcharts.com
| Symbol/Exchange Company Name Industry Group | PRICE | CHANGE | Day High | Volume (% DAV) (% 50 day avg vol) | 52 Wk Hi | Featured Date | Price Featured | Pivot Featured |
| Max Buy | ||||||||
Arista Networks Computer-Networking | $273.17 | +1.26 0.46% | $275.54 | 1,162,751 50 DAV is 2,193,000 | $292.66 -6.66% | 10/31/2023 | $188.84 | PP = $198.80 |
| MB = $208.74 | ||||||||
| Most Recent Note - 2/22/2024 5:56:51 PM G - Posted a solid volume-driven gain today. Extended from any sound base. Its 50 DMA line ($252) defines important near-term support to watch on pullbacks. >>> FEATURED STOCK ARTICLE : Pulled Back From All Time High With Gap Down on Prior Session - 2/1/2024 | View all notes | Set NEW NOTE alert | Company Profile | SEC News | Chart | Request a new note | ||||||||
Novo Nordisk ADR Medical-Ethical Drugs | $121.54 | -0.69 -0.56% | $122.15 | 2,930,983 50 DAV is 4,648,000 | $124.87 -2.67% | 11/2/2023 | $100.97 | PP = $104.10 |
| MB = $109.31 | ||||||||
| Most Recent Note - 2/27/2024 12:25:23 PM G - Perched near its all-time high, extended from any sound base. Its 50 DMA line ($110.58) defines important near-term support to watch on pullbacks. >>> FEATURED STOCK ARTICLE : Extended From Any Sound Base After Volume-Driven Gains - 2/8/2024 | View all notes | Set NEW NOTE alert | Company Profile | SEC News | Chart | Request a new note | ||||||||
Axon Enterprise Security/Sfty | $309.43 | +37.61 13.84% | $318.90 | 2,567,031 50 DAV is 378,000 | $274.78 12.61% | 11/8/2023 | $127.84 | PP = $223.30 |
| MB = $234.47 | ||||||||
G - extended from any sound base and hitting new all-time highs with today's big volume-driven gain. Bullish action came after it reported Dec '23 quarterly earnings +60% on +29% sales revenues versus the year-ago period. Volume and volatility often increase near earnings news. Prior highs in the $260-262 area define initial support to watch above its 50-day moving average (DMA) line ($259). >>> FEATURED STOCK ARTICLE : Reversal at All-Time High After 7 Consecutive Gains - 2/12/2024 | View all notes | Set NEW NOTE alert | Company Profile | SEC News | Chart | Request a new note | ||||||||
TransDigm Group Aerospace/Defense | $1,172.00 | -2.22 -0.19% | $1,177.10 | 263,236 50 DAV is 214,000 | $1,207.58 -2.95% | 12/12/2023 | $1,000.39 | PP = $1,013.18 |
| MB = $1,063.84 | ||||||||
| Most Recent Note - 2/27/2024 11:30:31 AM G - Pulling back today with below-average volume for a 2nd loss off of its all-time high. Its 50 DMA line ($1,068) defines near-term support to watch. >>> FEATURED STOCK ARTICLE : Transdigm Perched Near All-Time High - 2/14/2024 | View all notes | Set NEW NOTE alert | Company Profile | SEC News | Chart | Request a new note | ||||||||
The Bancorp Banks-Northeast | $44.65 | -0.38 -0.84% | $45.20 | 287,632 50 DAV is 443,000 | $47.11 -5.22% | 1/22/2024 | $40.87 | PP = $42.56 |
| MB = $44.69 | ||||||||
| Most Recent Note - 2/27/2024 6:19:45 PM G - Color code was changed to green after wedging above its "max buy" level with today''s 3rd consecutive gain backed by below-average volume. Prior highs in the $42 area and its 50 DMA line ($41.28) define near-term support to watch. Fundamentals remain strong. See the latest FSU analysis for more details and a new annotated graph. >>> FEATURED STOCK ARTICLE : Wedging Above "Max Buy" Level With Gains Lacking Great Volume - 2/27/2024 | View all notes | Set NEW NOTE alert | Company Profile | SEC News | Chart | Request a new note | ||||||||
| Symbol/Exchange Company Name Industry Group | PRICE | CHANGE | Day High | Volume (% DAV) (% 50 day avg vol) | 52 Wk Hi | Featured Date | Price Featured | Pivot Featured |
| Max Buy | ||||||||
lululemon athletica Retail-Apparel/Shoes/Acc | $464.14 | -3.70 -0.79% | $474.17 | 888,307 50 DAV is 1,240,000 | $516.39 -10.12% | 12/8/2023 | $490.61 | PP = $485.93 |
| MB = $510.23 | ||||||||
| Most Recent Note - 2/22/2024 6:03:00 PM G - Posted a gain today with below-average volume. Still lingering below its 50 DMA line ($481) which is now downward sloping and may act as resistance. A rebound above the 50 DMA line is needed to help its outlook improve. >>> FEATURED STOCK ARTICLE : Violation of 50-Day Moving Average Hurt Outlook - 2/2/2024 | View all notes | Set NEW NOTE alert | Company Profile | SEC News | Chart | Request a new note | ||||||||
CrowdStrike Holdings Computer Sftwr-Security | $320.85 | -0.36 -0.11% | $321.69 | 2,064,410 50 DAV is 3,255,000 | $338.45 -5.20% | 1/2/2024 | $246.42 | PP = $261.91 |
| MB = $275.01 | ||||||||
| Most Recent Note - 2/26/2024 5:08:30 PM G - Posted a 3rd consecutive volume-driven gain today. Showing strength after testing support near its 50 DMA line ($286.85). Fundamentals remain strong. >>> FEATURED STOCK ARTICLE : Volume Totals Cooking While Stubbornly Perched at All-Time High - 2/6/2024 | View all notes | Set NEW NOTE alert | Company Profile | SEC News | Chart | Request a new note | ||||||||
e.l.f. Beauty Cosmetics/Personal Care | $204.75 | +2.75 1.36% | $206.60 | 1,265,065 50 DAV is 1,478,000 | $204.72 0.01% | 1/2/2024 | $138.23 | PP = $153.63 |
| MB = $161.31 | ||||||||
| Most Recent Note - 2/26/2024 5:09:29 PM G - Posted a 4th consecutive gain today for yet another new all-time high. Reported Dec '23 quarterly earnings +54% on +85% sales revenues versus the year-ago period, continuing its strong earnings track record. Its 50 DMA line ($158) defines important near-term support to watch. >>> FEATURED STOCK ARTICLE : Peched at All-Time High With Earnings News Due - 2/5/2024 | View all notes | Set NEW NOTE alert | Company Profile | SEC News | Chart | Request a new note | ||||||||
Coca-Cola Femsa ADR Beverages-Non-Alcoholic | $96.67 | -3.23 -3.23% | $99.82 | 194,957 50 DAV is 163,000 | $104.38 -7.39% | 1/12/2024 | $93.38 | PP = $99.34 |
| MB = $104.31 | ||||||||
| Most Recent Note - 2/23/2024 5:22:14 PM Y - Sputtering after a noted "negative reversal" at its all-time high. Reported Dec ''23 quarterly earnings -13% on +24% sales revenues versus the year-ago period. Volume and volatility often increase near earnings news. Its 50 DMA line ($94.83) defines important near-term support to watch on pullbacks. >>> FEATURED STOCK ARTICLE : Perched at High With Earnings News Due - 2/21/2024 | View all notes | Set NEW NOTE alert | Company Profile | SEC News | Chart | Request a new note | ||||||||
Paccar Trucks and Parts-Hvy Duty | $111.37 | +0.04 0.04% | $112.05 | 1,631,763 50 DAV is 2,231,000 | $112.68 -1.16% | 1/23/2024 | $100.35 | PP = $98.57 |
| MB = $103.50 | ||||||||
| Most Recent Note - 2/26/2024 5:06:25 PM G - Hit another new all-time high with today''s 4th consecutive gain backed by below-average volume, getting more extended from any sound base. Its 50 DMA line ($100) defines near-term support to watch on pullbacks. Fundamentals remain strong. See the latest FSU analysis for more details and a new annotated graph. >>> FEATURED STOCK ARTICLE : Extended From Any Sound Base After 7 Weekly Gains - 2/26/2024 | View all notes | Set NEW NOTE alert | Company Profile | SEC News | Chart | Request a new note | ||||||||
| Symbol/Exchange Company Name Industry Group | PRICE | CHANGE | Day High | Volume (% DAV) (% 50 day avg vol) | 52 Wk Hi | Featured Date | Price Featured | Pivot Featured |
| Max Buy | ||||||||
Hubbell Electrical-Power/Equipmt | $370.82 | +4.55 1.24% | $372.59 | 382,391 50 DAV is 390,000 | $371.50 -0.18% | 1/30/2024 | $343.26 | PP = $336.83 |
| MB = $353.67 | ||||||||
G - Posted a small gain with average volume for another new all-time high, getting more extended from the previously noted base. Prior high ($340) and its 50 DMA line define important support to watch on pullbacks. See the latest FSU analysis for more details and a new annotated graph. >>> FEATURED STOCK ARTICLE : Inched to New Highs With Average Volume - 2/28/2024 | View all notes | Set NEW NOTE alert | Company Profile | SEC News | Chart | Request a new note | ||||||||
Manhattan Associates Computer Sftwr-Enterprse | $253.93 | +3.46 1.38% | $254.47 | 442,536 50 DAV is 390,000 | $258.91 -1.92% | 1/31/2024 | $240.57 | PP = $230.71 |
| MB = $242.25 | ||||||||
| Most Recent Note - 2/27/2024 11:27:26 AM G - Perched near its all-time high with light volume behind today''s 4th consecutive small gain. Prior highs in the $230 area define near-term support to watch on pullbacks. >>> FEATURED STOCK ARTICLE : Big Volume Behind Breakout Gain - 1/31/2024 | View all notes | Set NEW NOTE alert | Company Profile | SEC News | Chart | Request a new note | ||||||||
Tenable Holdings Computer Sftwr-Security | $47.21 | -0.18 -0.38% | $47.29 | 764,715 50 DAV is 1,042,400 | $53.50 -11.76% | 2/7/2024 | $49.50 | PP = $49.87 |
| MB = $52.36 | ||||||||
| Most Recent Note - 2/27/2024 11:32:02 AM G - Its Relative Strength rating has slumped to 71, well below the 80+ minimum guideline for buy candidates. Finding support recently above the 50 DMA line ($47.14). Fundamentals remain strong. >>> FEATURED STOCK ARTICLE : Gap Up Gain Followed Latest Earnings Report - 2/7/2024 | View all notes | Set NEW NOTE alert | Company Profile | SEC News | Chart | Request a new note | ||||||||
U.S. Lime & Minerals Bldg-Cement/Concrt/Ag | $253.50 | -1.48 -0.58% | $255.99 | 9,614 50 DAV is 18,000 | $266.88 -5.01% | 2/9/2024 | $254.68 | PP = $265.09 |
| MB = $278.34 | ||||||||
| Most Recent Note - 2/27/2024 11:28:38 AM Y - Perched near its all-time high with volume totals cooling. Subsequent gains and a close above the pivot point backed by at least +40% above average volume may trigger a conviciing new technical buy signal. Through Dec ''23 its quarterly and annual earnings (C and A criteria) history has been strong, a good match with the fact-based investment system''s guidelines. Thinly traded firm has only 5.7 million shares outstanding (S criteria), which can contribute to greater price volatility in the event of institutional buying or selling. >>> FEATURED STOCK ARTICLE : Strong Finish for Thinly Traded U.S Lime & Minerals - 2/9/2024 | View all notes | Set NEW NOTE alert | Company Profile | SEC News | Chart | Request a new note | ||||||||
ServiceNow Computer Sftwr-Enterprse | $759.79 | -7.35 -0.96% | $763.73 | 1,260,237 50 DAV is 1,205,000 | $815.32 -6.81% | 2/22/2024 | $771.75 | PP = $815.32 |
| MB = $856.09 | ||||||||
| Most Recent Note - 2/23/2024 5:17:22 PM Y - Color code was changed to yellow as it was noted that a valid secondary buy point exists up to +5% above the latest high after finding support at its 10 WMA line following an earlier breakout. Reported Dec '23 quarterly earnings +36% on +26% sales revenues versus the year-ago period, its 6th quarterly comparison above the +25% minimum guideline (C criteria) of the fact-based investment system. See the latest FSU analysis for more details and a new annotated graph. >>> FEATURED STOCK ARTICLE : Found Support With a Solid Gap Up from 10-Week Moving Average - 2/23/2024 | View all notes | Set NEW NOTE alert | Company Profile | SEC News | Chart | Request a new note | ||||||||
| Symbol/Exchange Company Name Industry Group | PRICE | CHANGE | Day High | Volume (% DAV) (% 50 day avg vol) | 52 Wk Hi | Featured Date | Price Featured | Pivot Featured |
| Max Buy | ||||||||
Synopsys Computer Sftwr-Design | $570.28 | -3.72 -0.65% | $572.79 | 576,751 50 DAV is 1,473,000 | $629.38 -9.39% | 2/22/2024 | $600.65 | PP = $582.85 |
| MB = $611.99 | ||||||||
| Most Recent Note - 2/22/2024 5:55:08 PM Y - Gapped up and hit a new all-time high today but encountered distributional pressure and ended near the session low, closing below the pivot point cited based on its 2/09/24 high after a cup-with-handle base. A strong close above the pivot point is needed to clinch a proper technical buy signal. Found support recently at its 50 DMA line ($536). Reported Jan '24 quarterly earnings +36% on +21% sales revenues versus the year-ago period, its 3rd strong quarter above the +25% minimum earnings guideline (C criteria). Annual earnings growth (A criteria) has been strong and steady. See the latest FSU analysis for more details and a new annotated graph. >>> FEATURED STOCK ARTICLE : Gapped Up for New High But Ended Near Session Low - 2/22/2024 | View all notes | Set NEW NOTE alert | Company Profile | SEC News | Chart | Request a new note | ||||||||
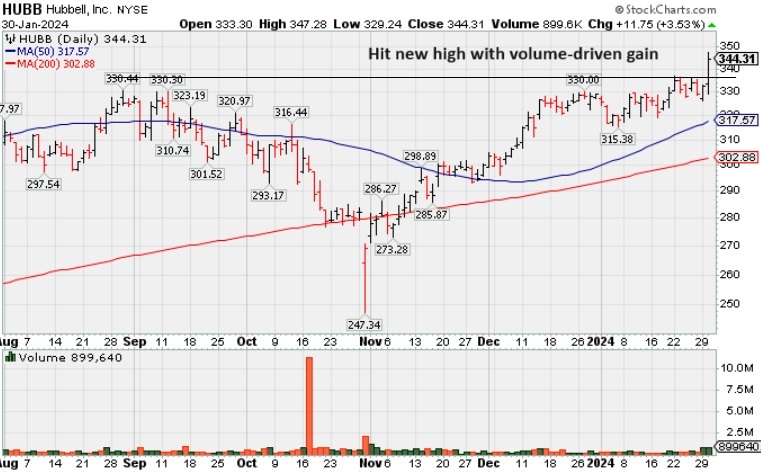
Volume Heavy Behind Breakout Gain for Hubbell - Tuesday, January 30, 2024
Hubbell (HUBB +$11.75 or +3.53% to $344.31) hit a new high with today's big gain backed by +139% above average volume triggering a technical buy signal. Fundamentals remain strong after Dec '23 earnings rose +42% on +10% sales revenues versus the year-ago period.HUBB was highlighted yellow in the earlier mid-day report (read here) with pivot point cited based on its 1/22/24 high as it rose from a cup-with-handle base. It was last shown in great detail in this FSU section on 8/24/23 with an annotated graph under the headline "Rebounded Near 50-Day Moving Average Line".
Quarterly earnings increases have been above the +25% minimum (C criteria). Annual earnings history (A criteria) had a downturn in FY '20 like many companies during the pandemic. It has a 93 Earnings Per Share Rating, well above the 80+ minimum for buy candidates.
The high-ranked Electrical-Power/Equipmt firm has 53.6 million shares outstanding (S criteria) which can contribute to greater price volatility in the event of institutional buying or selling. The number of top-rated funds owning its shares rose from 805 in Jun '22 to 1,679 in Dec '23, a reassuring sign concerning the I criteria. The current Up/Down Volume Ratio of 1.2 is an unbiased indication it has been under slight accumulation over the past 50 days. It has an B Timeliness Rating and a B Sponsorship Rating.
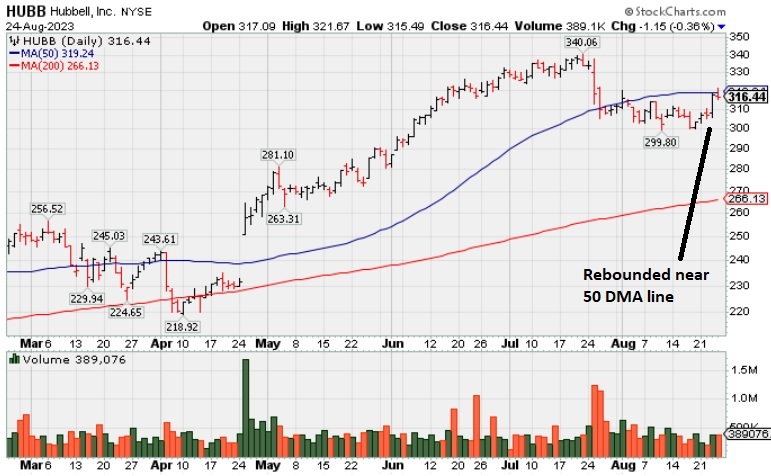
Rebounded Near 50-Day Moving Average Line - Thursday, August 24, 2023
Hubbell (HUBB -$1.15 or -0.36% to $316.44) pulled back after rebounding near its 50-day moving average (DMA) line ($319.27) and perched only -6.9% off its all-time high. A rebound above the 50 DMA line is needed for its outlook to improve. Fundamentals remain strong after Jun '23 earnings rose +45% on +9% sales revenues versus the year-ago period.HUBB was highlighted yellow in the 4/25/23 mid-day report (read here) with pivot point cited based on its 3/06/23 high as it gapped up after a 4-month "double bottom" base. It was last shown in great detail in this FSU section on 7/26/23 with an annotated graph under the headline "Pulled Back Undercutting 50 Day Moving Average Line".
Quarterly earnings increases have been above the +25% minimum (C criteria). Annual earnings history (A criteria) had a downturn in FY '20 like many companies during the pandemic. It has a 95 Earnings Per Share Rating, well above the 80+ minimum for buy candidates.
The high-ranked Electrical-Power/Equipmt firm has 53.6 million shares outstanding (S criteria) which can contribute to greater price volatility in the event of institutional buying or selling. The number of top-rated funds owning its shares rose from 805 in Jun '22 to 1,409 in Jun '23, a reassuring sign concerning the I criteria. The current Up/Down Volume Ratio of 0.8 is an unbiased indication it has been under distributional pressure over the past 50 days. It has an A Timeliness Rating and a B Sponsorship Rating.
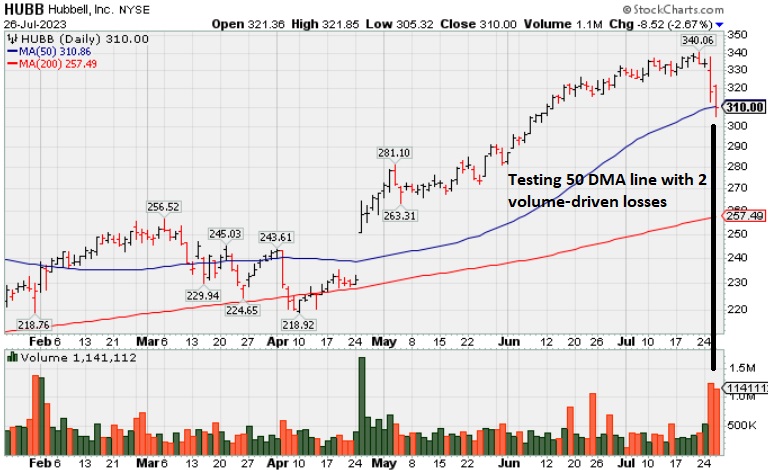
Pulled Back Undercutting 50 Day Moving Average Line - Wednesday, July 26, 2023
Hubbell (HUBB -$8.52 or -2.67% to $310.00) abruptly retreated from its all-time high with today's 2nd consecutive volume-driven loss undercutting its 50-day moving average (DMA) line ($311), important support to watch. More damaging losses would riase greater concerns and trigger a technical sell signal. Fundamentals remain strong.HUBB was highlighted yellow in the 4/25/23 mid-day report (read here) with pivot point cited based on its 3/06/23 high as it gapped up after a 4-month "double bottom" base. It was last shown in great detail in this FSU section on 6/22/23 with an annotated graph under the headline "Hubbell on Track for 11th Weekly Gain".
HUBB reported Jun '23 quarterly earnings +45% on +9% sales revenues over the year-ago period, continuing its streak of quarterly earnings increases were above the +25% minimum (C criteria). Annual earnings history (A criteria) had a downturn in FY '20 like many companies during the pandemic. It has a 95 Earnings Per Share Rating, well above the 80+ minimum for buy candidates.
The high-ranked Electrical-Power/Equipmt firm has 53.6 million shares outstanding (S criteria) which can contribute to greater price volatility in the event of institutional buying or selling. The number of top-rated funds owning its shares rose from 805 in Jun '22 to 1,374 in Jun '23, a reassuring sign concerning the I criteria. The current Up/Down Volume Ratio of 2.1 is an unbiased indication it has been neutral concerning accumulation/distribution over the past 50 days. It has an A Timeliness Rating and a B Sponsorship Rating.
Hubbell on Track for 11th Weekly Gain - Thursday, June 22, 2023
Hubbell (HUBB -$1.34 or -0.42% to $321.43) pulled back today with below-average volume following a new all-time high. It is very extended from the prior base and on track for an 11th consecutive weekly gain. Prior highs in the $263 area define initial support to watch on pullbacks. Fundamentals remain strong.HUBB was highlighted yellow in the 4/25/23 mid-day report (read here) with pivot point cited based on its 3/06/23 high as it gapped up after a 4-month "double bottom" base. It was last shown in great detail in this FSU section on 6/01/23 with an annotated graph under the headline "Extended From Prior Base and Perched Near High".
Strong action came after it reported strong Mar '23 quarterly earnings +70% on +11% sales revenues over the year-ago period. Its Mar, Jun, Sep, and Dec '22 quarterly earnings increases were above the +25% minimum (C criteria). Annual earnings history (A criteria) had a downturn in FY '20 like many companies during the pandemic. It has a 94 Earnings Per Share Rating, well above the 80+ minimum for buy candidates..
The high-ranked Electrical-Power/Equipmt firm has 53.6 million shares outstanding (S criteria) which can contribute to greater price volatility in the event of institutional buying or selling. The number of top-rated funds owning its shares rose from 805 in Jun '22 to 1,335 in Mar '23, a reassuring sign concerning the I criteria. The current Up/Down Volume Ratio of 2.3 is an unbiased indication it has been under accumulation over the past 50 days. It has an A Timeliness Rating and a C Sponsorship Rating.
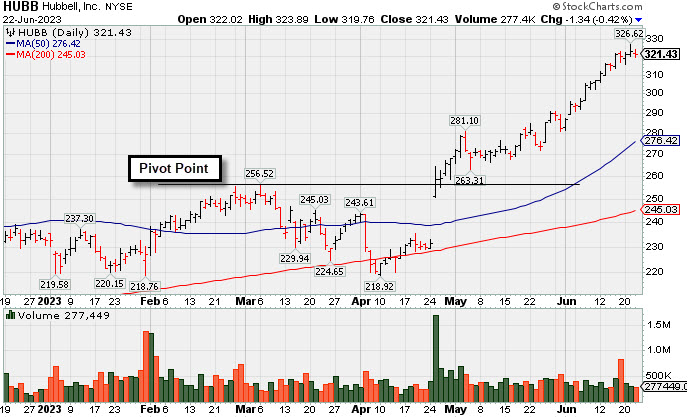
Extended From Prior Base and Perched Near High - Thursday, June 1, 2023
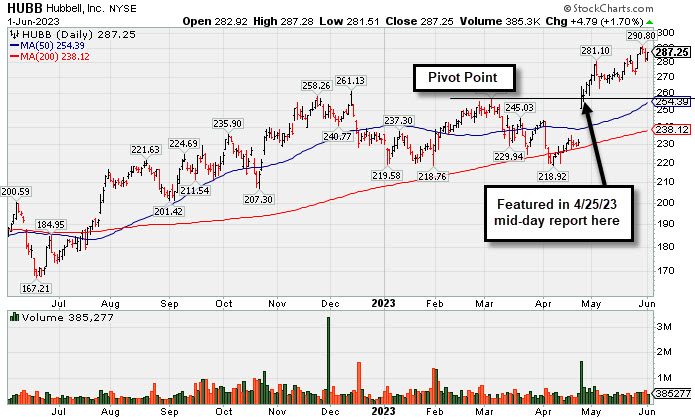
Hubbell (HUBB +$4.79 or +1.70% to $287.25) remains perched near its all-time high, extended from any sound base. Prior highs in the $263 area define initial support to watch on pullbacks.HUBB was highlighted yellow in the 4/25/23 mid-day report (read here) with pivot point cited based on its 3/06/23 high after a 4-month double bottom base. It was shown in greater detail that evening with an annotated graph under the headline "Gap Up Following Earnings Triggered Technical Buy Signal".
Strong action came after it reported strong Mar '23 quarterly earnings +70% on +11% sales revenues over the year-ago period. Its Mar, Jun, Sep, and Dec '22 quarterly earnings increases were above the +25% minimum (C criteria). Annual earnings history (A criteria) had a downturn in FY '20 like many companies during the pandemic. It has a 94 Earnings Per Share Rating, well above the 80+ minimum for buy candidates..
The high-ranked Electrical-Power/Equipmt firm has 53.6 million shares outstanding (S criteria) which can contribute to greater price volatility in the event of institutional buying or selling. The number of top-rated funds owning its shares rose from 805 in Jun '22 to 1,335 in Mar '23, a reassuring sign concerning the I criteria. The current Up/Down Volume Ratio of 1.9 is an unbiased indication it has been under accumulation over the past 50 days. It has an A Timeliness Rating and a B Sponsorship Rating.
| Symbol/Exchange Company Name Industry Group | PRICE | CHANGE | Day High | Volume (% DAV) (% 50 day avg vol) | 52 Wk Hi | Featured Date | Price Featured | Pivot Featured |
| Max Buy | ||||||||
Graphic Packaging Hldg CONSUMER NON-DURABLES - Packaging and Containers | $24.16 | +0.26 1.09% | $24.31 | 2,868,461 50 DAV is 2,744,200 | $26.16 -7.65% | 10/25/2022 | $22.75 | PP = $24.17 |
| MB = $25.38 | ||||||||
| Most Recent Note - 5/31/2023 2:57:11 PM G - Tested its 4/27/23 low today which defines near term support to watch above its 200 DMA line ($23.14). Volume totals have been below average but it slumped below its 50 DMA line ($25) triggering a technical sell signal during a 7-session losing streak. A rebound above the 50 DMA line is needed for its outlook to improve. Reported Mar '23 quarterly earnings +60% on +9% sales revenues versus the year-ago period. >>> FEATURED STOCK ARTICLE : Packaging Firm Due to Report Earnings News - 5/1/2023 | View all notes | Set NEW NOTE alert | Company Profile | SEC News | Chart | Request a new note | ||||||||
Sterling Infrastructure MATERIALS and; CONSTRUCTION - Heavy Construction | $46.44 | +0.37 0.80% | $46.81 | 264,258 50 DAV is 238,000 | $48.44 -4.13% | 12/14/2022 | $32.41 | PP = $33.72 |
| MB = $35.41 | ||||||||
| Most Recent Note - 5/31/2023 2:48:36 PM G - Retreating from its all-time high with above average volume behind today's loss following 9 consecutive gains. Reported Mar '23 quarterly earnings +0% on +10% sales revenues versus the year-ago period, below the +25% minimum earnings guideline (C criteria) raising fundamental concerns. >>> FEATURED STOCK ARTICLE : 50-Day Moving Average Line Acted as Recent Resistance - 4/28/2023 | View all notes | Set NEW NOTE alert | Company Profile | SEC News | Chart | Request a new note | ||||||||
Comfort Systems USA MATERIALS and CONSTRUCTION - General Contractors | $148.38 | +0.40 0.27% | $148.79 | 217,863 50 DAV is 276,000 | $156.19 -5.00% | 4/27/2023 | $148.85 | PP = $152.23 |
| MB = $159.84 | ||||||||
| Most Recent Note - 5/30/2023 9:31:21 PM Y - Still perched near its all-time high. No resistance remains due to overhead supply, however, it has made little headway in recent weeks. Subsequent gains and new highs backed by at least +40% above average volume may help reconfirm a technical buy signal. >>> FEATURED STOCK ARTICLE : Churning Action While Recently Hovering Near All-Time High - 5/12/2023 | View all notes | Set NEW NOTE alert | Company Profile | SEC News | Chart | Request a new note | ||||||||
Coca-Cola Femsa ADR FOOD and BEVERAGE - Beverages - Soft Drinks | $83.45 | +0.63 0.76% | $84.18 | 142,716 50 DAV is 199,000 | $91.23 -8.53% | 3/7/2023 | $76.63 | PP = $77.11 |
| MB = $80.97 | ||||||||
| Most Recent Note - 5/30/2023 9:40:04 PM G - Testing support near its 50 DMA line ($83.94) with higher volume behind today's 6th consecutive loss. More damaging losses would trigger a technical sell signal. Reported Mar '23 quarterly earnings +53% on +24% sales revenues versus the year-ago period. Prior highs in the $79-$77 area define the next support to watch below its 50 DMA line. >>> FEATURED STOCK ARTICLE : Posted Gain Afrer Reporting Strong Mar '23 Quarterly Results - 5/2/2023 | View all notes | Set NEW NOTE alert | Company Profile | SEC News | Chart | Request a new note | ||||||||
Clean Harbors Pollution Control | $143.49 | +3.09 2.20% | $143.55 | 295,102 50 DAV is 380,000 | $147.76 -2.89% | 3/10/2023 | $136.89 | PP = $136.74 |
| MB = $143.58 | ||||||||
G - Found support near its 50 DMA line ($140.23) today following a volume-driven loss on the prior session. More damaging losses would raise greater concerns. Reported Mar '23 quarterly earnings +64% on +12% sales revenues versus the year-ago period. Fundamentals remain strong. >>> FEATURED STOCK ARTICLE : Showed Resilience Near 50-Day Moving Average Following Sell-Off - 5/10/2023 | View all notes | Set NEW NOTE alert | Company Profile | SEC News | Chart | Request a new note | ||||||||
| Symbol/Exchange Company Name Industry Group | PRICE | CHANGE | Day High | Volume (% DAV) (% 50 day avg vol) | 52 Wk Hi | Featured Date | Price Featured | Pivot Featured |
| Max Buy | ||||||||
SPS Commerce COMPUTER SOFTWARE and SERVICES - Application Software | $158.47 | +2.67 1.71% | $159.42 | 157,332 50 DAV is 139,000 | $164.69 -3.78% | 4/24/2023 | $150.01 | PP = $157.56 |
| MB = $165.44 | ||||||||
| Most Recent Note - 5/31/2023 2:53:37 PM Y - Pulling back testing its 50 DMA line ($151.91) today after a "negative reversal" on the prior session when wedging to a new 52-week high. Recent gains above the pivot point were not backed by the +40% above average volume needed to trigger a proper technical buy signal. Reported Mar '23 quarterly earnings +22% on +20% versus the year-ago period, below the +25% minimum earnings guideline (C criteria) raising some fundamental concerns. >>> FEATURED STOCK ARTICLE : Pulled Back After Quietly Wedging to New Highs - 5/31/2023 | View all notes | Set NEW NOTE alert | Company Profile | SEC News | Chart | Request a new note | ||||||||
Hubbell Electrical-Power/Equipmt | $287.25 | +4.79 1.70% | $287.28 | 385,277 50 DAV is 400,000 | $291.91 -1.60% | 4/25/2023 | $262.85 | PP = $257.51 |
| MB = $270.39 | ||||||||
G - Perched near its all-time high, extended from the prior base. Prior highs in the $263 area define initial support to watch on pullbacks. Fundamentals remain strong. See the latest FSU analysis for more details and a new annotated graph. >>> FEATURED STOCK ARTICLE : Extended From Prior Base and Perched Near High - 6/1/2023 | View all notes | Set NEW NOTE alert | Company Profile | SEC News | Chart | Request a new note | ||||||||
NVR MATERIALS and CONSTRUCTION - Residential Construction | $5,570.61 | +16.39 0.30% | $5,588.65 | 25,398 50 DAV is 23,000 | $5,986.96 -6.95% | 4/25/2023 | $5,882.18 | PP = $5,978.25 |
| MB = $6,277.16 | ||||||||
| Most Recent Note - 5/30/2023 9:44:46 PM G - Slumped below its 50 DMA line last week raising technical concerns. Reported Mar '23 quarterly earnings -14% on -3% sales revenues versus the year-ago period, below the +25% minimum earnings guideline (C criteria) raising fundamental concerns, and its color code was changed to green. Prior quarterly comparisons were well above the +25% minimum earnings guideline (C criteria). Annual earnings (A criteria) growth has been very strong. >>> FEATURED STOCK ARTICLE : Fell From High and Raised Concern With Subpar Mar '23 Report - 4/27/2023 | View all notes | Set NEW NOTE alert | Company Profile | SEC News | Chart | Request a new note | ||||||||
PulteGroup MATERIALS and CONSTRUCTION - Residential Construction | $67.30 | +1.22 1.85% | $67.38 | 2,132,777 50 DAV is 2,891,000 | $70.54 -4.59% | 4/25/2023 | $65.17 | PP = $64.01 |
| MB = $67.21 | ||||||||
G - Color code is changed to green after rising back above its "max buy" level. Reported earnings +28% for the Mar '23 quarter versus the year-ago period. Important support to watch is its 50 DMA line ($63.47). >>> FEATURED STOCK ARTICLE : Recently Rallying to New All-Time Highs - 4/26/2023 | View all notes | Set NEW NOTE alert | Company Profile | SEC News | Chart | Request a new note | ||||||||
Coca-Cola Consolidated FOOD and BEVERAGE - Beverages - Soft Drinks | $680.24 | +18.50 2.80% | $684.73 | 31,358 50 DAV is 33,000 | $694.20 -2.01% | 5/4/2023 | $646.66 | PP = $656.21 |
| MB = $689.02 | ||||||||
Y - Posted a gain with average volume today approaching its "max buy" level. Bullish action came after it reported Mar '23 quarterly earnings +93% on +12% sales revenues versus the year-ago period, continuing its strong earnings track record. >>> FEATURED STOCK ARTICLE : COKE is Showing Real Strength - 5/4/2023 | View all notes | Set NEW NOTE alert | Company Profile | SEC News | Chart | Request a new note | ||||||||
| Symbol/Exchange Company Name Industry Group | PRICE | CHANGE | Day High | Volume (% DAV) (% 50 day avg vol) | 52 Wk Hi | Featured Date | Price Featured | Pivot Featured |
| Max Buy | ||||||||
Amphastar Pharm Medical-Biomed/Biotech | $45.14 | +0.77 1.74% | $45.49 | 480,480 50 DAV is 383,000 | $45.50 -0.79% | 5/15/2023 | $43.56 | PP = $44.15 |
| MB = $46.36 | ||||||||
| Most Recent Note - 5/30/2023 9:16:32 PM Y - Volume totals have been cooling while hovering near its all-time high. Subsequent gains and a strong close above the pivot point backed by at least +40% above average volume may clinch a technical buy signal. Three of the 4 latest quarterly comparisons through Mar '23 versus the year-ago periods have been strong and well above the +25% minimum earnings guideline (C criteria). Annual earnings history (A criteria) has been strong. >>> FEATURED STOCK ARTICLE : Weak Finish After Early Gain When Perched Near All-Time High - 5/15/2023 | View all notes | Set NEW NOTE alert | Company Profile | SEC News | Chart | Request a new note | ||||||||
Arista Networks Computer-Networking | $166.68 | +0.34 0.20% | $167.77 | 3,619,860 50 DAV is 3,229,000 | $178.36 -6.55% | 5/30/2023 | $176.35 | PP = $171.54 |
| MB = $180.12 | ||||||||
| Most Recent Note - 5/31/2023 2:50:54 PM Y - Pulling back today following 4 consecutive volume-driven gains hitting a new high triggering a technical buy signal. Color code was changed to yellow with new pivot point cited based on its 3/23/23 high plus 10 cents in the 5/30/23 mid-day report. Reported Mar '23 quarterly earnings +70% on +54% sales revenues versus the year-ago period and fundamentals remain strong. Found support at its 200 DMA line in recent weeks since dropped from the Featured Stocks list on 5/03/23. >>> FEATURED STOCK ARTICLE : Technical Sell Signal Triggered by Damaging Volume-Driven Loss - 5/3/2023 | View all notes | Set NEW NOTE alert | Company Profile | SEC News | Chart | Request a new note | ||||||||
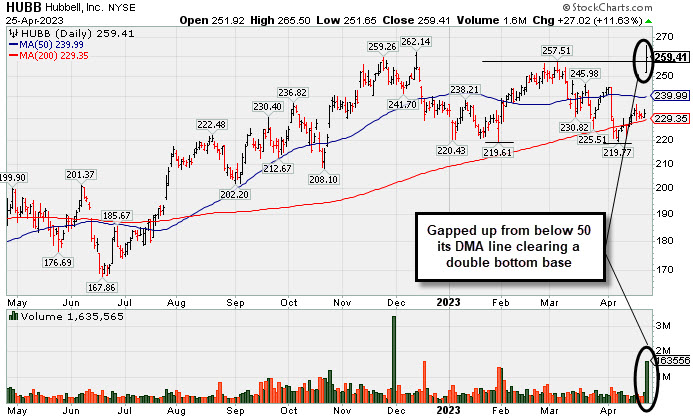
Gap Up Following Earnings Triggered Technical Buy Signal - Tuesday, April 25, 2023
Hubbell (HUBB +$27.02 or +11.63% to $259.41) was highlighted yellow in the earlier mid-day report (read here) with pivot point cited based on its 3/06/23 high after a 4-month double bottom base. It gapped up today rebounding above its 50-day moving average (DMA) line ($240) with a considerable volume-driven gain hitting a new 52-week high. The bullish action triggered a technical buy signal.Strong action came after it reported strong Mar '23 quarterly earnings +70% on +11% sales revenues over the year-ago period. Its Mar, Jun, Sep, and Dec '22 quarterly earnings increases were above the +25% minimum (C criteria). Annual earnings history (A criteria) had a downturn in FY '20 like many companies during the pandemic. It has a 93 Earnings Per Share Rating, well above the 80+ minimum for buy candidates..
The high-ranked Electrical-Power/Equipmt firm has 53.6 million shares outstanding (S sctiteria) which can contribute to greater proice volatility in the event of institutional buying or selling. The number of top-rated funds owning its shares rose from 805 in Jun '22 to 1,283 in Mar '23, a reassuring sign concerning the I criteria. The current Up/Down Volume Ratio of 1.0 is neutral concerning accumulation/distribution over the past 50 days. It has a B Timeliness Rating and a B Sponsorship Rating.