You are not logged in.
This means you
CAN ONLY VIEW reports that were published prior to Thursday, March 20, 2025.
You
MUST UPGRADE YOUR MEMBERSHIP if you want to see any current reports.
AFTER MARKET UPDATE - TUESDAY, APRIL 25TH, 2023
Previous After Market Report Next After Market Report >>>
|
|
|
|
DOW |
-344.57 |
33,530.83 |
-1.02% |
|
Volume |
863,262,407 |
+15% |
|
Volume |
4,881,919,500 |
-0% |
|
NASDAQ |
-238.05 |
11,799.16 |
-1.98% |
|
Advancers |
462 |
16% |
|
Advancers |
980 |
22% |
|
S&P 500 |
-65.41 |
4,071.63 |
-1.58% |
|
Decliners |
2,470 |
84% |
|
Decliners |
3,483 |
78% |
|
Russell 2000 |
-42.92 |
1,745.95 |
-2.40% |
|
52 Wk Highs |
38 |
|
|
52 Wk Highs |
40 |
|
|
S&P 600 |
-30.10 |
1,129.92 |
-2.59% |
|
52 Wk Lows |
100 |
|
|
52 Wk Lows |
385 |
|
|
 |
Stocks Come Under Widespread Pressure Raising Concerns
Kenneth J. Gruneisen - Passed the CAN SLIM® Master's Exam
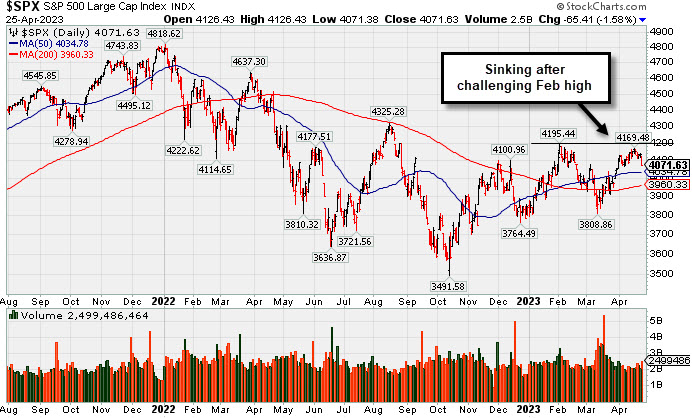
The Dow Jones Industrial Average fell 344 points (1%) while the Nasdaq Composite slid 2% and the benchmark S&P 500 dropped 1.6%. Volume totals reported were mixed, higher than the prior session on the NYSE and lighter on the Nasdaq exchange. Breadth was clearly negative as decliners led advancers by a 5-1 margin on the NYSE and by a 7-2 margin on the Nasdaq exchange. There were 20 high-ranked companies from the Leaders List that hit a new 52-week high and were listed on the BreakOuts Page, versus the total of 18 on the prior session. New 52-week lows totals expanded and outnumbered shrinking new 52-week highs totals on the NYSE and on the Nasdaq exchange.The major indices are in an uptrend under pressure (M criteria). Appropriate new buying efforts may be considered under the fact-based investment system.
PICTURED: The S&P 500 Index is pulling back after challenging its February 2, 2023 high.
All sectors finished in negative territory as U.S. equities moved lower Tuesday amid renewed banking jitters. Bank earnings have been under scrutiny following last month’s banking crisis, and recent earnings results have reignited concerns over the Financials sector. Investors were also looking ahead to Big Tech earnings and key economic data.
On the data front, the Federal Housing Finance Agency House Price Index and the S&P CoreLogic Case-Shiller 20-City Index both unexpectedly climbed in February. Meanwhile, the S&P CoreLogic Case-Shiller National Home Price Index rose for the first time in seven months as housing demand outstripped supply. New home sales jumped 9.6% month-over-month in March, while the Conference Board Consumer Confidence Index fell more than expected to 101.3 in April. The report indicated tighter credit supply played a role in the declining print. Finally, the Richmond Federal Reserve (Fed) Manufacturing Index slid further into negative territory, coming in at -10 in April.
Treasuries weakened, with the yield on the benchmark 10-year note down 12 basis points (0.12%) to 3.39%, while the 30-year bond yield shed seven basis points (0.07%) to 3.65%. The yield on the two-year note, which is more sensitive to changes in Fed policy, fell 21 basis points (0.21%) to 3.93%. In commodities, West Texas Intermediate (WTI) crude declined 2.1% to $77.13 /barrel as uncertainty over the economic outlook outweighed optimism over demand from China. |
 Kenneth J. Gruneisen started out as a licensed stockbroker in August 1987, a couple of months prior to the historic stock market crash that took the Dow Jones Industrial Average down -22.6% in a single day. He has published daily fact-based fundamental and technical analysis on high-ranked stocks online for two decades. Through FACTBASEDINVESTING.COM, Kenneth provides educational articles, news, market commentary, and other information regarding proven investment systems that work in good times and bad.
Comments contained in the body of this report are technical opinions only and are not necessarily those of Gruneisen Growth Corp. The material herein has been obtained from sources believed to be reliable and accurate, however, its accuracy and completeness cannot be guaranteed. Our firm, employees, and customers may effect transactions, including transactions contrary to any recommendation herein, or have positions in the securities mentioned herein or options with respect thereto. Any recommendation contained in this report may not be suitable for all investors and it is not to be deemed an offer or solicitation on our part with respect to the purchase or sale of any securities. |
|
 |
Financial, Tech, Energy, and Retail Indexes Slumped
Kenneth J. Gruneisen - Passed the CAN SLIM® Master's Exam
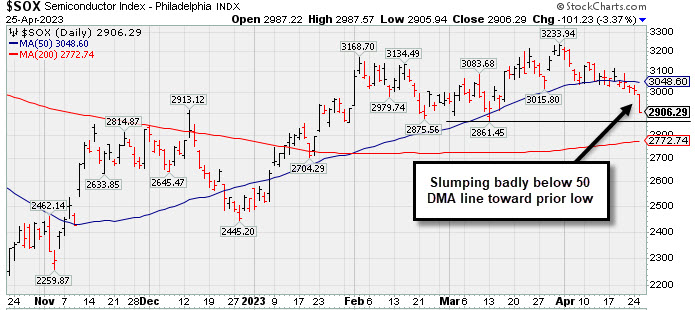
Losses from the Bank Index ($BKX -3.45%), Broker/Dealer Index ($XBD -2.43%), and Retail Index ($RLX -2.65%) weighed on the major averages as each fell by more than 2%. Energy-linked groups slumped as the Oil Services Index ($OSX -3.82%) and Integrated Oil Index ($XOI -2.22%) both suffered big losses. The tech sector also had a clearly negative bias as the Semiconductor Index ($SOX -3.37%), Networking Index ($NWX -2.66%), and Biotech Index ($BTK -2.16%) ended unanimously lower. The Gold & Silver Index ($XAU -0.39%) was a standout as it suffered a relatively small loss on the widely negative session.
PICTURED: The Semiconductor Index ($SOX -3.37%) is slumping badly below its 50-day moving average (DMA) line toward the prior low.
| Oil Services |
$OSX |
78.34 |
-3.11 |
-3.82% |
-6.58% |
| Integrated Oil |
$XOI |
1,740.09 |
-39.44 |
-2.22% |
-2.64% |
| Semiconductor |
$SOX |
2,906.29 |
-101.23 |
-3.37% |
+14.78% |
| Networking |
$NWX |
757.22 |
-20.72 |
-2.66% |
-3.33% |
| Broker/Dealer |
$XBD |
449.26 |
-11.18 |
-2.43% |
+0.03% |
| Retail |
$RLX |
2,991.74 |
-81.54 |
-2.65% |
+8.63% |
| Gold & Silver |
$XAU |
134.44 |
-0.53 |
-0.39% |
+11.24% |
| Bank |
$BKX |
79.70 |
-2.85 |
-3.45% |
-20.98% |
| Biotech |
$BTK |
5,243.26 |
-116.01 |
-2.16% |
-0.72% |
|
|
|
 |
Gap Up Following Earnings Triggered Technical Buy Signal
Kenneth J. Gruneisen - Passed the CAN SLIM® Master's Exam
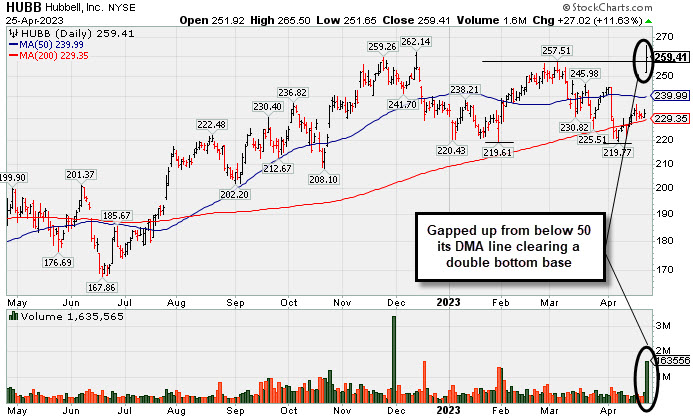
Hubbell (HUBB +$27.02 or +11.63% to $259.41) was highlighted yellow in the earlier mid-day report (read here) with pivot point cited based on its 3/06/23 high after a 4-month double bottom base. It gapped up today rebounding above its 50-day moving average (DMA) line ($240) with a considerable volume-driven gain hitting a new 52-week high. The bullish action triggered a technical buy signal.
Strong action came after it reported strong Mar '23 quarterly earnings +70% on +11% sales revenues over the year-ago period. Its Mar, Jun, Sep, and Dec '22 quarterly earnings increases were above the +25% minimum (C criteria). Annual earnings history (A criteria) had a downturn in FY '20 like many companies during the pandemic. It has a 93 Earnings Per Share Rating, well above the 80+ minimum for buy candidates..
The high-ranked Electrical-Power/Equipmt firm has 53.6 million shares outstanding (S sctiteria) which can contribute to greater proice volatility in the event of institutional buying or selling. The number of top-rated funds owning its shares rose from 805 in Jun '22 to 1,283 in Mar '23, a reassuring sign concerning the I criteria. The current Up/Down Volume Ratio of 1.0 is neutral concerning accumulation/distribution over the past 50 days. It has a B Timeliness Rating and a B Sponsorship Rating.
|
|
|
Color Codes Explained :
Y - Better candidates highlighted by our
staff of experts.
G - Previously featured
in past reports as yellow but may no longer be buyable under the
guidelines.
***Last / Change / Volume data in this table is the closing quote data***
Symbol/Exchange
Company Name
Industry Group |
PRICE |
CHANGE
(%Change) |
Day High |
Volume
(% DAV)
(% 50 day avg vol) |
52 Wk Hi
% From Hi |
Featured
Date |
Price
Featured |
Pivot Featured |
|
Max Buy |
 GPK
-
NYSE
GPK
-
NYSE
Graphic Packaging
CONSUMER NON-DURABLES - Packaging and Containers
|
$24.34
|
-0.28
-1.14% |
$24.44
|
2,296,043
79.39% of 50 DAV
50 DAV is 2,892,000
|
$25.62
-5.00%
|
10/25/2022
|
$22.75
|
PP = $24.17
|
|
MB = $25.38
|
Most Recent Note - 4/21/2023 5:29:35 PM
Y - Pulled back for a 3rd consecutive loss today testing its 50 DMA line ($24.29) which defines important near-term support to watch. It remains perched just -4.7% below its all-time high. Recent gains lacked great volume conviction. I
>>> FEATURED STOCK ARTICLE : Quietly Consolidating Just Below "Max Buy" Level - 4/10/2023 |
View all notes |
Set NEW NOTE alert |
Company Profile |
SEC
News |
Chart |
Request a new note
C
A
S
I |
STRL
-
NASDAQ
Sterling Infrastructure
MATERIALS and; CONSTRUCTION - Heavy Construction
|
$36.79
|
-0.59
-1.58% |
$37.17
|
159,706
65.99% of 50 DAV
50 DAV is 242,000
|
$42.00
-12.40%
|
12/14/2022
|
$32.41
|
PP = $33.72
|
|
MB = $35.41
|
Most Recent Note - 4/21/2023 5:32:05 PM
G - Met resistance at its 50 DMA line this week following a noted streak of 6 consecutive gains with below-average volume. A rebound above the 50 DMA line ($37.76) is needed for its outlook to improve.
>>> FEATURED STOCK ARTICLE : Volume-Driven 50-Day Moving Average Violation Triggered Sell Signal - 4/5/2023 |
View all notes |
Set NEW NOTE alert |
Company Profile |
SEC
News |
Chart |
Request a new note
C
A
S
I |
PERI
-
NASDAQ
Perion Network
Comml Svcs-Advertising
|
$35.32
|
-0.77
-2.13% |
$36.15
|
629,400
84.03% of 50 DAV
50 DAV is 749,000
|
$42.75
-17.38%
|
1/25/2023
|
$31.79
|
PP = $33.19
|
|
MB = $34.85
|
Most Recent Note - 4/24/2023 6:51:39 PM
G - Violated its 50 DMA line ($36.58) with a damaging volume-driven loss today triggering a technical sell signal. Only a prompt rebound above the 50 DMA line would help its outlook improve.
>>> FEATURED STOCK ARTICLE : Perion Pulls Back Toward 50-Day Moving Average Line - 4/20/2023 |
View all notes |
Set NEW NOTE alert |
Company Profile |
SEC
News |
Chart |
Request a new note
C
A
S
I |
ALGM
-
NASDAQ
Allegro MicroSystems
Elec-Semiconductor Mfg
|
$38.79
|
-2.34
-5.69% |
$41.20
|
3,568,540
253.45% of 50 DAV
50 DAV is 1,408,000
|
$48.72
-20.38%
|
1/31/2023
|
$37.80
|
PP = $38.38
|
|
MB = $40.30
|
 Most Recent Note - 4/25/2023 1:27:05 PM
Today's 4th consecutive damaging volume-driven loss is raising greater concerns. The 50 DMA violation on 4/17/23 triggered a noted technical sell signal. A rebound above the 50 DMA line is needed for its outlook to improve. It will be dropped from the Featured Stocks list tonight.
>>> FEATURED STOCK ARTICLE : Consolidating Near 50 DMA Line After Recent Rally - 4/11/2023 |
View all notes |
Set NEW NOTE alert |
Company Profile |
SEC
News |
Chart |
Request a new note
C
A
S
I |
FIX
-
NYSE
Comfort Systems USA
MATERIALS and CONSTRUCTION - General Contractors
|
$131.88
|
-2.13
-1.59% |
$133.91
|
284,397
97.73% of 50 DAV
50 DAV is 291,000
|
$152.13
-13.31%
|
2/23/2023
|
$136.52
|
PP = $128.78
|
|
MB = $135.22
|
Most Recent Note - 4/21/2023 5:27:20 PM
Y - Pulled back today with above-average volume and closed just below its 50 DMA line ($136.68) after recent gains helped its outlook improve. Fundamentals remain strong. It has not formed a sound base and faces resistance due to overhead supply up to the $152 level. See the latest FSU analysis for more details and a new annotated graph.
>>> FEATURED STOCK ARTICLE : Consolidating Near 50-Day Moving Average and -10.5% off High - 4/21/2023 |
View all notes |
Set NEW NOTE alert |
Company Profile |
SEC
News |
Chart |
Request a new note
C
A
S
I |
Symbol/Exchange
Company Name
Industry Group |
PRICE |
CHANGE
(%Change) |
Day High |
Volume
(% DAV)
(% 50 day avg vol) |
52 Wk Hi
% From Hi |
Featured
Date |
Price
Featured |
Pivot Featured |
|
Max Buy |
KOF
-
NYSE
Coca-Cola Femsa ADR
FOOD and BEVERAGE - Beverages - Soft Drinks
|
$84.19
|
-0.49
-0.58% |
$85.61
|
218,830
118.93% of 50 DAV
50 DAV is 184,000
|
$84.75
-0.66%
|
3/7/2023
|
$76.63
|
PP = $77.11
|
|
MB = $80.97
|
Most Recent Note - 4/24/2023 6:54:20 PM
G - Hit a new all-time high with today's quiet gain, getting more extended from the prior base. On pullbacks, prior highs in the $79-$77 area define initial support to watch along with its 50 DMA line ($77.33).
>>> FEATURED STOCK ARTICLE : Streak of 11 Straight Gains into New High Territory - 4/12/2023 |
View all notes |
Set NEW NOTE alert |
Company Profile |
SEC
News |
Chart |
Request a new note
C
A
S
I |
ANET
-
NYSE
Arista Networks
Computer-Networking
|
$153.58
|
-2.98
-1.90% |
$157.64
|
2,736,766
106.70% of 50 DAV
50 DAV is 2,565,000
|
$171.44
-10.42%
|
4/24/2023
|
$156.56
|
PP = $171.54
|
|
MB = $180.12
|
Most Recent Note - 4/24/2023 7:03:28 PM
Y - Color code is changed to yellow with new pivot point cited based on its 3/23/23 high plus 10 cents. Subsequent gains above the pivot point backed by at least +40% above average volume may trigger a new (or add-on) technical buy signal. Currently consolidating in an orderly fashion above its 50 DMA line ($153.16) which defines important support to watch above prior highs in the $148-145 area.
>>> FEATURED STOCK ARTICLE : Near High With Volume Cooling Following Volume-Driven Gains - 4/17/2023 |
View all notes |
Set NEW NOTE alert |
Company Profile |
SEC
News |
Chart |
Request a new note
C
A
S
I |
CLH
-
NYSE
Clean Harbors
Pollution Control
|
$142.22
|
-2.05
-1.42% |
$144.18
|
176,963
41.44% of 50 DAV
50 DAV is 427,000
|
$146.05
-2.62%
|
3/10/2023
|
$136.89
|
PP = $136.74
|
|
MB = $143.58
|
Most Recent Note - 4/24/2023 7:06:52 PM
G - Posted a small gain today with below-average volume matching its best-ever close. Recently wedging up above its "max buy" level with gains backed by lackluster volume, not action considered indicative of fresh institutional buying demand. Found prompt support near its 50 DMA line ($136.49) during recent consolidations. Fundamentals remain strong.
>>> FEATURED STOCK ARTICLE : Wedged to a New High Close Above "Max Buy" Level - 4/19/2023 |
View all notes |
Set NEW NOTE alert |
Company Profile |
SEC
News |
Chart |
Request a new note
C
A
S
I |
MTRN
-
NYSE
Materion
METALS and MINING - Industrial Metals and Minerals
|
$107.82
|
-3.87
-3.46% |
$110.21
|
52,782
41.89% of 50 DAV
50 DAV is 126,000
|
$119.75
-9.96%
|
4/18/2023
|
$114.52
|
PP = $118.30
|
|
MB = $124.22
|
Most Recent Note - 4/25/2023 1:34:25 PM
G - Color code is changed to green after slumping below its 50 DMA line ($109.75) with today's loss on light volume. Encountered distributional pressure when poised to break out. A prompt rebound above the 50 DMA line is needed for its outlook to improve. Subsequent gains and a strong close above the pivot point backed by at least +40% above average volume may trigger a proper technical buy signal. Due to report Mar '23 quarterly results on 5/03/23. Volume and volatility often increase near earnings news.
>>> FEATURED STOCK ARTICLE : Encountered Distributional Pressure When Poised for Breakout - 4/18/2023 |
View all notes |
Set NEW NOTE alert |
Company Profile |
SEC
News |
Chart |
Request a new note
C
A
S
I |
SPSC
-
NASDAQ
SPS Commerce
COMPUTER SOFTWARE and SERVICES - Application Software
|
$141.48
|
-9.40
-6.23% |
$149.23
|
140,101
88.11% of 50 DAV
50 DAV is 159,000
|
$157.46
-10.15%
|
4/24/2023
|
$150.01
|
PP = $157.56
|
|
MB = $165.44
|
Most Recent Note - 4/25/2023 1:31:16 PM
G - Slumping well below its 50 DMA line ($148.68) with today's big loss raising concerns and its color code is changed to green. Highlighted in yellow with new pivot point cited based on its 2/15/23 high plus 10 cents in the 4/24/23 mid-day report. A prompt rebound above its 50 DMA line ($148.68) is needed for its outlook to improve. Subsequent gains above the pivot point backed by at least +40% above average volume may trigger a technical buy signal. Due to report Mar '23 quarterly results. Volume and volatility often increase near earnings news. See the latest FSU analysis for more details and an annotated graph.
>>> FEATURED STOCK ARTICLE : Sputtered While Perched in Striking Distance of 52-Week HIgh - 4/24/2023 |
View all notes |
Set NEW NOTE alert |
Company Profile |
SEC
News |
Chart |
Request a new note
C
A
S
I |
Symbol/Exchange
Company Name
Industry Group |
PRICE |
CHANGE
(%Change) |
Day High |
Volume
(% DAV)
(% 50 day avg vol) |
52 Wk Hi
% From Hi |
Featured
Date |
Price
Featured |
Pivot Featured |
|
Max Buy |
HUBB
-
NYSE
Hubbell
Electrical-Power/Equipmt
|
$259.41
|
+27.02
11.63% |
$265.50
|
1,673,516
467.46% of 50 DAV
50 DAV is 358,000
|
$263.30
-1.48%
|
4/25/2023
|
$262.85
|
PP = $257.51
|
|
MB = $270.39
|
Most Recent Note - 4/25/2023 6:14:08 PM
Y - Closed above the pivot point today with a gain backed by +367% triggering a technical buy signal. Highlighted in yellow in the earlier mid-day report with pivot point cited based on its 3/06/23 high after a 4-month double bottom base. Gapped up rebounding above its 50 DMA line ($240) with a considerable volume-driven gain hitting a new 52-week high. Reported strong Mar '23 quarterly earnings +70% over the year-ago period. Its Mar, Jun, Sep, and Dec '22 quarterly earnings increases were above the +25% minimum (C criteria). Annual earnings history (A criteria) had a downturn in FY '20 like many companies during the pandemic. See the latest FSU analysis fo more details and a new annotated graph.
>>> FEATURED STOCK ARTICLE : Gap Up Following Earnings Triggered Technical Buy Signal - 4/25/2023 |
View all notes |
Set NEW NOTE alert |
Company Profile |
SEC
News |
Chart |
Request a new note
C
A
S
I |
NVR
-
NYSE
NVR Inc
MATERIALS and CONSTRUCTION - Residential Construction
|
$5,754.71
|
-212.51
-3.56% |
$5,980.01
|
41,108
186.85% of 50 DAV
50 DAV is 22,000
|
$5,986.96
-3.88%
|
4/25/2023
|
$5,882.18
|
PP = $5,978.25
|
|
MB = $6,277.16
|
Most Recent Note - 4/25/2023 1:06:40 PM
Y - Color code is changed to yellow with pivot point cited based on its 12/30/21 high plus 10 cents. Pulling back today after rallying to touch a new all-time high. Confirming gains and a close above the pivot point backed by at least +40% above average volume may clinch a proper technical buy signal. Due to report Mar '23 quarterly earnings. Reported earnings +50% on +23% sales revenues for the Dec '22 quarter versus the year-ago period, and prior quarterly comparisons were above the +25% minimum earnings guideline (C criteria). Annual earnings (A criteria) growth has been very strong.
There are no Featured Stock Updates™ available for this stock at this time. You may request one by clicking the Request a New Note link below |
View all notes |
Set NEW NOTE alert |
Company Profile |
SEC
News |
Chart |
Request a new note
C
A
S
I |
PHM
-
NYSE
PulteGroup
MATERIALS and CONSTRUCTION - Residential Construction
|
$64.95
|
+1.09
1.71% |
$66.08
|
6,768,340
249.66% of 50 DAV
50 DAV is 2,711,000
|
$64.49
0.71%
|
2/1/2005
|
$65.17
|
PP = $64.01
|
|
MB = $67.21
|
Most Recent Note - 4/25/2023 1:14:20 PM
Y - Color code is changed to yellow with pivot point cited based on its May 2021 high. Gapped up today hitting a new all-time high with a 4th consecutive volume-driven gain and no resistance due to overhead supply. Reported earnings +28% for the Mar '23 quarter versus the year-ago period. This Building - Residential/Commercial firm has posted 13 strong quarterly comparisons above the +25% minimum earnings guideline (C criteria). Annual earnings (A criteria) history has been strong.
There are no Featured Stock Updates™ available for this stock at this time. You may request one by clicking the Request a New Note link below |
View all notes |
Set NEW NOTE alert |
Company Profile |
SEC
News |
Chart |
Request a new note
C
A
S
I |
|
|
|
THESE ARE NOT BUY RECOMMENDATIONS!
Comments contained in the body of this report are technical
opinions only. The material herein has been obtained
from sources believed to be reliable and accurate, however,
its accuracy and completeness cannot be guaranteed.
This site is not an investment advisor, hence it does
not endorse or recommend any securities or other investments.
Any recommendation contained in this report may not
be suitable for all investors and it is not to be deemed
an offer or solicitation on our part with respect to
the purchase or sale of any securities. All trademarks,
service marks and trade names appearing in this report
are the property of their respective owners, and are
likewise used for identification purposes only.
This report is a service available
only to active Paid Premium Members.
You may opt-out of receiving report notifications
at any time. Questions or comments may be submitted
by writing to Premium Membership Services 665 S.E. 10 Street, Suite 201 Deerfield Beach, FL 33441-5634 or by calling 1-800-965-8307
or 954-785-1121.
|
|
|