You are not logged in.
This means you
CAN ONLY VIEW reports that were published prior to Monday, March 24, 2025.
You
MUST UPGRADE YOUR MEMBERSHIP if you want to see any current reports.
AFTER MARKET UPDATE - WEDNESDAY, FEBRUARY 28TH, 2024
Previous After Market Report Next After Market Report >>>
|
|
|
|
DOW |
-23.39 |
38,949.02 |
-0.06% |
|
Volume |
895,056,292 |
-2% |
|
Volume |
5,603,271,000 |
+2% |
|
NASDAQ |
-87.56 |
15,947.74 |
-0.55% |
|
Advancers |
1,253 |
45% |
|
Advancers |
1,587 |
37% |
|
S&P 500 |
-8.42 |
5,069.76 |
-0.17% |
|
Decliners |
1,519 |
55% |
|
Decliners |
2,693 |
63% |
|
Russell 2000 |
-15.80 |
2,040.31 |
-0.77% |
|
52 Wk Highs |
154 |
|
|
52 Wk Highs |
173 |
|
|
S&P 600 |
-9.40 |
1,296.76 |
-0.72% |
|
52 Wk Lows |
31 |
|
|
52 Wk Lows |
97 |
|
|
 |
Major Indices Showed Little Conviction and Ended Slightly Lower
Kenneth J. Gruneisen - Passed the CAN SLIM® Master's Exam
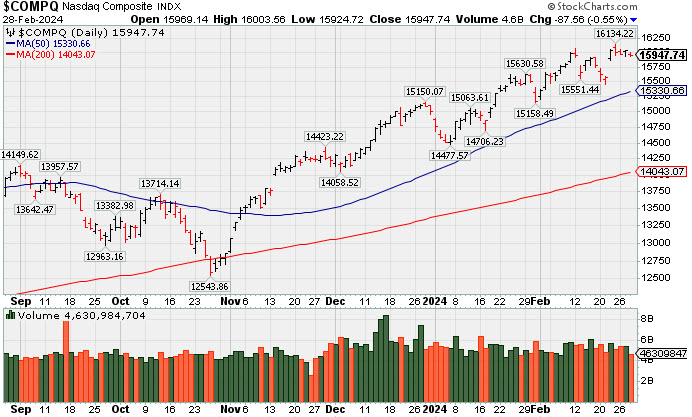
The S&P 500 moved only 21 points between its intraday high and low, ultimately settling with a -0.2% decline. Volume was reported mixed, lighter than the prior session total on the NYSE and higher on the Nasdaq exchange. Decliners led advancers by an 8-7 margin on the NYSE and by a 3-2 margin on the Nasdaq exchange. There were 101 high-ranked companies from the Leaders List that hit new 52-week highs and were listed on the BreakOuts Page, versus the total of 101 on the prior session. New 52-week highs totals solidly outnumbered new 52-week lows totals on the NYSE and on the Nasdaq exchange. The major indices are in a confirmed uptrend (M criteria). New buying efforts should be only made in stocks fitting all key criteria of the fact-based investment system.
PICTURED: The Nasdaq Composite Index pulled back, quietly consolidating near its 2024 high.
The real estate sector posted a standout gain of +1.2%, and the communication services sector led decliners with a -0.9% loss. The PHLX Semiconductor Index (SOX) slipped -1.1%. NVIDIA (NVDA -1.32%), Broadcom (AVGO -0.53%), and Applied Materials (AMAT -2.62%) lost ground. AMAT traded down after disclosing it received multiple subpoenas from government authorities requesting information relating to certain China customer shipments.
Treasury yields settled lower today as the 2-yr note yield fell four basis points to 4.67% and the 10-yr note yield fell four basis points to 4.27%.
|
 Kenneth J. Gruneisen started out as a licensed stockbroker in August 1987, a couple of months prior to the historic stock market crash that took the Dow Jones Industrial Average down -22.6% in a single day. He has published daily fact-based fundamental and technical analysis on high-ranked stocks online for two decades. Through FACTBASEDINVESTING.COM, Kenneth provides educational articles, news, market commentary, and other information regarding proven investment systems that work in good times and bad.
Comments contained in the body of this report are technical opinions only and are not necessarily those of Gruneisen Growth Corp. The material herein has been obtained from sources believed to be reliable and accurate, however, its accuracy and completeness cannot be guaranteed. Our firm, employees, and customers may effect transactions, including transactions contrary to any recommendation herein, or have positions in the securities mentioned herein or options with respect thereto. Any recommendation contained in this report may not be suitable for all investors and it is not to be deemed an offer or solicitation on our part with respect to the purchase or sale of any securities. |
|
 |
Retail Index Edged Higher on Widely Negative Session
Kenneth J. Gruneisen - Passed the CAN SLIM® Master's Exam
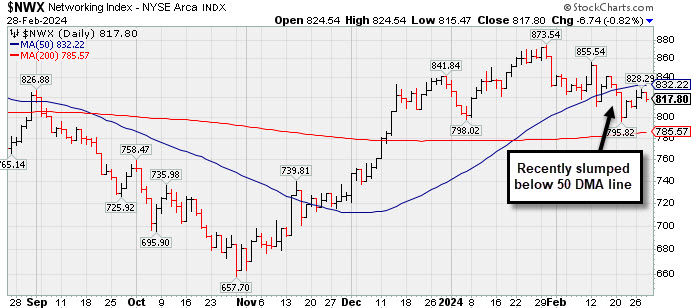
The Broker/Dealer Index ($XBD -0.02%) finished flat and the Bank Index ($BKX -0.21%) edged lower while the Retail Index ($RLX +0.21%) inched higher. The tech sector had a negative bias as the Semiconductor Index ($SOX -1.12%), Networking Index ($NWX -0.82%), and the Biotech Index ($BTK -0.81%) each ended slightly lower. Commodity-linked groups also had a negative bias as the Gold & Silver Index ($XAU -1.39%), Integrated Oil Index ($XOI -0.67%), and the Oil Services Index ($OSX -0.59%) each ended lower.
![]() PICTURED: The Networking Index ($NWX -0.82%) ended lower, and it recently has sputtered below its 50-day moving average (DMA) line.
| Oil Services |
$OSX |
80.40 |
-0.48 |
-0.59% |
-4.15% |
| Integrated Oil |
$XOI |
1,924.21 |
-12.98 |
-0.67% |
+3.32% |
| Semiconductor |
$SOX |
4,602.60 |
-52.29 |
-1.12% |
+10.23% |
| Networking |
$NWX |
817.80 |
-6.74 |
-0.82% |
-1.80% |
| Broker/Dealer |
$XBD |
571.65 |
-0.14 |
-0.02% |
+2.58% |
| Retail |
$RLX |
4,357.86 |
+9.28 |
+0.21% |
+12.06% |
| Gold & Silver |
$XAU |
102.94 |
-1.45 |
-1.39% |
-18.10% |
| Bank |
$BKX |
95.91 |
-0.20 |
-0.21% |
-0.12% |
| Biotech |
$BTK |
5,234.02 |
-42.94 |
-0.81% |
-3.41% |
|
|
|
 |
Inched to New Highs With Average Volume
Kenneth J. Gruneisen - Passed the CAN SLIM® Master's Exam
Hubbell (HUBB+$4.55 or +1.24% to $370.82) posted a small gain today with average volume for a new all-time high, getting more extended from the previously noted base. The prior high ($340) along with its 50-day moving average (DMA) line ($339.15) define important near-term support to watch on pullbacks.
HUBB was highlighted yellow in the earlier mid-day report (read here) with pivot point cited based on its 1/22/24 high as it rose from a cup-with-handle base. It was last shown in great detail in this FSU section on 1/30/24 with an annotated graph under the headline "Volume Heavy Behind Breakout Gain for Hubbell". Quarterly earnings increases have been above the +25% minimum (C criteria). Annual earnings history (A criteria) had a downturn in FY '20 like many companies during the pandemic. It has a 94 Earnings Per Share Rating, well above the 80+ minimum for buy candidates.The high-ranked Electrical-Power/Equipmt firm has 53.6 million shares outstanding (S criteria) which can contribute to greater price volatility in the event of institutional buying or selling. The number of top-rated funds owning its shares rose from 805 in Jun '22 to 1,727 in Dec '23, a reassuring sign concerning the I criteria. The current Up/Down Volume Ratio of 1.3 is an unbiased indication it has been under slight accumulation over the past 50 days. It has an A Timeliness Rating and a B Sponsorship Rating.
Chart courtesy of www.stockcharts.com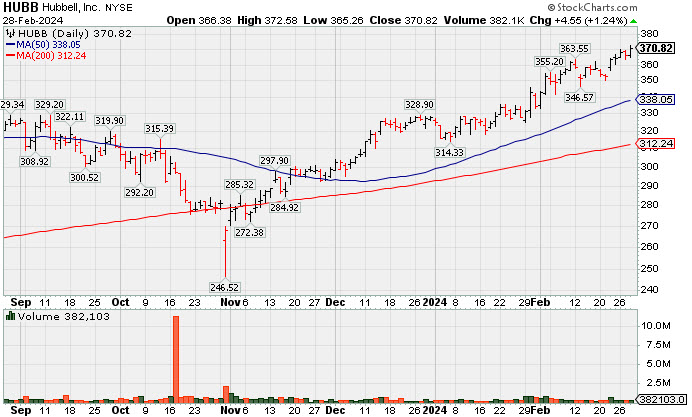 Symbol/Exchange
Company Name
Industry Group | PRICE | CHANGE
(%Change) | Day High | Volume
(% DAV)
(% 50 day avg vol) | 52 Wk Hi
% From Hi | Featured
Date | Price
Featured | Pivot Featured | | Max Buy |  ANET - NYSE ANET - NYSE
Arista Networks
Computer-Networking | $273.17 | +1.26
0.46% | $275.54 | 1,162,751
53.02% of 50 DAV
50 DAV is 2,193,000 | $292.66
-6.66%
| 10/31/2023 | $188.84 | PP = $198.80 | | MB = $208.74 | Most Recent Note - 2/22/2024 5:56:51 PM
G - Posted a solid volume-driven gain today. Extended from any sound base. Its 50 DMA line ($252) defines important near-term support to watch on pullbacks.
>>> FEATURED STOCK ARTICLE : Pulled Back From All Time High With Gap Down on Prior Session - 2/1/2024 | View all notes | Set NEW NOTE alert | Company Profile | SEC News | Chart | Request a new note C A S I | NVO - NYSE
Novo Nordisk ADR
Medical-Ethical Drugs | $121.54 | -0.69
-0.56% | $122.15 | 2,930,983
63.06% of 50 DAV
50 DAV is 4,648,000 | $124.87
-2.67%
| 11/2/2023 | $100.97 | PP = $104.10 | | MB = $109.31 | Most Recent Note - 2/27/2024 12:25:23 PM
G - Perched near its all-time high, extended from any sound base. Its 50 DMA line ($110.58) defines important near-term support to watch on pullbacks.
>>> FEATURED STOCK ARTICLE : Extended From Any Sound Base After Volume-Driven Gains - 2/8/2024 | View all notes | Set NEW NOTE alert | Company Profile | SEC News | Chart | Request a new note C A S I | AXON - NASDAQ
Axon Enterprise
Security/Sfty | $309.43 | +37.61
13.84% | $318.90 | 2,567,031
679.11% of 50 DAV
50 DAV is 378,000 | $274.78
12.61%
| 11/8/2023 | $127.84 | PP = $223.30 | | MB = $234.47 |  Most Recent Note - 2/28/2024 12:11:03 PM Most Recent Note - 2/28/2024 12:11:03 PM
G - extended from any sound base and hitting new all-time highs with today's big volume-driven gain. Bullish action came after it reported Dec '23 quarterly earnings +60% on +29% sales revenues versus the year-ago period. Volume and volatility often increase near earnings news. Prior highs in the $260-262 area define initial support to watch above its 50-day moving average (DMA) line ($259).
>>> FEATURED STOCK ARTICLE : Reversal at All-Time High After 7 Consecutive Gains - 2/12/2024 | View all notes | Set NEW NOTE alert | Company Profile | SEC News | Chart | Request a new note C A S I | TDG - NYSE
TransDigm Group
Aerospace/Defense | $1,172.00 | -2.22
-0.19% | $1,177.10 | 263,236
123.01% of 50 DAV
50 DAV is 214,000 | $1,207.58
-2.95%
| 12/12/2023 | $1,000.39 | PP = $1,013.18 | | MB = $1,063.84 | Most Recent Note - 2/27/2024 11:30:31 AM
G - Pulling back today with below-average volume for a 2nd loss off of its all-time high. Its 50 DMA line ($1,068) defines near-term support to watch.
>>> FEATURED STOCK ARTICLE : Transdigm Perched Near All-Time High - 2/14/2024 | View all notes | Set NEW NOTE alert | Company Profile | SEC News | Chart | Request a new note C A S I | TBBK - NASDAQ
The Bancorp
Banks-Northeast | $44.65 | -0.38
-0.84% | $45.20 | 287,632
64.93% of 50 DAV
50 DAV is 443,000 | $47.11
-5.22%
| 1/22/2024 | $40.87 | PP = $42.56 | | MB = $44.69 | Most Recent Note - 2/27/2024 6:19:45 PM
G - Color code was changed to green after wedging above its "max buy" level with today''s 3rd consecutive gain backed by below-average volume. Prior highs in the $42 area and its 50 DMA line ($41.28) define near-term support to watch. Fundamentals remain strong. See the latest FSU analysis for more details and a new annotated graph.
>>> FEATURED STOCK ARTICLE : Wedging Above "Max Buy" Level With Gains Lacking Great Volume - 2/27/2024 | View all notes | Set NEW NOTE alert | Company Profile | SEC News | Chart | Request a new note C A S I | Symbol/Exchange
Company Name
Industry Group | PRICE | CHANGE
(%Change) | Day High | Volume
(% DAV)
(% 50 day avg vol) | 52 Wk Hi
% From Hi | Featured
Date | Price
Featured | Pivot Featured | | Max Buy | LULU - NASDAQ
lululemon athletica
Retail-Apparel/Shoes/Acc | $464.14 | -3.70
-0.79% | $474.17 | 888,307
71.64% of 50 DAV
50 DAV is 1,240,000 | $516.39
-10.12%
| 12/8/2023 | $490.61 | PP = $485.93 | | MB = $510.23 | Most Recent Note - 2/22/2024 6:03:00 PM
G - Posted a gain today with below-average volume. Still lingering below its 50 DMA line ($481) which is now downward sloping and may act as resistance. A rebound above the 50 DMA line is needed to help its outlook improve.
>>> FEATURED STOCK ARTICLE : Violation of 50-Day Moving Average Hurt Outlook - 2/2/2024 | View all notes | Set NEW NOTE alert | Company Profile | SEC News | Chart | Request a new note C A S I | CRWD - NASDAQ
CrowdStrike Holdings
Computer Sftwr-Security | $320.85 | -0.36
-0.11% | $321.69 | 2,064,410
63.42% of 50 DAV
50 DAV is 3,255,000 | $338.45
-5.20%
| 1/2/2024 | $246.42 | PP = $261.91 | | MB = $275.01 | Most Recent Note - 2/26/2024 5:08:30 PM
G - Posted a 3rd consecutive volume-driven gain today. Showing strength after testing support near its 50 DMA line ($286.85). Fundamentals remain strong.
>>> FEATURED STOCK ARTICLE : Volume Totals Cooking While Stubbornly Perched at All-Time High - 2/6/2024 | View all notes | Set NEW NOTE alert | Company Profile | SEC News | Chart | Request a new note C A S I | ELF - NYSE
e.l.f. Beauty
Cosmetics/Personal Care | $204.75 | +2.75
1.36% | $206.60 | 1,265,065
85.59% of 50 DAV
50 DAV is 1,478,000 | $204.72
0.01%
| 1/2/2024 | $138.23 | PP = $153.63 | | MB = $161.31 | Most Recent Note - 2/26/2024 5:09:29 PM
G - Posted a 4th consecutive gain today for yet another new all-time high. Reported Dec '23 quarterly earnings +54% on +85% sales revenues versus the year-ago period, continuing its strong earnings track record. Its 50 DMA line ($158) defines important near-term support to watch.
>>> FEATURED STOCK ARTICLE : Peched at All-Time High With Earnings News Due - 2/5/2024 | View all notes | Set NEW NOTE alert | Company Profile | SEC News | Chart | Request a new note C A S I | KOF - NYSE
Coca-Cola Femsa ADR
Beverages-Non-Alcoholic | $96.67 | -3.23
-3.23% | $99.82 | 194,957
119.61% of 50 DAV
50 DAV is 163,000 | $104.38
-7.39%
| 1/12/2024 | $93.38 | PP = $99.34 | | MB = $104.31 | Most Recent Note - 2/23/2024 5:22:14 PM
Y - Sputtering after a noted "negative reversal" at its all-time high. Reported Dec ''23 quarterly earnings -13% on +24% sales revenues versus the year-ago period. Volume and volatility often increase near earnings news. Its 50 DMA line ($94.83) defines important near-term support to watch on pullbacks.
>>> FEATURED STOCK ARTICLE : Perched at High With Earnings News Due - 2/21/2024 | View all notes | Set NEW NOTE alert | Company Profile | SEC News | Chart | Request a new note C A S I | PCAR - NASDAQ
Paccar
Trucks and Parts-Hvy Duty | $111.37 | +0.04
0.04% | $112.05 | 1,631,763
73.14% of 50 DAV
50 DAV is 2,231,000 | $112.68
-1.16%
| 1/23/2024 | $100.35 | PP = $98.57 | | MB = $103.50 | Most Recent Note - 2/26/2024 5:06:25 PM
G - Hit another new all-time high with today''s 4th consecutive gain backed by below-average volume, getting more extended from any sound base. Its 50 DMA line ($100) defines near-term support to watch on pullbacks. Fundamentals remain strong. See the latest FSU analysis for more details and a new annotated graph.
>>> FEATURED STOCK ARTICLE : Extended From Any Sound Base After 7 Weekly Gains - 2/26/2024 | View all notes | Set NEW NOTE alert | Company Profile | SEC News | Chart | Request a new note C A S I | Symbol/Exchange
Company Name
Industry Group | PRICE | CHANGE
(%Change) | Day High | Volume
(% DAV)
(% 50 day avg vol) | 52 Wk Hi
% From Hi | Featured
Date | Price
Featured | Pivot Featured | | Max Buy | HUBB - NYSE
Hubbell
Electrical-Power/Equipmt | $370.82 | +4.55
1.24% | $372.59 | 382,391
98.05% of 50 DAV
50 DAV is 390,000 | $371.50
-0.18%
| 1/30/2024 | $343.26 | PP = $336.83 | | MB = $353.67 | Most Recent Note - 2/28/2024 4:56:23 PM
G - Posted a small gain with average volume for another new all-time high, getting more extended from the previously noted base. Prior high ($340) and its 50 DMA line define important support to watch on pullbacks. See the latest FSU analysis for more details and a new annotated graph.
>>> FEATURED STOCK ARTICLE : Inched to New Highs With Average Volume - 2/28/2024 | View all notes | Set NEW NOTE alert | Company Profile | SEC News | Chart | Request a new note C A S I | MANH - NASDAQ
Manhattan Associates
Computer Sftwr-Enterprse | $253.93 | +3.46
1.38% | $254.47 | 442,536
113.47% of 50 DAV
50 DAV is 390,000 | $258.91
-1.92%
| 1/31/2024 | $240.57 | PP = $230.71 | | MB = $242.25 | Most Recent Note - 2/27/2024 11:27:26 AM
G - Perched near its all-time high with light volume behind today''s 4th consecutive small gain. Prior highs in the $230 area define near-term support to watch on pullbacks.
>>> FEATURED STOCK ARTICLE : Big Volume Behind Breakout Gain - 1/31/2024 | View all notes | Set NEW NOTE alert | Company Profile | SEC News | Chart | Request a new note C A S I | TENB - NASDAQ
Tenable Holdings
Computer Sftwr-Security | $47.21 | -0.18
-0.38% | $47.29 | 764,715
73.36% of 50 DAV
50 DAV is 1,042,400 | $53.50
-11.76%
| 2/7/2024 | $49.50 | PP = $49.87 | | MB = $52.36 | Most Recent Note - 2/27/2024 11:32:02 AM
G - Its Relative Strength rating has slumped to 71, well below the 80+ minimum guideline for buy candidates. Finding support recently above the 50 DMA line ($47.14). Fundamentals remain strong.
>>> FEATURED STOCK ARTICLE : Gap Up Gain Followed Latest Earnings Report - 2/7/2024 | View all notes | Set NEW NOTE alert | Company Profile | SEC News | Chart | Request a new note C A S I | USLM - NASDAQ
U.S. Lime & Minerals
Bldg-Cement/Concrt/Ag | $253.50 | -1.48
-0.58% | $255.99 | 9,614
53.41% of 50 DAV
50 DAV is 18,000 | $266.88
-5.01%
| 2/9/2024 | $254.68 | PP = $265.09 | | MB = $278.34 | Most Recent Note - 2/27/2024 11:28:38 AM
Y - Perched near its all-time high with volume totals cooling. Subsequent gains and a close above the pivot point backed by at least +40% above average volume may trigger a conviciing new technical buy signal. Through Dec ''23 its quarterly and annual earnings (C and A criteria) history has been strong, a good match with the fact-based investment system''s guidelines. Thinly traded firm has only 5.7 million shares outstanding (S criteria), which can contribute to greater price volatility in the event of institutional buying or selling.
>>> FEATURED STOCK ARTICLE : Strong Finish for Thinly Traded U.S Lime & Minerals - 2/9/2024 | View all notes | Set NEW NOTE alert | Company Profile | SEC News | Chart | Request a new note C A S I | NOW - NYSE
ServiceNow
Computer Sftwr-Enterprse | $759.79 | -7.35
-0.96% | $763.73 | 1,260,237
104.58% of 50 DAV
50 DAV is 1,205,000 | $815.32
-6.81%
| 2/22/2024 | $771.75 | PP = $815.32 | | MB = $856.09 | Most Recent Note - 2/23/2024 5:17:22 PM
Y - Color code was changed to yellow as it was noted that a valid secondary buy point exists up to +5% above the latest high after finding support at its 10 WMA line following an earlier breakout. Reported Dec '23 quarterly earnings +36% on +26% sales revenues versus the year-ago period, its 6th quarterly comparison above the +25% minimum guideline (C criteria) of the fact-based investment system. See the latest FSU analysis for more details and a new annotated graph.
>>> FEATURED STOCK ARTICLE : Found Support With a Solid Gap Up from 10-Week Moving Average - 2/23/2024 | View all notes | Set NEW NOTE alert | Company Profile | SEC News | Chart | Request a new note C A S I | Symbol/Exchange
Company Name
Industry Group | PRICE | CHANGE
(%Change) | Day High | Volume
(% DAV)
(% 50 day avg vol) | 52 Wk Hi
% From Hi | Featured
Date | Price
Featured | Pivot Featured | | Max Buy | SNPS - NASDAQ
Synopsys
Computer Sftwr-Design | $570.28 | -3.72
-0.65% | $572.79 | 576,751
39.15% of 50 DAV
50 DAV is 1,473,000 | $629.38
-9.39%
| 2/22/2024 | $600.65 | PP = $582.85 | | MB = $611.99 | Most Recent Note - 2/22/2024 5:55:08 PM
Y - Gapped up and hit a new all-time high today but encountered distributional pressure and ended near the session low, closing below the pivot point cited based on its 2/09/24 high after a cup-with-handle base. A strong close above the pivot point is needed to clinch a proper technical buy signal. Found support recently at its 50 DMA line ($536). Reported Jan '24 quarterly earnings +36% on +21% sales revenues versus the year-ago period, its 3rd strong quarter above the +25% minimum earnings guideline (C criteria). Annual earnings growth (A criteria) has been strong and steady. See the latest FSU analysis for more details and a new annotated graph.
>>> FEATURED STOCK ARTICLE : Gapped Up for New High But Ended Near Session Low - 2/22/2024 | View all notes | Set NEW NOTE alert | Company Profile | SEC News | Chart | Request a new note C A S I |
|
|
|
Color Codes Explained :
Y - Better candidates highlighted by our
staff of experts.
G - Previously featured
in past reports as yellow but may no longer be buyable under the
guidelines.
***Last / Change / Volume data in this table is the closing quote data***
|
|
|
THESE ARE NOT BUY RECOMMENDATIONS!
Comments contained in the body of this report are technical
opinions only. The material herein has been obtained
from sources believed to be reliable and accurate, however,
its accuracy and completeness cannot be guaranteed.
This site is not an investment advisor, hence it does
not endorse or recommend any securities or other investments.
Any recommendation contained in this report may not
be suitable for all investors and it is not to be deemed
an offer or solicitation on our part with respect to
the purchase or sale of any securities. All trademarks,
service marks and trade names appearing in this report
are the property of their respective owners, and are
likewise used for identification purposes only.
This report is a service available
only to active Paid Premium Members.
You may opt-out of receiving report notifications
at any time. Questions or comments may be submitted
by writing to Premium Membership Services 665 S.E. 10 Street, Suite 201 Deerfield Beach, FL 33441-5634 or by calling 1-800-965-8307
or 954-785-1121.
|
|
|