You are not logged in.
This means you
CAN ONLY VIEW reports that were published prior to Tuesday, March 25, 2025.
You
MUST UPGRADE YOUR MEMBERSHIP if you want to see any current reports.
AFTER MARKET UPDATE - TUESDAY, JANUARY 30TH, 2024
Previous After Market Report Next After Market Report >>>
|
|
|
|
DOW |
+133.86 |
38,467.31 |
+0.35% |
|
Volume |
852,136,434 |
-1% |
|
Volume |
4,771,150,900 |
-6% |
|
NASDAQ |
-118.15 |
15,509.90 |
-0.76% |
|
Advancers |
1,339 |
48% |
|
Advancers |
1,536 |
36% |
|
S&P 500 |
-2.96 |
4,924.97 |
-0.06% |
|
Decliners |
1,435 |
52% |
|
Decliners |
2,715 |
64% |
|
Russell 2000 |
-15.19 |
1,996.24 |
-0.76% |
|
52 Wk Highs |
187 |
|
|
52 Wk Highs |
207 |
|
|
S&P 600 |
-6.02 |
1,298.63 |
-0.46% |
|
52 Wk Lows |
17 |
|
|
52 Wk Lows |
98 |
|
|
 |
Leadership Improved Yet Major Indices Ended Mixed
Kenneth J. Gruneisen - Passed the CAN SLIM® Master's Exam
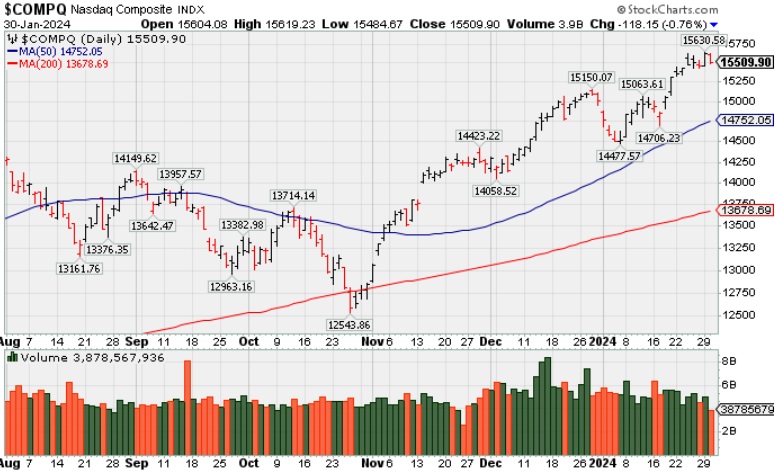
The Dow Jones Industrial Average closed with a 0.4% gain while the S&P 500 (-0.1%) and Nasdaq Composite (-0.8%) closed with losses. Volume was reported lighter than the prior session total on the NYSE and on the Nasdaq exchange. Breadth was negative as decliners led advancers by a narrow margin on the NYSE and by more than a 5-3 margin on the Nasdaq exchange. There were 107 high-ranked companies from the Leaders List that hit new 52-week highs and were listed on the BreakOuts Page versus 83 on the prior session. New 52-week highs totals outnumbered new lows on the NYSE and on the Nasdaq exchange. The major indices are in a confirmed uptrend (M criteria). New buying efforts should be only made in stocks fitting all key criteria of the fact-based investment system.
PICTURED: The Nasdaq Composite Index is hovering near multi-year highs. It remains -4.3% off its Nov 2021 all-time high.
General Motors (GM +7.80%) and HCA Healthcare (HCA +5.18%) both logged big gains following pleasing earnings and/or guidance while shares of UPS (UPS -8.20%) and Whirlpool (WHR -6.60%) both fell following their results.
The January Consumer Confidence Index climbed to 114.8 in January from a downwardly revised 108.0 (from 110.7) in December. Meanwhile, the JOLTS Report showed 9.026 million job openings in December, up from 8.925 million in November.
The Treasury market saw mixed action as the 2-yr note yield settlied at 4.36% and the 10-yr note yield settled at 4.06%.
|
 Kenneth J. Gruneisen started out as a licensed stockbroker in August 1987, a couple of months prior to the historic stock market crash that took the Dow Jones Industrial Average down -22.6% in a single day. He has published daily fact-based fundamental and technical analysis on high-ranked stocks online for two decades. Through FACTBASEDINVESTING.COM, Kenneth provides educational articles, news, market commentary, and other information regarding proven investment systems that work in good times and bad.
Comments contained in the body of this report are technical opinions only and are not necessarily those of Gruneisen Growth Corp. The material herein has been obtained from sources believed to be reliable and accurate, however, its accuracy and completeness cannot be guaranteed. Our firm, employees, and customers may effect transactions, including transactions contrary to any recommendation herein, or have positions in the securities mentioned herein or options with respect thereto. Any recommendation contained in this report may not be suitable for all investors and it is not to be deemed an offer or solicitation on our part with respect to the purchase or sale of any securities. |
|
 |
Bank Index and Integrated Oil Indexes Posted Standout Gains
Kenneth J. Gruneisen - Passed the CAN SLIM® Master's Exam
The Retail Index ($RLX -0.68%) finished lower and the Broker/Dealer Index ($XBD -0.36%) also edged lower while the Bank Index ($BKX +0.92%) posted a solid gain. The tech sector had a negative bias as the Semiconductor Index ($SOX -1.56%), Biotech Index ($BTK -0.90%) and the Networking Index ($NWX -1.03%) posted unanimous losses. The Gold & Silver Index ($XAU -0.83%) fell while the Oil Services Index ($OSX -1.92%) slumped for a larger loss and the Integrated Oil Index ($XOI +1.91%) posted a solid gain.
Chart courtesy of www.stockcharts.com
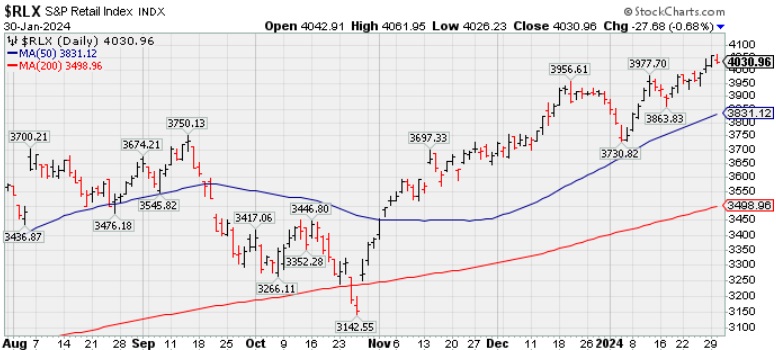
![]() PICTURED: The Retail Index ($RLX -0.68%) pulled back after 3 consecutive gains.
| Oil Services |
$OSX |
82.60 |
-1.62 |
-1.92% |
-1.52% |
| Integrated Oil |
$XOI |
1,906.62 |
+35.71 |
+1.91% |
+2.37% |
| Semiconductor |
$SOX |
4,319.99 |
-68.28 |
-1.56% |
+3.46% |
| Networking |
$NWX |
862.48 |
-8.94 |
-1.03% |
+3.56% |
| Broker/Dealer |
$XBD |
550.77 |
-1.98 |
-0.36% |
-1.17% |
| Retail |
$RLX |
4,030.96 |
-27.68 |
-0.68% |
+3.66% |
| Gold & Silver |
$XAU |
114.19 |
-0.95 |
-0.83% |
-9.15% |
| Bank |
$BKX |
98.00 |
+0.90 |
+0.92% |
+2.07% |
| Biotech |
$BTK |
5,200.42 |
-47.23 |
-0.90% |
-4.03% |
|
|
|
 |
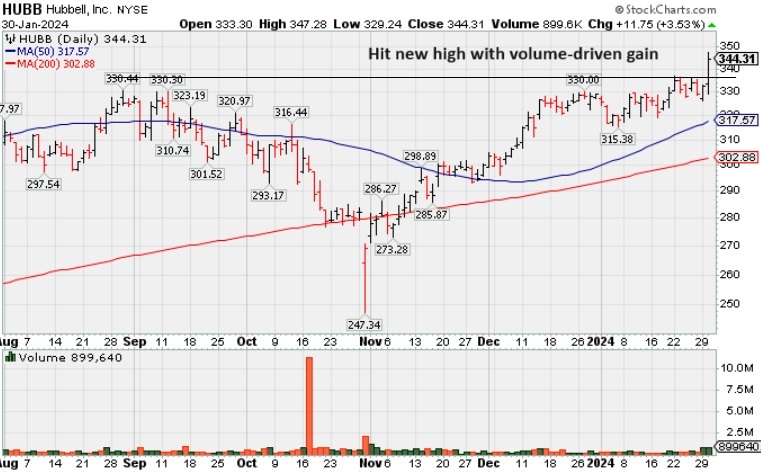
Volume Heavy Behind Breakout Gain for Hubbell
Kenneth J. Gruneisen - Passed the CAN SLIM® Master's Exam
Hubbell (HUBB +$11.75 or +3.53% to $344.31) hit a new high with today's big gain backed by +139% above average volume triggering a technical buy signal. Fundamentals remain strong after Dec '23 earnings rose +42% on +10% sales revenues versus the year-ago period.
HUBB was highlighted yellow in the earlier mid-day report (read here) with pivot point cited based on its 1/22/24 high as it rose from a cup-with-handle base. It was last shown in great detail in this FSU section on 8/24/23 with an annotated graph under the headline "Rebounded Near 50-Day Moving Average Line". Quarterly earnings increases have been above the +25% minimum (C criteria). Annual earnings history (A criteria) had a downturn in FY '20 like many companies during the pandemic. It has a 93 Earnings Per Share Rating, well above the 80+ minimum for buy candidates.The high-ranked Electrical-Power/Equipmt firm has 53.6 million shares outstanding (S criteria) which can contribute to greater price volatility in the event of institutional buying or selling. The number of top-rated funds owning its shares rose from 805 in Jun '22 to 1,679 in Dec '23, a reassuring sign concerning the I criteria. The current Up/Down Volume Ratio of 1.2 is an unbiased indication it has been under slight accumulation over the past 50 days. It has an B Timeliness Rating and a B Sponsorship Rating.
|
|
|
Color Codes Explained :
Y - Better candidates highlighted by our
staff of experts.
G - Previously featured
in past reports as yellow but may no longer be buyable under the
guidelines.
***Last / Change / Volume data in this table is the closing quote data***
Symbol/Exchange
Company Name
Industry Group |
PRICE |
CHANGE
(%Change) |
Day High |
Volume
(% DAV)
(% 50 day avg vol) |
52 Wk Hi
% From Hi |
Featured
Date |
Price
Featured |
Pivot Featured |
|
Max Buy |
 ANET
-
NYSE
ANET
-
NYSE
Arista Networks
Computer-Networking
|
$271.96
|
+2.38
0.88% |
$272.90
|
1,647,240
102.76% of 50 DAV
50 DAV is 1,603,000
|
$270.63
0.49%
|
10/31/2023
|
$188.84
|
PP = $198.80
|
|
MB = $208.74
|
Most Recent Note - 1/24/2024 7:11:55 PM
G - Churned higher volume today while hovering near its all-time high, extended from any sound base. Its 50 DMA line ($231.59) defines near-term support above the prior low ($226.60 on 1/04/24) area. Fundamentals remain strong.
>>> FEATURED STOCK ARTICLE : Extended From Base and Hovering at All-Time High - 12/26/2023 |
View all notes |
Set NEW NOTE alert |
Company Profile |
SEC
News |
Chart |
Request a new note
C
A
S
I |
NVO
-
NYSE
Novo Nordisk ADR
Medical-Ethical Drugs
|
$109.02
|
+0.00
0.00% |
$109.33
|
5,031,191
126.38% of 50 DAV
50 DAV is 3,981,000
|
$109.02
0.00%
|
11/2/2023
|
$100.97
|
PP = $104.10
|
|
MB = $109.31
|
Most Recent Note - 1/26/2024 6:34:15 PM
Y - Posted a gain today backed by +36% above average volume for its second-best-ever close. The recent low ($103.38 on 1/23/24) defines important near-term support nearly coinciding with its 50 DMA line ($102.64).
>>> FEATURED STOCK ARTICLE : Gap Up Gain on Prior Session Triggered Technical Buy Signal - 1/5/2024 |
View all notes |
Set NEW NOTE alert |
Company Profile |
SEC
News |
Chart |
Request a new note
C
A
S
I |
QLYS
-
NASDAQ
Qualys
Computer Sftwr-Security
|
$193.06
|
+1.38
0.72% |
$193.38
|
332,221
92.03% of 50 DAV
50 DAV is 361,000
|
$206.35
-6.44%
|
1/24/2024
|
$196.27
|
PP = $206.45
|
|
MB = $216.77
|
Most Recent Note - 1/26/2024 6:30:21 PM
G - Violated its 50 DMA line ($190) with today's loss backed by above-average volume triggering a technical sell signal. Color code is changed to green. Only a prompt rebound above the 50 DMA line would help its outlook improve.
>>> FEATURED STOCK ARTICLE : Posted Light Volume Gain Finding Support at 50-Day Moving Average - 1/8/2024 |
View all notes |
Set NEW NOTE alert |
Company Profile |
SEC
News |
Chart |
Request a new note
C
A
S
I |
AXON
-
NASDAQ
Axon Enterprise
Security/Sfty
|
$254.25
|
-0.48
-0.19% |
$255.74
|
186,990
49.34% of 50 DAV
50 DAV is 379,000
|
$262.95
-3.31%
|
11/8/2023
|
$127.84
|
PP = $223.30
|
|
MB = $234.47
|
Most Recent Note - 1/29/2024 6:32:39 PM
G - Posted a gain with below-average volume, hovering near its all-time high. Its 50-day moving average (DMA) line ($244) defines near-term support above prior highs in the $229-231 area.
>>> FEATURED STOCK ARTICLE : Consolidating Well Above Near-Term Support - 1/9/2024 |
View all notes |
Set NEW NOTE alert |
Company Profile |
SEC
News |
Chart |
Request a new note
C
A
S
I |
TDG
-
NYSE
TransDigm Group
Aerospace/Defense
|
$1,085.94
|
+4.21
0.39% |
$1,089.50
|
171,849
87.68% of 50 DAV
50 DAV is 196,000
|
$1,089.97
-0.37%
|
12/12/2023
|
$1,000.39
|
PP = $1,013.18
|
|
MB = $1,063.84
|
Most Recent Note - 1/25/2024 5:44:15 PM
G - Posted again today and color code is changed to green as it rose above its "max buy" level for a new all-time high with a volume-driven gain. Prior highs in the $1,013-1,015 area define near-term support to watch on pullbacks.
>>> FEATURED STOCK ARTICLE : Inching to New Highs With 6th Consecutive Gain - 1/11/2024 |
View all notes |
Set NEW NOTE alert |
Company Profile |
SEC
News |
Chart |
Request a new note
C
A
S
I |
Symbol/Exchange
Company Name
Industry Group |
PRICE |
CHANGE
(%Change) |
Day High |
Volume
(% DAV)
(% 50 day avg vol) |
52 Wk Hi
% From Hi |
Featured
Date |
Price
Featured |
Pivot Featured |
|
Max Buy |
PANW
-
NASDAQ
Palo Alto Networks
Computer Sftwr-Security
|
$345.89
|
+0.64
0.19% |
$347.63
|
1,731,433
40.68% of 50 DAV
50 DAV is 4,256,000
|
$350.60
-1.34%
|
1/10/2024
|
$313.65
|
PP = $318.00
|
|
MB = $333.90
|
Most Recent Note - 1/24/2024 6:58:39 PM
Y - Perched near its all-time high, stubbornly holding its ground with recent volume totals below average. A valid secondary buy point exists up to 5% above the prior high after finding support at its 10 WMA line since the prior breakout. Fundamentals remain strong.
>>> FEATURED STOCK ARTICLE : Paused After 6 Gains to a New All-Time High - 1/17/2024 |
View all notes |
Set NEW NOTE alert |
Company Profile |
SEC
News |
Chart |
Request a new note
C
A
S
I |
URI
-
NYSE
United Rentals
Comml Svcs-Leasing
|
$642.98
|
-4.75
-0.73% |
$653.25
|
500,076
69.75% of 50 DAV
50 DAV is 717,000
|
$658.51
-2.36%
|
1/24/2024
|
$576.90
|
PP = $585.60
|
|
MB = $614.88
|
Most Recent Note - 1/26/2024 6:31:16 PM
C - Pulled back today with above-average volume. Color code was changed to green after it gapped up on the prior session and rallied to a new all-time high (and above the "max buy" level) with heavy volume triggering a technical buy signal. Reported Dec '23 quarterly earnings +16% on +13% sales revenues versus the year-ago period, below the +25% minimum earnings guideline (C criteria) raising fundamental concerns. Its prior low ($533.70) and 50 DMA line define near-term support to watch.
>>> FEATURED STOCK ARTICLE : Negative Reversal After New High for United Rentals - 1/24/2024 |
View all notes |
Set NEW NOTE alert |
Company Profile |
SEC
News |
Chart |
Request a new note
C
A
S
I |
AMPH
-
NASDAQ
Amphastar Pharm
Medical-Biomed/Biotech
|
$54.94
|
-0.45
-0.81% |
$55.51
|
384,048
80.18% of 50 DAV
50 DAV is 479,000
|
$67.66
-18.80%
|
12/4/2023
|
$60.84
|
PP = $58.35
|
|
MB = $61.27
|
Most Recent Note - 1/25/2024 5:39:07 PM
G - Quietly slumped further below its 50 DMA line toward its 200 DMA line. A rebound above the 50 DMA line ($57.76) is needed for its outlook to improve. Fundamentals remain strong. See the latest FSU analysis for more details and a new annotated graph.
>>> FEATURED STOCK ARTICLE : Quietly Sinking Toward 200-Day Moving Average Line - 1/25/2024 |
View all notes |
Set NEW NOTE alert |
Company Profile |
SEC
News |
Chart |
Request a new note
C
A
S
I |
TBBK
-
NASDAQ
The Bancorp
Banks-Northeast
|
$46.99
|
+1.76
3.89% |
$47.11
|
668,286
156.51% of 50 DAV
50 DAV is 427,000
|
$45.46
3.37%
|
1/22/2024
|
$40.87
|
PP = $42.56
|
|
MB = $44.69
|
 Most Recent Note - 1/30/2024 5:35:40 PM
G - Color code is changed to green after another volume-driven gain today lifted it above the "max buy" level. Reported Dec '23 quarterly earnings +34% on +16% sales revenues versus the year-ago period. Volume and volatility often increase near earnings news.
>>> FEATURED STOCK ARTICLE : Volume-Driven Breakout Triggered Buy Signal After Earnings Report - 1/26/2024 |
View all notes |
Set NEW NOTE alert |
Company Profile |
SEC
News |
Chart |
Request a new note
C
A
S
I |
LULU
-
NASDAQ
lululemon athletica
Retail-Apparel/Shoes/Acc
|
$481.40
|
-0.59
-0.12% |
$491.30
|
1,257,042
83.47% of 50 DAV
50 DAV is 1,506,000
|
$516.39
-6.78%
|
12/8/2023
|
$490.61
|
PP = $485.93
|
|
MB = $510.23
|
Most Recent Note - 1/30/2024 5:38:49 PM
Y - There was a "negative reversal" today while consolidating above its 50 DMA line ($476). Recent retreat below its 2021 high of $485 raised concerns, negating its recent breakout from a 2+ year base.
>>> FEATURED STOCK ARTICLE : Perched at All-Time High With Volume Totals Cooling - 12/27/2023 |
View all notes |
Set NEW NOTE alert |
Company Profile |
SEC
News |
Chart |
Request a new note
C
A
S
I |
Symbol/Exchange
Company Name
Industry Group |
PRICE |
CHANGE
(%Change) |
Day High |
Volume
(% DAV)
(% 50 day avg vol) |
52 Wk Hi
% From Hi |
Featured
Date |
Price
Featured |
Pivot Featured |
|
Max Buy |
CRWD
-
NASDAQ
CrowdStrike Holdings
Computer Sftwr-Security
|
$301.35
|
+0.68
0.23% |
$302.62
|
2,114,000
61.89% of 50 DAV
50 DAV is 3,416,000
|
$307.55
-2.02%
|
1/2/2024
|
$246.42
|
PP = $261.91
|
|
MB = $275.01
|
Most Recent Note - 1/25/2024 5:40:57 PM
G - Extended from any sound base and it pulled back from its all-time high with today's volume-driven loss. Prior high in the $261 area defines initial support to watch above its 50 DMA line ($249). Fundamentals remain strong.
>>> FEATURED STOCK ARTICLE : CrowdStrike Holdings Pulling Back After "3-Weeks Tight" Pattern - 1/3/2024 |
View all notes |
Set NEW NOTE alert |
Company Profile |
SEC
News |
Chart |
Request a new note
C
A
S
I |
ELF
-
NYSE
e.l.f. Beauty
Cosmetics/Personal Care
|
$161.01
|
+2.17
1.37% |
$161.17
|
1,194,605
84.96% of 50 DAV
50 DAV is 1,406,000
|
$164.71
-2.25%
|
1/2/2024
|
$138.23
|
PP = $153.63
|
|
MB = $161.31
|
Most Recent Note - 1/29/2024 6:34:13 PM
Y - Holding its ground in a tight range above the pivot point and below its "max buy" level. Fundamentals remain strong.
>>> FEATURED STOCK ARTICLE : Pulled Back After Closing 3 Weeks Tight - 1/2/2024 |
View all notes |
Set NEW NOTE alert |
Company Profile |
SEC
News |
Chart |
Request a new note
C
A
S
I |
KOF
-
NYSE
Coca Cola Femsa Sab Ads
FOOD and BEVERAGE - Beverages - Soft Drinks
|
$93.18
|
+0.40
0.43% |
$93.43
|
114,916
82.38% of 50 DAV
50 DAV is 139,500
|
$99.34
-6.20%
|
1/12/2024
|
$93.38
|
PP = $99.34
|
|
MB = $104.31
|
Most Recent Note - 1/30/2024 5:30:30 PM
Y - Posted a 4th consecutive gain with below average volume, finding support above its 50 DMA line ($90.55). Color code was changed to yellow as a valid secondary buy point was noted up to +5% above the recent high since finding support at its 10 WMA line after an earlier breakout. Its Relative Strength Rating is currently 79, below the 80+ minimum guideline for buy candidates.
>>> FEATURED STOCK ARTICLE : Secondary Buy Point Noted After Finding Support - 1/12/2024 |
View all notes |
Set NEW NOTE alert |
Company Profile |
SEC
News |
Chart |
Request a new note
C
A
S
I |
PCAR
-
NASDAQ
Paccar
Trucks and Parts-Hvy Duty
|
$101.97
|
+0.58
0.57% |
$102.25
|
1,712,279
74.64% of 50 DAV
50 DAV is 2,294,000
|
$103.40
-1.38%
|
1/23/2024
|
$100.35
|
PP = $98.57
|
|
MB = $103.50
|
Most Recent Note - 1/24/2024 7:02:14 PM
Y - Paused today after 6 consecutive gains. Triggered a technical buy signal on the prior session with a considerable gain backed by +153% above average volume. Reported Dec '23 quarterly earnings +53% on +11% sales revenues versus the year-ago period, its 9th quarterly comparison with better than the +25% minimum earnings guideline (C criteria). There was a downturn in FY' 20 annual earnings (A criteria) like many companies during the pandemic.
>>> FEATURED STOCK ARTICLE : Volume-Driven Breakout for Paccar - 1/23/2024 |
View all notes |
Set NEW NOTE alert |
Company Profile |
SEC
News |
Chart |
Request a new note
C
A
S
I |
HUBB
-
NYSE
Hubbell
Electrical-Power/Equipmt
|
$344.31
|
+11.75
3.53% |
$347.28
|
899,949
239.35% of 50 DAV
50 DAV is 376,000
|
$340.06
1.25%
|
1/30/2024
|
$343.26
|
PP = $336.83
|
|
MB = $353.67
|
Most Recent Note - 1/30/2024 5:26:40 PM
Y - Finished strong after highlighted in yellow in the earlier mid-day report with pivot point cited based on its 1/22/24 high after a cup-with-handle base. Hit a new all-time high with today's gain backed by +139% above average volume triggering a technical buy signal. See the latest FSU analysis for more details and a new annotated graph.
>>> FEATURED STOCK ARTICLE : Volume Heavy Behind Breakout Gain for Hubbell - 1/30/2024 |
View all notes |
Set NEW NOTE alert |
Company Profile |
SEC
News |
Chart |
Request a new note
C
A
S
I |
Symbol/Exchange
Company Name
Industry Group |
PRICE |
CHANGE
(%Change) |
Day High |
Volume
(% DAV)
(% 50 day avg vol) |
52 Wk Hi
% From Hi |
Featured
Date |
Price
Featured |
Pivot Featured |
|
Max Buy |
|
|
|
THESE ARE NOT BUY RECOMMENDATIONS!
Comments contained in the body of this report are technical
opinions only. The material herein has been obtained
from sources believed to be reliable and accurate, however,
its accuracy and completeness cannot be guaranteed.
This site is not an investment advisor, hence it does
not endorse or recommend any securities or other investments.
Any recommendation contained in this report may not
be suitable for all investors and it is not to be deemed
an offer or solicitation on our part with respect to
the purchase or sale of any securities. All trademarks,
service marks and trade names appearing in this report
are the property of their respective owners, and are
likewise used for identification purposes only.
This report is a service available
only to active Paid Premium Members.
You may opt-out of receiving report notifications
at any time. Questions or comments may be submitted
by writing to Premium Membership Services 665 S.E. 10 Street, Suite 201 Deerfield Beach, FL 33441-5634 or by calling 1-800-965-8307
or 954-785-1121.
|
|
|