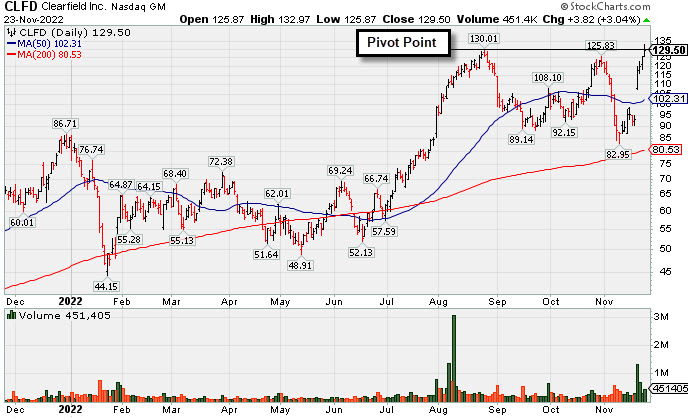
Hit New High But Encountered Distributional Pressure - Wednesday, November 23, 2022
Clearfield Inc (CLFD +$3.82 or +3.04% to $129.50) was highlighted again in yellow with pivot point cited based on its 8/25/22 high plus 10 cents in the earlier mid-day report (read here). It hit a new all-time high with today's 5th consecutive gain backed by +62% above average volume, however it encountered some distributional pressure, ending near the middle of the intra-day range and below the pivot point. Subsequent gains and close above the pivot point backed by at least +40% above average volume may trigger a new technical buy signal. It gapped up on 11/18/22 for a considerable gain, rebounding from below its 50-day moving average (DMA) line ($102). Since last shown in this FSU section on 10/27/22 with an annotated graph under the headline "Clearfield Perched -8.6% Off High After Recent Rebound", it slumped but found support above its 200 DMA line and showed resilience.
CLFD reported Sep '22 quarterly earnings +130% on +110% sales revenues versus the year ago period. It has the highest possible Earnings Per Share Rating of 99. Fundamentals have been strong. It reported Jun '22 quarterly earnings +109% on +84% sales revenues above the year ago period. Annual earnings (A criteria) growth has been strong after a downturn in FY '17.
The TELECOMMUNICATIONS - Fiber Optics group is currently ranked 31st on the 197 Industry Groups list (L criteria). There are only 13.8 million shares outstanding (S criteria) which can contribute to greater price volatility in the event of institutional buying or selling. The number of top-rated funds owning its shares rose from 132 in Jun '20 to 315 in Sep '22, a reassuring sign concerning the I criteria. Its current Up/Down Volume Ratio of 1.4 is an unbiased indication its shares have been under accumulation over the past 50 days. Its Accumulation/Distribution Rating is B+, Timeliness Rating is A, and its Sponsorship Rating is B.
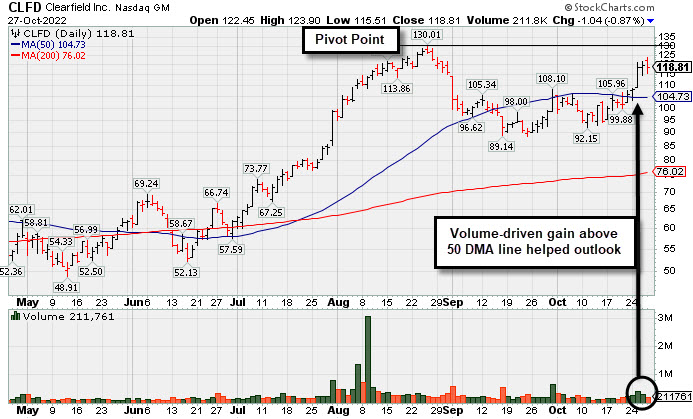
Clearfield Perched -8.6% Off High After Recent Rebound - Thursday, October 27, 2022
Clearfield Inc (CLFD ) paused today after rallying toward its 52-week high with 4 consecutive gains. A new pivot point was cited based on its 8/25/22 high plus 10 cents. Subsequent gains above the pivot point backed by at least +40% above average volume may trigger a technical buy signal. Keep in mid it is due to report Sep '22 quarterly results on 11/04/22. Volume and volatility often increase near earnings news.
CLFD showed resilience since dropped from the Featured Stocks list on 9/01/22. It slumped below its 50-day moving average and sputtered below it for several weeks since last shown in this FSU section on 8/17/22 with an annotated graph under the headline "Clearfield Showed Resilience After Considerable Rally".
CLFD has the highest possible Earnings Per Share Rating of 99. Fundamentals have been strong. It reported Jun '22 quarterly earnings +109% on +84% sales revenues above the year ago period. Annual earnings (A criteria) growth has been strong after a downturn in FY '17.
The TELECOMMUNICATIONS - Fiber Optics group is currently ranked 21st on the 197 Industry Groups list (L criteria). There are only 13.8 million shares outstanding (S criteria) which can contribute to greater price volatility in the event of institutional buying or selling. The number of top-rated funds owning its shares rose from 132 in Jun '20 to 303 in Sep '22, a reassuring sign concerning the I criteria. Its current Up/Down Volume Ratio of 1.1 is an unbiased indication its shares have been near neutral concerning accumulation/distribution over the past 50 days. Its Accumulation/Distribution Rating is B+, Timeliness Rating is A, and its Sponsorship Rating is B.
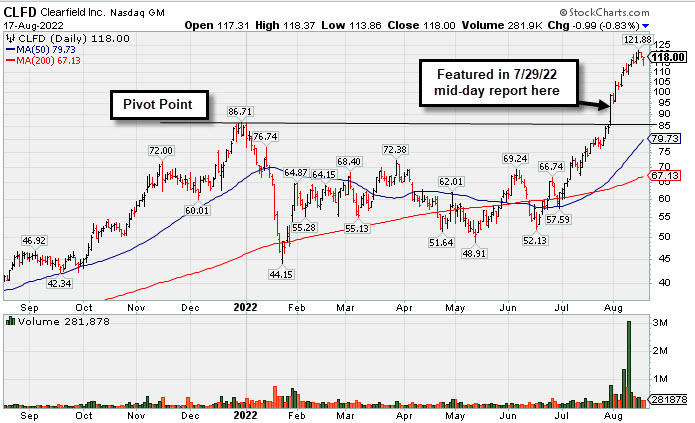
Clearfield Showed Resilience After Considerable Rally - Wednesday, August 17, 2022
Clearfield Inc (CLFD -$0.99 or -0.83% to $118.00) gapped down today retreating from its all-time high, however, it rebounded to close near the session high. It is very extended from any sound base. The prior high in the $86 area defines initial support to watch.
CLFD finished strong after highlighted in yellow with pivot point cited based on its 12/30/21 high plus 10 cents in the 7/29/22 mid-day report (read here). More detailed analysis was shown that evening with an annotated graph under the headline "Volume Heavy Behind Technical Breakout".
CLFD has the highest possible Earnings Per Share Rating of 99. Fundamentals remain strong after it reported Jun '22 quarterly earnings +109% on +84% sales revenues above the year ago period. Annual earnings (A criteria) growth has been strong after a downturn in FY '17.
The TELECOMMUNICATIONS - Fiber Optics group is currently ranked 29th on the 197 Industry Groups list (L criteria). There are only 13.8 million shares outstanding (S criteria) which can contribute to greater price volatility in the event of institutional buying or selling. The number of top-rated funds owning its shares rose from 132 in Jun '20 to 261 in Jun '22, a reassuring sign concerning the I criteria. Its current Up/Down Volume Ratio of 2.3 is an unbiased indication its shares have been under accumulation over the past 50 days. Its Accumulation/Distribution Rating is A+, Timeliness Rating is A, and its Sponsorship Rating is B.
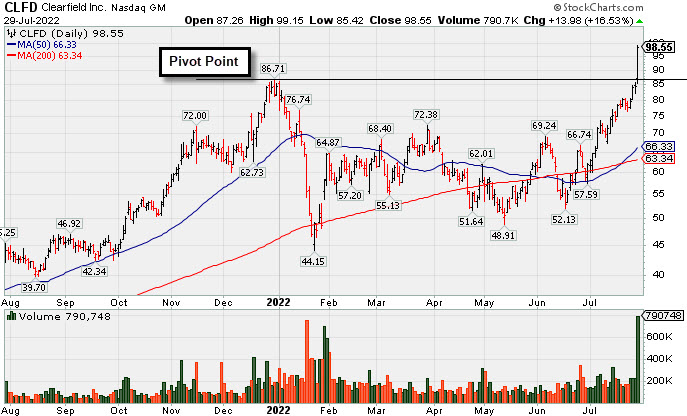
Volume Heavy Behind Technical Breakout - Friday, July 29, 2022
Clearfield Inc (CLFD +$13.98 or +16.53% to $98.55) finished strong after highlighted in yellow with pivot point cited based on its 12/30/21 high plus 10 cents in the earlier mid-day report (read here). It spiked to a new 52-week high with today's 4th consecutive volume-driven gain triggering a technical buy signal. The volume total was +395% above average behind the gain, action indicative of institutional buying demand
CLFD has an Earnings Per Share Rating of 99. Fundamentals remain strong after it reported Jun '22 quarterly earnings +109% on +84% sales revenues above the year ago period. Annual earnings (A criteria) growth has been strong after a downturn in FY '17.
CLFD was last shown in this FSU section on 12/30/21 with an annotated graph under the headline "Negative Reversal After Hitting a New All Time High". It showed resilience and made a choppy rebound since dropped from the Featured Stocks list on 1/19/22.
TheTELECOMMUNICATIONS - Fiber Optics group is currently ranked 39th on the 197 Industry Groups list (L criteria). There are only 13.8 million shares outstanding (S criteria) which can contribute to greater price volatility in the event of institutional buying or selling. The number of top-rated funds owning its shares rose from 132 in Jun '20 to 259 in Jun '22, a reassuring sign concerning the I criteria. Its current Up/Down Volume Ratio of 1.5 is an unbiased indication its shares have been under accumulation over the past 50 days. Its Accumulation/Distribution Rating is A and Timeliness Rating is A, but its Sponsorship Rating is C.
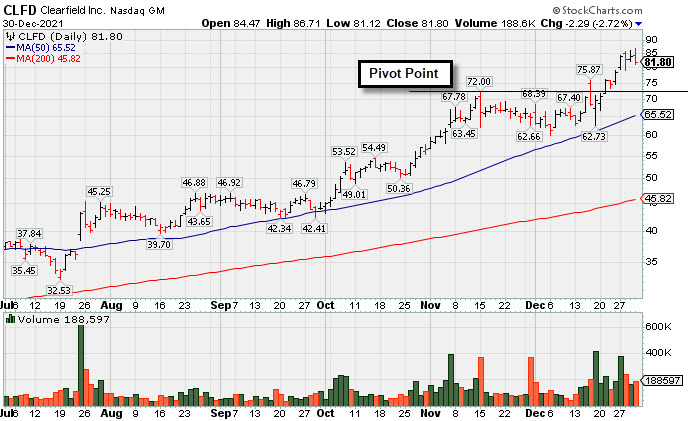
Negative Reversal After Hitting a New All Time High - Thursday, December 30, 2021
Clearfield Inc (CLFD -$2.29 or -2.72% to $81.80) reversed into the red after hitting a new all-time high with today's early gain, getting very extended beyond its "max buy" level. The prior high ($72) defines initial support to watch on pullbacks.
CLFD has an Earnings Per Share Rating of 93. It reported Sep '21 quarterly earnings +141% on +66% sales revenues above the year ago period, continuing its strong earnings track record. Th e high-ranked TELECOMMUNICATIONS - Fiber Optics firm has reported 6 consecutive quarterly earnings comparisons above the +25% minimum guideline (C criteria). Annual earnings (A criteria) history has improved after a downturn in FY '17.
CLFD traded up as much as +115.5% since recently highlighted in yellow again in the 7/23/21 mid-day report (read here) with new pivot point cited based on its 6/07/21 high plus 10 cents. A new pivot point was noted on 12/16/21 and it subsequently broke out again since last shown in detail in this FSU section on 11/22/21 with an annotated graph under the headline "Perched Near High Extended From Any Sound Base".
CLFD traded up +289.9% since first highlighted in yellow with pivot point cited based on its 11/09/20 high plus 10 cents in the 11/17/20 mid-day report (read here). There are only 13.7 million shares outstanding (S criteria) which can contribute to greater price volatility in the event of institutional buying or selling. The number of top-rated funds owning its shares rose from 132 in Jun '20 to 203 in Sep '21. Its current Up/Down Volume Ratio of 1.7 is an unbiased indication its shares have been under accumulation over the past 50 days. Its Accumulation/Distribution Rating is A and Timeliness Rating is A, but its Sponsorship Rating is D.
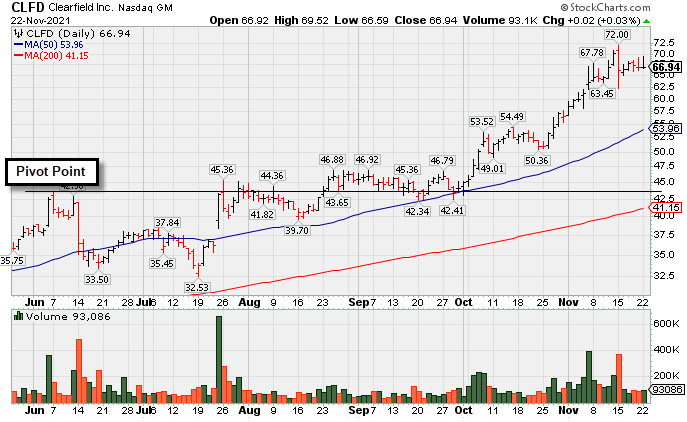
Perched Near High Extended From Any Sound Base - Monday, November 22, 2021
Clearfield Inc (CLFD +$0.02 or +0.03% to $66.94) is perched near its all-time high, very extended from the previously noted base. Its 50-day moving average (DMA) line ($54) defines near-term support to watch on pullbacks.
Reported Sep '21 quarterly earnings +141% on +66% sales revenues above the year ago period, continuing its strong earnings track record. The high-ranked TELECOMMUNICATIONS - Fiber Optics firm has reported 6 consecutive quarterly earnings comparisons above the +25% minimum guideline (C criteria). Annual earnings (A criteria) history has improved after a downturn in FY '17.
CLFD rose +78.9% since recently highlighted in yellow again in the 7/23/21 mid-day report (read here) with new pivot point cited based on its 6/07/21 high plus 10 cents. It was last shown in detail in this FSU section on 10/18/21 with an annotated graph under the headline "Extended From Prior Base After Latest Rally".
CLFD traded up more than 224% since first highlighted in yellow with pivot point cited based on its 11/09/20 high plus 10 cents in the 11/17/20 mid-day report (read here). There are only 13.7 million shares outstanding (S criteria) which can contribute to greater price volatility in the event of institutional buying or selling. The number of top-rated funds owning its shares rose from 132 in Jun '20 to 205 in Sep '21. Its current Up/Down Volume Ratio of 2.3 is an unbiased indication its shares have been under accumulation over the past 50 days. Its Accumulation/Distribution Rating is A and Timeliness Rating is A, but its Sponsorship Rating is D.
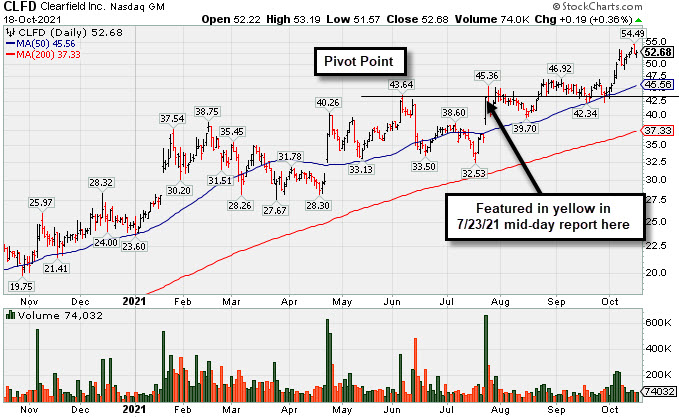
Extended From Prior Base After Latest Rally - Monday, October 18, 2021
Clearfield Inc (CLFD +$0.19 or +0.36% to $52.68) is perched at its 52-week high, extended from the previously noted base. Near term support to watch is defined by prior highs in the $46 area and its 50-day moving average (DMA) line ($45.56). Any damaging losses may trigger technical sell signals. Fundamentals remain strong.
CLFD was most recently highlighted in yellow again in the 7/23/21 mid-day report (read here) with new pivot point cited based on its 6/07/21 high plus 10 cents. It was last shown in detail in this FSU section on 9/14/21 with an annotated graph under the headline "Quietly Consolidating Near All-Time High". The latest bullish action came after it reported Jun '21 quarterly earnings +100% on +49% sales revenues versus the year ago period, continuing its strong earnings track record. The high-ranked TELECOMMUNICATIONS - Fiber Optics firm has reported 6 consecutive quarterly earnings comparisons above the +25% minimum guideline (C criteria). Annual earnings (A criteria) history has improved after a downturn in FY '17.
CLFD traded up more than 145% since first highlighted in yellow with pivot point cited based on its 11/09/20 high plus 10 cents in the 11/17/20 mid-day report (read here). There are only 13.7 million shares outstanding (S criteria) which can contribute to greater price volatility in the event of institutional buying or selling. The number of top-rated funds owning its shares rose from 132 in Jun '20 to 200 in Sep '21. Its current Up/Down Volume Ratio of 2.2 is an unbiased indication its shares have been under accumulation over the past 50 days. Its Accumulation/Distribution Rating is A- and Timeliness Rating is A, but its Sponsorship Rating is D.
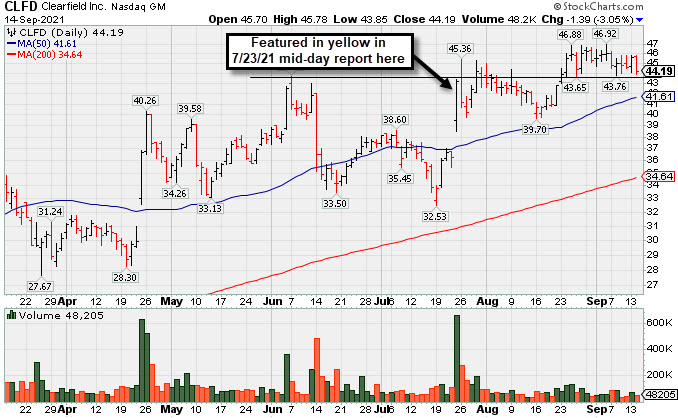
Quietly Consolidating Near All-Time High - Tuesday, September 14, 2021
Clearfield Inc (CLFD -$1.39 or -3.05% to $44.19) is still quietly consolidating below its "max buy" level. Its 50-day moving average (DMA) line ($41.61) defines important near-term support to watch on pullbacks.
CLFD was most recently highlighted in yellow again in the 7/23/21 mid-day report (read here) with new pivot point cited based on its 6/07/21 high plus 10 cents. It was shown in detail in this FSU section that evening with an annotated graph under the headline "Big Volume-Driven Gain Challenging Prior High After Earnings".
Fundamentals remain strong. The latest bullish action came after it reported Jun '21 quarterly earnings +100% on +49% sales revenues versus the year ago period, continuing its strong earnings track record. The high-ranked TELECOMMUNICATIONS - Fiber Optics firm has reported 6 consecutive quarterly earnings comparisons above the +25% minimum guideline (C criteria). Annual earnings (A criteria) history has improved after a downturn in FY '17.
CLFD traded up more than 111% since first highlighted in yellow with pivot point cited based on its 11/09/20 high plus 10 cents in the 11/17/20 mid-day report (read here).
The number of top-rated funds owning its shares rose from 132 in Jun '20 to 183 in Jun '21. Its current Up/Down Volume Ratio of 1.2 is an unbiased indication its shares have been under accumulation over the past 50 days. Its Accumulation/Distribution Rating is B+ and Timeliness Rating is B, and its Sponsorship Rating is D.
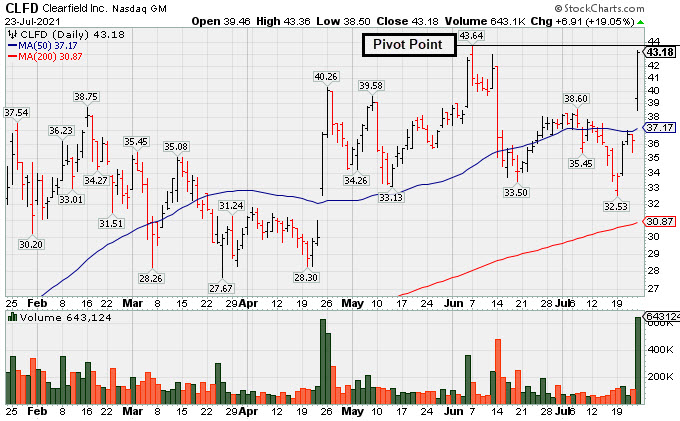
Big Volume-Driven Gain Challenging Prior High After Earnings - Friday, July 23, 2021
Clearfield Inc (CLFD +$6.91 or +19.05% to $43.18) finished strong after highlighted in yellow in the earlier mid-day report (read here) with new pivot point cited based on its 6/07/21 high plus 10 cents. it gapped up today rebounding above its 50-day moving average (DMA) line with heavy volume behind the gain, helping its outlook to improve. Subsequent gains above the pivot point with volume may trigger a new (or add-on) technical buy signal.
Fundamentals remain strong. The latest bullish action came after it reported Jun '21 quarterly earnings +100% on +49% sales revenues versus the year ago period, continuing its strong earnings track record. CLFD was last shown in this FSU section on 6/30/21 with an annotated graph under the headline "Consolidating Above 50-Day Moving Average Helped Outlook". It was dropped from the Featured Stocks list on 7/16/21.
The high-ranked TELECOMMUNICATIONS - Fiber Optics firm has reported 6 consecutive quarterly earnings comparisons above the +25% minimum guideline (C criteria). Annual earnings (A criteria) history has improved after a downturn in FY '17.
CLFD traded up more than 75% since first highlighted in yellow with pivot point cited based on its 11/09/20 high plus 10 cents in the 11/17/20 mid-day report (read here).
The number of top-rated funds owning its shares rose from 132 in Jun '20 to 177 in Jun '21. Its current Up/Down Volume Ratio of 0.9 is an unbiased indication its shares have been under slight distributional pressure over the past 50 days. Its Accumulation/Distribution Rating is C+ and Timeliness Rating is B, and its Sponsorship Rating is D.
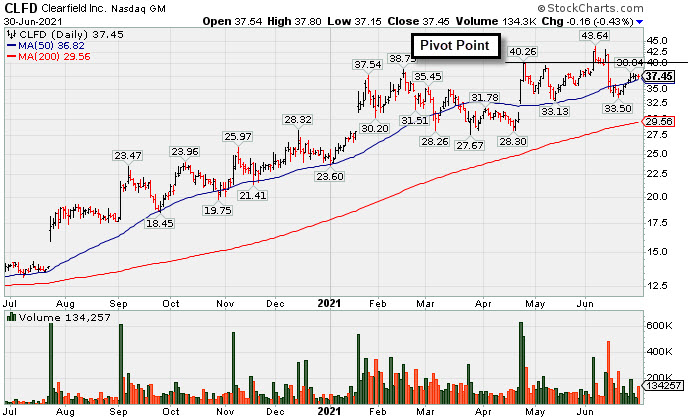
Consolidating Above 50-Day Moving Average Helped Outlook - Wednesday, June 30, 2021
Clearfield Inc (CLFD -$0.16 or -0.43% to $37.45) has been consolidating above Its 50-day moving average (DMA) line ($36.64) which has helped its outlook improve. Fundamentals remain strong. It made no meaningful progress since highlighted in yellow with new pivot point cited based on its 2/16/21 high plus 10 cents in the 4/26/21 mid-day report (read here). The recent low ($33.50) defines important near term support to watch. More damaging losses would raise serious concerns.
Bullish action came after it reported Mar '21 quarterly earnings +440% on +45% sales revenues versus the year ago period, continuing its strong earnings track record. The high-ranked TELECOMMUNICATIONS - Fiber Optics firm has reported 5 consecutive quarterly earnings comparisons above the +25% minimum guideline (C criteria). Annual earnings (A criteria) history has improved after a downturn in FY '17.
CLFD traded up more than 75% since first highlighted in yellow with pivot point cited based on its 11/09/20 high plus 10 cents in the 11/17/20 mid-day report (read here).
It has been showing resilience since last shown in this FSU section on 5/24/21 with an annotated graph under the headline, "Stalled and Found Support Above 50-Day Moving Average".
The number of top-rated funds owning its shares rose from 132 in Jun '20 to 166 in Mar '21. Its current Up/Down Volume Ratio of 1.5 is an unbiased indication its shares have been under slight accumulation over the past 50 days. Its Accumulation/Distribution Rating is C+ and Timeliness Rating is B, and its Sponsorship Rating is D.
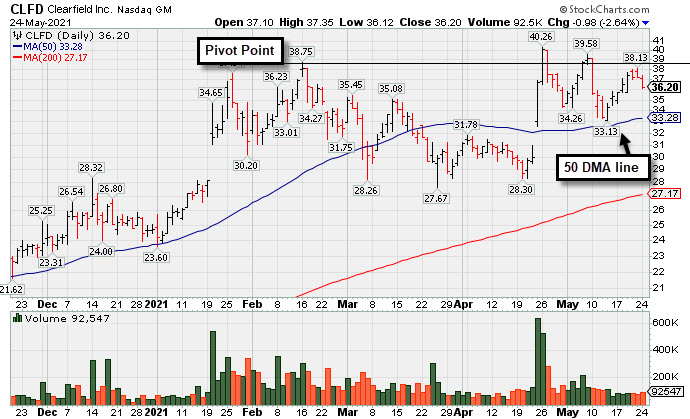
Stalled and Found Support Above 50-Day Moving Average - Monday, May 24, 2021
Clearfield Inc (CLFD -$0.98 or -2.64% to $36.20) has been consolidating in a choppy fashion but it made no further headway after highlighted in yellow with new pivot point cited based on its 2/16/21 high plus 10 cents in the 4/26/21 mid-day report (read here). Its 50-day moving average (DMA) line and recent low define important near term support to watch. More damaging losses would raise serious concerns.
Bullish action came after it reported Mar '21 quarterly earnings +440% on +45% sales revenues versus the year ago period, continuing its strong earnings track record. The high-ranked TELECOMMUNICATIONS - Fiber Optics firm has reported 5 consecutive quarterly earnings comparisons above the +25% minimum guideline (C criteria). Annual earnings (A criteria) history has improved after a downturn in FY '17.
CLFD traded up more than 75% since first highlighted in yellow with pivot point cited based on its 11/09/20 high plus 10 cents in the 11/17/20 mid-day report (read here). It found support near prior highs in the $28 area since dropped from the Featured Stocks list, showing resilience since last shown in this FSU section on 4/26/21 with an annotated graph under the headline, "Rallied Straight Up From Bottom of 10-Week Base".
The number of top-rated funds owning its shares rose from 132 in Jun '20 to 164 in Mar '21. Its current Up/Down Volume Ratio of 1.5 is an unbiased indication its shares have been under slight accumulation over the past 50 days. Its Accumulation/Distribution Rating is B- and Timeliness Rating is A, and its Sponsorship Rating is D.
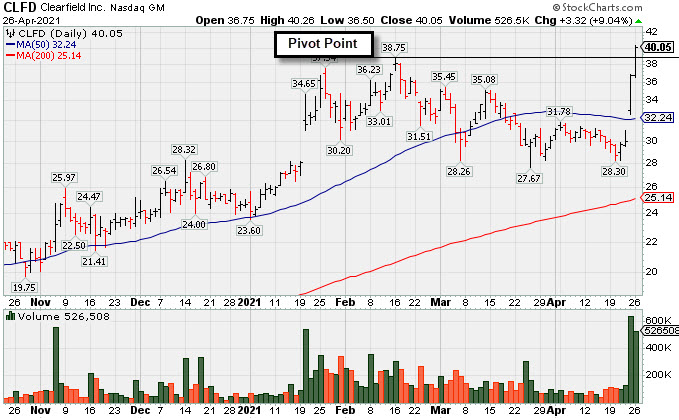
Rallied Straight Up From Bottom of 10-Week Base - Monday, April 26, 2021
Clearfield Inc (CLFD +$3.32 or +9.04% to $40.05) finished strong after highlighted in yellow with new pivot point cited based on its 2/16/21 high plus 10 cents in the earlier mid-day report (read here). The gain backed by +271% above average volume and strong close above the pivot point clinched a convincing new technical buy signal. It hit a new 52-week high (N criteria) with today's 4th consecutive gain, rallying straight up from the bottom of a 10-week base. CLFD rebounded above its 50-day moving average (DMA) line ($32.23) with a big gap up on the prior session.
Bullish action came after it reported Mar '21 quarterly earnings +440% on +45% sales revenues versus the year ago period, continuing its strong earnings track record. The high-ranked TELECOMMUNICATIONS - Fiber Optics firm has reported 5 consecutive quarterly earnings comparisons above the +25% minimum guideline (C criteria). Annual earnings (A criteria) history has improved after a downturn in FY '17.
CLFD traded up more than 75% since first highlighted in yellow with pivot point cited based on its 11/09/20 high plus 10 cents in the 11/17/20 mid-day report (read here). It found support near prior highs in the $28 area since dropped from the Featured Stocks list, showing resilience since last shown in this FSU section on 3/29/21 with an annotated graph under the headline, "Fell Further Below 50-Day Average Testing Near Old High".
The number of top-rated funds owning its shares rose from 132 in Jun '20 to 160 in Mar '21. Its current Up/Down Volume Ratio of 1.1 is an unbiased indication its shares have been under slight accumulation over the past 50 days.Its Accumulation/Distribution Rating is B- and Timeliness Rating is C, and its Sponsorship Rating is D.
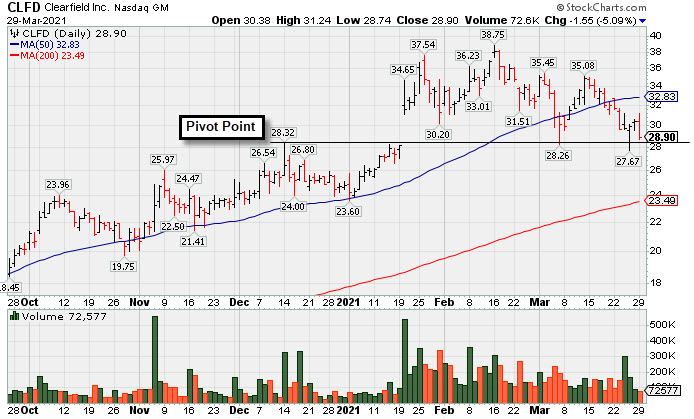
Fell Further Below 50-Day Average Testing Near Old High - Monday, March 29, 2021
Clearfield Inc (CLFD -$1.55 or -5.09% to $28.90) slumped and closed further below its 50-day moving average (DMA) line ($32.83) today, testing support at prior highs in the $28 area. More damaging losses would raise greater concerns. It will be dropped from the Featured Stocks list tonight. A rebound above the 50 DMA line is needed for its outlook to improve.
Fundamentals remain strong. The high-ranked TELECOMMUNICATIONS - Fiber Optics firm reported Dec '20 quarterly earnings +475% on +40% sales revenues versus the year ago period, continuing its strong earning track record with a 4th consecutive quarterly earnings comparison above the +25% minimum guideline (C criteria). Annual earnings (A criteria) history has improved after a downturn in FY '17.
CLFD traded up as much as 74.2% since highlighted in yellow with pivot point cited based on its 11/09/20 high plus 10 cents in the 11/17/20 mid-day report (read here). It was last shown in this FSU section on 3/09/21 with an annotated graph under the headline, "Quiet Gain Repaired 50-Day Moving Average Violation".
The number of top-rated funds owning its shares rose from 132 in Jun '20 to 152 in Dec '20. Its current Up/Down Volume Ratio of 1.3 is an unbiased indication its shares have been under accumulation over the past 50 days. Its Accumulation/Distribution Rating is C- and Timeliness Rating is B, and its Sponsorship Rating is C.
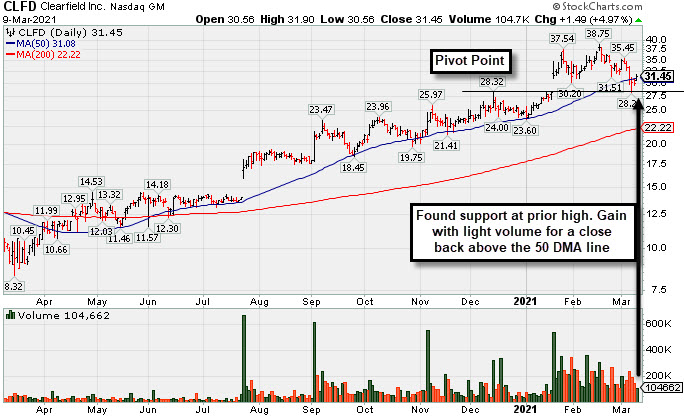
Quiet Gain Repaired 50-Day Moving Average Violation - Tuesday, March 9, 2021
Clearfield Inc (CLFD +$1.49 or +4.97% to $31.45) posted a big gain today with below average volume, rebounding to close above its 50-day moving average (DMA) line ($31.08), helping its outlook improve. It found prompt support above prior highs in the $28 area.
Fundamentals remain strong. The high-ranked TELECOMMUNICATIONS - Fiber Optics firm reported Dec '20 quarterly earnings +475% on +40% sales revenues versus the year ago period, continuing its strong earning track record with a 4th consecutive quarterly earnings comparison above the +25% minimum guideline (C criteria). Annual earnings (A criteria) history has improved after a downturn in FY '17.
Fundamentals remain strong. The high-ranked TELECOMMUNICATIONS - Fiber Optics firm reported Dec '20 quarterly earnings +475% on +40% sales revenues versus the year ago period, continuing its strong earning track record with a 4th consecutive quarterly earnings comparison above the +25% minimum guideline (C criteria). Annual earnings (A criteria) history has improved after a downturn in FY '17.
CLFD traded up as much as 74.2% since highlighted in yellow with pivot point cited based on its 11/09/20 high plus 10 cents in the 11/17/20 mid-day report (read here). It was last shown in this FSU section on 2/24/21 with an annotated graph under the headline, "Consolidating Well Above 50-Day Moving Average Line".
The number of top-rated funds owning its shares rose from 132 in Jun '20 to 153 in Dec '20. Its current Up/Down Volume Ratio of 1.3 is an unbiased indication its shares have been under accumulation over the past 50 days. Its Accumulation/Distribution Rating is C- and Timeliness Rating is B, and its Sponsorship Rating is C.
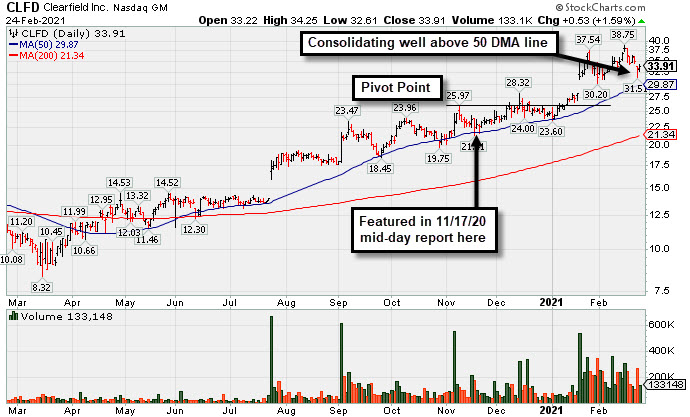
Consolidating Well Above 50-Day Moving Average Line - Wednesday, February 24, 2021
Clearfield Inc (CLFD +$0.53 or +1.59% to $33.91) held its ground today. It gapped down on the prior session for a damaging volume-driven loss raising concerns. It is very extended from any sound base. Its 50-day moving average (DMA) line ($29.87) and prior highs in the $28 area define important near-term support to watch.
The high-ranked TELECOMMUNICATIONS - Fiber Optics firm reported Dec '20 quarterly earnings +475% on +40% sales revenues versus the year ago period, continuing its strong earning track record with a 4th consecutive quarterly earnings comparison above the +25% minimum guideline (C criteria). Annual earnings (A criteria) history has improved after a downturn in FY '17.
CLFD traded up as much as 74.2% since highlighted in yellow with pivot point cited based on its 11/09/20 high plus 10 cents in the 11/17/20 mid-day report (read here). It was last shown in this FSU section on 1/27/21 with an annotated graph under the headline, "Perched Near Record High With Earnings Report Due Soon".
The number of top-rated funds owning its shares rose from 132 in Jun '20 to 152 in Dec '20. Its current Up/Down Volume Ratio of 1.8 is an unbiased indication its shares have been under accumulation over the past 50 days. Its Accumulation/Distribution Rating is B- and Timeliness Rating is A, but it still has a Sponsorship Rating of D.
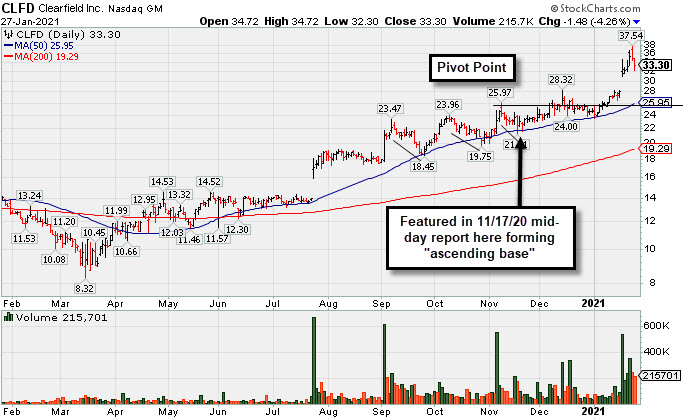
Perched Near Record High With Earnings Report Due Soon - Wednesday, January 27, 2021
Clearfield Inc (CLFD -$1.48 or -4.26% to $33.30) retreated from a 2nd consecutive volume-driven loss today after 5 consecutive volume-driven gains into new high territory. Its impressive winning streak included the 1/20/21 big "breakaway gap" previously noted. Keep in mind it is due to report Dec '20 quarterly results after the close on Thursday, January 28, 2021. Volume and volatility often increase near earnings news. Prior highs in the $28 area define initial support to watch on pullbacks. It found prompt support at its 50-day moving average (DMA) line ($25.95) and upward trendline when consolidating.
It was highlighted in yellow with pivot point cited based on its 11/09/20 high plus 10 cents in the 11/17/20 mid-day report (read here). It was last shown in this FSU section on 1/04/20 with an annotated graph under the headline, "Distributional Pressure While Testing Important Chart Support".
The high-ranked TELECOMMUNICATIONS - Fiber Optics firm reported earnings +57% on +14% sales revenues for the Sep '20 quarter versus the year ago period, its 3rd consecutive quarterly earnings comparison above the +25% minimum guideline (C criteria). Annual earnings (A criteria) history has improved after a downturn in FY '17.
The number of top-rated funds owning its shares rose from 132 in Jun '20 to 139 in Sep '20. Its current Up/Down Volume Ratio of 2.6 is an unbiased indication its shares have been under accumulation over the past 50 days. Its Accumulation/Distribution Rating is A+ and Timeliness Rating is A, but it still has a Sponsorship Rating of D.
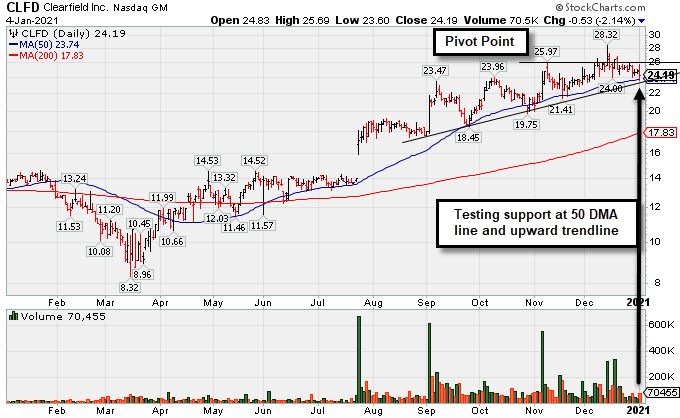
Distributional Pressure While Testing Important Chart Support - Monday, January 4, 2021
Clearfield Inc (CLFD -$0.53 or -2.14% to $24.19) slumped further below the pivot point with today's big loss on near average volume. It tested near term support defined by its 50-day moving average (DMA) line ($23.7) and an upward trendline. More damaging losses may raise concerns and trigger a technical sell signal. It churned higher volume in recent weeks without making meaningful price progress, action indicative of distributional pressure.
It was highlighted in yellow with pivot point cited based on its 11/09/20 high plus 10 cents in the 11/17/20 mid-day report (read here). It was shown in this FSU section on 12/10/20 with an annotated graph under the headline, "Perched Near Pivot Point in Need of Confirming Gain on Volume".
The high-ranked TELECOMMUNICATIONS - Fiber Optics firm reported earnings +57% on +14% sales revenues for the Sep '20 quarter versus the year ago period, its 3rd consecutive quarterly earnings comparison above the +25% minimum guideline (C criteria). Annual earnings (A criteria) history has improved after a downturn in FY '17.
The number of top-rated funds owning its shares rose from 132 in Jun '20 to 134 in Sep '20. Its current Up/Down Volume Ratio of 1.7 is an unbiased indication its shares have been under accumulation over the past 50 days. It currently has a Timeliness Rating of B but a Sponsorship Rating of D. Its Accumulation/Distribution Rating is B.
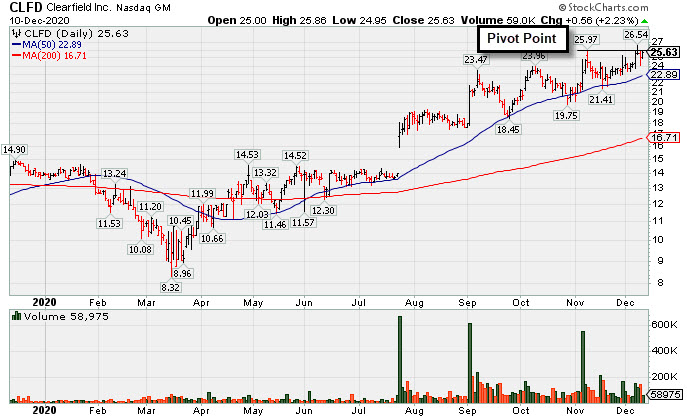
Perched Near Pivot Point in Need of Confirming Gain on Volume - Thursday, December 10, 2020
Clearfield Inc (CLFD +$0.56 or +2.23% to $25.63) posted a gain today with below above average volume hovering near its 52-week high. Near term support is defined by its 50-day moving average (DMA) line ($22.89) and an upward trendline. Subsequent gains and a close above the pivot point backed by at least +40% above average volume are needed to trigger a proper technical buy signal.
It was highlighted in yellow with pivot point cited based on its 11/09/20 high plus 10 cents in the 11/17/20 mid-day report (read here). It was shown that even in this FSU section with an annotated graph under the headline, "Formed Ascending Base Following Earlier Breakway Gap".
The high-ranked TELECOMMUNICATIONS - Cables / Satalite Equipment firm reported earnings +57% on +14% sales revenues for the Sep '20 quarter versus the year ago period, its 3rd consecutive quarterly earnings comparison above the +25% minimum guideline (C criteria). Annual earnings (A criteria) history has improved after a downturn in FY '17.
The number of top-rated funds owning its shares rose from 132 in Jun '20 to 136 in Sep '20. Its current Up/Down Volume ratio of 1.6 is an unbiased indication its shares have been under accumulation over the past 50 days. It currently has a Timeliness Rating of A but a Sponsorship Rating of D. Its Accumulation/Distribution Rating is B.
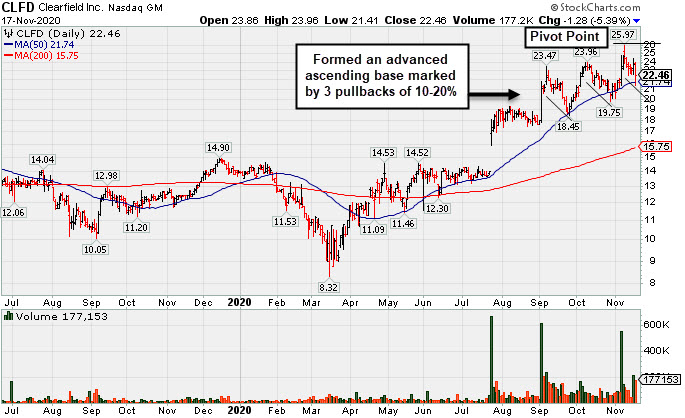
Formed Ascending Base Following Earlier Breakway Gap - Tuesday, November 17, 2020
Clearfield Inc (CLFD -$1.28 or -5.39% to $22.46) suffered a volume-driven loss today while testing support at its 50-day moving average (DMA) line ($21.74). More damaging losses would raise concerns. It was highlighted in yellow with pivot point cited based on its 11/09/20 high plus 10 cents in the earlier mid-day report (read here). It has formed an advanced "ascending base" marked by 3 pullbacks of 10-20% after a big breakaway gap on 7/24/20. Subsequent gains above the pivot point marked by +40% above average volume are needed to trigger a proper new technical buy signal.
The high[ranked TELECOMMUNICATIONS - Cables / Satalite Equipment firm reported earnings +57% on +14% sales revenues for the Sep '20 quarter versus the year ago period, its 3rd consecutive quarterly earnings comparison above the +25% minimum guideline (C criteria). Annual earnings (A criteria) history has improved after a downturn in FY '17.
The number of top-rated funds owning its shares rose from 132 in Jun '20 to 136 in Sep '20. Its current Up/Down Volume ratio of 1.3 is an unbiased indication its shares have been under accumulation over the past 50 days. It currently has a Timeliness Rating of A but a Sponsorship Rating of E. Its Accumulation/Distribution Rating is B.