You are not logged in.
This means you
CAN ONLY VIEW reports that were published prior to Wednesday, April 9, 2025.
You
MUST UPGRADE YOUR MEMBERSHIP if you want to see any current reports.
AFTER MARKET UPDATE - WEDNESDAY, FEBRUARY 24TH, 2021
Previous After Market Report Next After Market Report >>>
|
|
|
|
DOW |
+424.51 |
31,961.86 |
+1.35% |
|
Volume |
1,187,997,224 |
-6% |
|
Volume |
5,709,058,400 |
-24% |
|
NASDAQ |
+138.94 |
13,604.14 |
+1.03% |
|
Advancers |
2,130 |
67% |
|
Advancers |
2,762 |
71% |
|
S&P 500 |
+44.06 |
3,925.43 |
+1.14% |
|
Decliners |
1,060 |
33% |
|
Decliners |
1,105 |
29% |
|
Russell 2000 |
+53.07 |
2,284.38 |
+2.38% |
|
52 Wk Highs |
394 |
|
|
52 Wk Highs |
387 |
|
|
S&P 600 |
+35.23 |
1,323.75 |
+2.73% |
|
52 Wk Lows |
21 |
|
|
52 Wk Lows |
15 |
|
|
 |
Major Indices Rallied With Lackluster Volume Totals
Kenneth J. Gruneisen - Passed the CAN SLIM® Master's Exam
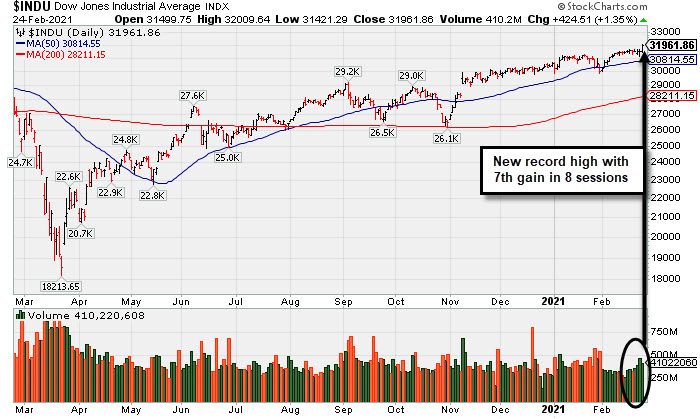
The Dow climbed 424 points, erasing a 110-point decline to close at a fresh all-time high. The S&P 500 advanced 1.1%, up for the second straight day. The Tech-heavy Nasdaq Composite rebounded 1%, posting its first gain of the week. The volume totals were lighter than the prior session on the NYSE and on the Nasdaq exchange, indicative of lackluster institutional buying demand. Breadth was positive as advancers led decliners by a 2-1 margin on the NYSE and by 5-2 on the Nasdaq exchange. There were 99 high-ranked companies from the Leaders List that hit new 52-week highs and were listed on the BreakOuts Page, versus the total of 55 on the prior session. New 52-week highs totals expanded and easily outnumbered new 52-week lows totals on both exchanges. The major indices are in a confirmed uptrend (M criteria) with healthy leadership provided by many stocks hitting new highs. Investors are reminded to always make buying and selling decisions based based on the strict criteria and rules of the fact-based investment system. PICTURED: The Dow Jones Industrial Average hit a new record high with its 7th gain in the span of 8 sessions. It stayed well above its 50-day moving average (DMA) line in recent weeks.
U.S. stocks finished firmly higher on Wednesday, reversing earlier losses. Fed commentary helped buoy sentiment despite another jump in Treasury yields, while value shares tied to economic reopenings outperformed.
The yield on the 10-year Treasury note broke above 1.40% in early trading, its highest level in a year. However, government bonds recovered earlier losses, with the yield on the 10-year note ending the day up one basis point to 1.37% after Fed Chair Jerome Powell stated that it could take more than three years for inflation to hit the central bank’s 2% target. On the data front, new home sales climbed 4.3% in January, far exceeding expectations for a 1.7% rise.
Nine of 11 S&P 500 sectors closed in positive territory, with Energy shares pacing gains as WTI crude jumped 2.5% to $63.22/barrel. Industrials also outperformed, as expectations for a swift economic recovery supported more cyclical-oriented stocks. Financials were also among the standouts, with the KBW Bank Index hitting its strongest level since 2007 amid a steepening yield curve. In earnings, Lowe's (LOW -3.74%) fell after the home improvement company warned sales would likely decline this year. Toll Brothers (TOL +3.17%) rose following an earnings beat that included a boost to its forward guidance. Elsewhere, Johnson & Johnson (JNJ +1.34%) rose after its one-shot COVID-19 vaccine cleared a key hurdle for emergency use authorization. |
 Kenneth J. Gruneisen started out as a licensed stockbroker in August 1987, a couple of months prior to the historic stock market crash that took the Dow Jones Industrial Average down -22.6% in a single day. He has published daily fact-based fundamental and technical analysis on high-ranked stocks online for two decades. Through FACTBASEDINVESTING.COM, Kenneth provides educational articles, news, market commentary, and other information regarding proven investment systems that work in good times and bad.
Comments contained in the body of this report are technical opinions only and are not necessarily those of Gruneisen Growth Corp. The material herein has been obtained from sources believed to be reliable and accurate, however, its accuracy and completeness cannot be guaranteed. Our firm, employees, and customers may effect transactions, including transactions contrary to any recommendation herein, or have positions in the securities mentioned herein or options with respect thereto. Any recommendation contained in this report may not be suitable for all investors and it is not to be deemed an offer or solicitation on our part with respect to the purchase or sale of any securities. |
|
 |
Energy, Financial, and Semiconductor Indexes Led Gainers
Kenneth J. Gruneisen - Passed the CAN SLIM® Master's Exam
The Bank Index ($BKX +2.77%) and Broker/Dealer Index ($XBD +1.51%) both were a positive influence on the major averages while the Retail Index ($RLX -0.95%) created a drag. The Semiconductor Index ($SOX +3.29%) led the tech sector, and the Biotech Index ($BTK +0.20%) inched higher, but the Networking Index ($NWX -0.18%) ended slightly in the red. Energy-linked groups posted standout gains as the Oil Services Index ($OSX +6.62%) and Integrated Oil Index ($XOI +3.05%) both rallied. PICTURED: The Gold & Silver Index ($XAU +1.73%) notched a solid gain that helped it close back above its 50-day and 200-day moving average (DMA) lines.
| Oil Services |
$OSX |
57.08 |
+3.54 |
+6.62% |
+28.76% |
| Integrated Oil |
$XOI |
1,032.62 |
+30.52 |
+3.05% |
+30.30% |
| Semiconductor |
$SOX |
3,185.44 |
+101.56 |
+3.29% |
+13.95% |
| Networking |
$NWX |
790.98 |
-1.45 |
-0.18% |
+10.30% |
| Broker/Dealer |
$XBD |
446.09 |
+6.62 |
+1.51% |
+18.14% |
| Retail |
$RLX |
3,558.60 |
-34.24 |
-0.95% |
-0.13% |
| Gold & Silver |
$XAU |
143.34 |
+2.44 |
+1.73% |
-0.59% |
| Bank |
$BKX |
119.78 |
+3.23 |
+2.77% |
+22.33% |
| Biotech |
$BTK |
5,920.94 |
+11.91 |
+0.20% |
+3.17% |
|
|
|
 |
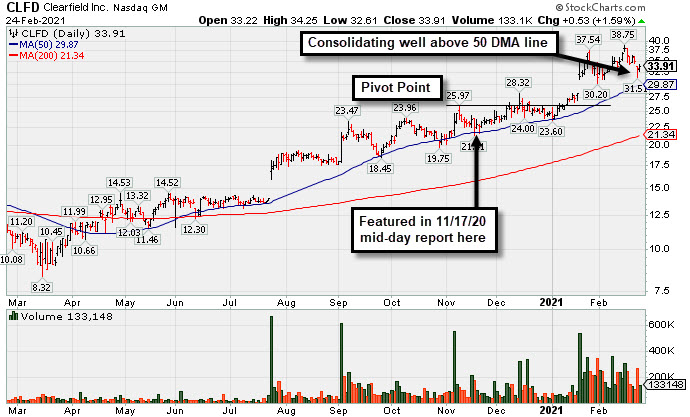
Consolidating Well Above 50-Day Moving Average Line
Kenneth J. Gruneisen - Passed the CAN SLIM® Master's Exam
Clearfield Inc (CLFD +$0.53 or +1.59% to $33.91) held its ground today. It gapped down on the prior session for a damaging volume-driven loss raising concerns. It is very extended from any sound base. Its 50-day moving average (DMA) line ($29.87) and prior highs in the $28 area define important near-term support to watch.
The high-ranked TELECOMMUNICATIONS - Fiber Optics firm reported Dec '20 quarterly earnings +475% on +40% sales revenues versus the year ago period, continuing its strong earning track record with a 4th consecutive quarterly earnings comparison above the +25% minimum guideline (C criteria). Annual earnings (A criteria) history has improved after a downturn in FY '17.
CLFD traded up as much as 74.2% since highlighted in yellow with pivot point cited based on its 11/09/20 high plus 10 cents in the 11/17/20 mid-day report (read here). It was last shown in this FSU section on 1/27/21 with an annotated graph under the headline, "Perched Near Record High With Earnings Report Due Soon".
The number of top-rated funds owning its shares rose from 132 in Jun '20 to 152 in Dec '20. Its current Up/Down Volume Ratio of 1.8 is an unbiased indication its shares have been under accumulation over the past 50 days. Its Accumulation/Distribution Rating is B- and Timeliness Rating is A, but it still has a Sponsorship Rating of D.
|
|
|
Color Codes Explained :
Y - Better candidates highlighted by our
staff of experts.
G - Previously featured
in past reports as yellow but may no longer be buyable under the
guidelines.
***Last / Change / Volume data in this table is the closing quote data***
Symbol/Exchange
Company Name
Industry Group |
PRICE |
CHANGE
(%Change) |
Day High |
Volume
(% DAV)
(% 50 day avg vol) |
52 Wk Hi
% From Hi |
Featured
Date |
Price
Featured |
Pivot Featured |
|
Max Buy |
 CRL
-
NYSE
CRL
-
NYSE
Charles River Labs Intl
DRUGS - Biotechnology
|
$288.22
|
+5.24
1.85% |
$289.18
|
255,259
78.54% of 50 DAV
50 DAV is 325,000
|
$303.79
-5.13%
|
12/17/2020
|
$247.06
|
PP = $257.98
|
|
MB = $270.88
|
Most Recent Note - 2/23/2021 6:24:42 PM
G - Posted a 4th consecutive loss today with near average volume. Slumping since it reported Dec '20 quarterly earnings +19% on +14% sales revenues versus the year ago period, below the +25% minimum earnings guideline (C criteria).
>>> FEATURED STOCK ARTICLE : Testing Important Support on Pullback - 1/29/2021 |
View all notes |
Set NEW NOTE alert |
Company Profile |
SEC
News |
Chart |
Request a new note
C
A
S
I |
AMRC
-
NYSE
Ameresco Inc Cl A
ENERGY - Alternative
|
$60.20
|
-0.03
-0.05% |
$61.82
|
390,296
85.03% of 50 DAV
50 DAV is 459,000
|
$70.26
-14.32%
|
12/15/2020
|
$46.72
|
PP = $47.10
|
|
MB = $49.46
|
Most Recent Note - 2/23/2021 6:23:08 PM
G - Finished near the session high today after gapping down and briefly undercutting its 50-day moving average (DMA) line ($57.13) which has been noted as important near-term support to watch.
>>> FEATURED STOCK ARTICLE : Rebounding After Retreat From Record High - 2/1/2021 |
View all notes |
Set NEW NOTE alert |
Company Profile |
SEC
News |
Chart |
Request a new note
C
A
S
I |
CLFD
-
NASDAQ
Clearfield Inc
TELECOMMUNICATIONS - Cables / Satalite Equipment
|
$33.91
|
+0.53
1.59% |
$34.25
|
133,148
84.27% of 50 DAV
50 DAV is 158,000
|
$38.75
-12.49%
|
1/20/2021
|
$31.38
|
PP = $28.42
|
|
MB = $29.84
|
 Most Recent Note - 2/24/2021 5:18:41 PM
G - Halted its slide today with a gain after a gap down on the prior session and damaging volume-driven loss raised concerns. It is very extended from any sound base. Its 50 DMA line ($29.87) and prior highs in the $28 area define important near-term support to watch. Reported Dec '20 quarterly earnings +475% on +40% sales revenues versus the year ago period, continuing its strong earning track record. See the latest FSU analysis for more details and a new annotated graph.
>>> FEATURED STOCK ARTICLE : Consolidating Well Above 50-Day Moving Average Line - 2/24/2021 |
View all notes |
Set NEW NOTE alert |
Company Profile |
SEC
News |
Chart |
Request a new note
C
A
S
I |
NOW
-
NYSE
Servicenow Inc
Computer Sftwr-Enterprse
|
$551.83
|
+0.08
0.01% |
$554.20
|
1,107,789
82.15% of 50 DAV
50 DAV is 1,348,500
|
$598.37
-7.78%
|
8/20/2020
|
$453.34
|
PP = $454.79
|
|
MB = $477.53
|
Most Recent Note - 2/23/2021 6:27:09 PM
G - Managed a "positive reversal" today after slumping well below its 50 DMA line ($549) raising concerns. Relative Strength rating has slumped to 64, well below the 80+ minimum guideline for buy candidates. A new pivot point was not cited due to fundamental concerns noted after it reported Dec '20 quarterly earnings +22% on +31% sales revenues versus the year ago period, its 2nd consecutive comparison below the +25% minimum guideline (C criteria) of the fact-based investment system.
>>> FEATURED STOCK ARTICLE : Hit New Highs With Latest Gains Backed by Light Volume - 2/5/2021 |
View all notes |
Set NEW NOTE alert |
Company Profile |
SEC
News |
Chart |
Request a new note
C
A
S
I |
SMPL
-
NASDAQ
Simply Good Foods Co
Food-Confectionery
|
$29.38
|
+1.00
3.52% |
$29.62
|
907,884
80.11% of 50 DAV
50 DAV is 1,133,300
|
$32.03
-8.27%
|
12/28/2020
|
$30.40
|
PP = $31.44
|
|
MB = $33.01
|
Most Recent Note - 2/24/2021 11:47:36 AM
Y - Color code is changed to yellow after rebounding above its 50 DMA line ($28.59) helping its outlook improve. Its Relative Strength Rating is 64, still well below the 80+ minimum guideline. Its prior low ($26.78) defines the next important near term support to watch.
>>> FEATURED STOCK ARTICLE : Pulling Back Quietly After Rebounding Near All-Time High - 2/17/2021 |
View all notes |
Set NEW NOTE alert |
Company Profile |
SEC
News |
Chart |
Request a new note
C
A
S
I |
Symbol/Exchange
Company Name
Industry Group |
PRICE |
CHANGE
(%Change) |
Day High |
Volume
(% DAV)
(% 50 day avg vol) |
52 Wk Hi
% From Hi |
Featured
Date |
Price
Featured |
Pivot Featured |
|
Max Buy |
ALRM
-
NASDAQ
Alarm.com Holdings Inc
Security/Sfty
|
$92.87
|
-0.03
-0.03% |
$94.09
|
372,494
82.41% of 50 DAV
50 DAV is 452,000
|
$108.67
-14.54%
|
2/9/2021
|
$71.88
|
PP = $108.67
|
|
MB = $114.10
|
Most Recent Note - 2/22/2021 6:20:15 PM
G - Color code is changed to green after quietly slumping to a close below its 50 DMA line ($97.21) raising concerns. Due to report Dec '20 quarterly results on 2/25/21.
>>> FEATURED STOCK ARTICLE : Perched Near Prior High After Finding Support at 10 WMA - 2/11/2021 |
View all notes |
Set NEW NOTE alert |
Company Profile |
SEC
News |
Chart |
Request a new note
C
A
S
I |
TEAM
-
NASDAQ
Atlassian Corp Plc
Comp Sftwr-Spec Enterprs
|
$239.93
|
-1.53
-0.63% |
$240.69
|
1,082,059
75.84% of 50 DAV
50 DAV is 1,426,800
|
$262.40
-8.56%
|
10/12/2020
|
$193.77
|
PP = $199.60
|
|
MB = $209.58
|
Most Recent Note - 2/23/2021 1:24:48 PM
G - Abruptly retreating from its all-time high with today's 2nd consecutive big loss on higher volume while undercutting 50 DMA line ($237.89). The recent low ($208.62 on 1/27/21) defines the next important near-term support to watch. Its current Relative Strength Rating is 65, below the +80 minimum guideline for buy candidates. Fundamental concerns remain after earnings rose +0% on +23% sales revenues for the Dec '20 quarter versus the year ago period, its 2nd comparison below the +25% minimum earnings guideline (C criteria).
>>> FEATURED STOCK ARTICLE : Quietly Touched a New High Despite Fundamental Concerns Noted - 2/8/2021 |
View all notes |
Set NEW NOTE alert |
Company Profile |
SEC
News |
Chart |
Request a new note
C
A
S
I |
SHOP
-
NYSE
Shopify Inc Cl A
Computer Sftwr-Enterprse
|
$1,301.15
|
+0.91
0.07% |
$1,320.00
|
1,107,930
80.52% of 50 DAV
50 DAV is 1,376,000
|
$1,499.75
-13.24%
|
2/2/2021
|
$1,218.72
|
PP = $1,285.28
|
|
MB = $1,349.54
|
Most Recent Note - 2/23/2021 1:19:02 PM
G - Gapped down today and undercut the prior high ($1,285 on 12/22/20) raising concerns, yet it found prompt support near its 50 DMA line ($1,219). Reported Dec '20 quarterly earnings +267% on +94% sales revenues versus the year ago period.
>>> FEATURED STOCK ARTICLE : Perched Within Striking Distance of New Pivot Point - 2/3/2021 |
View all notes |
Set NEW NOTE alert |
Company Profile |
SEC
News |
Chart |
Request a new note
C
A
S
I |
YETI
-
NYSE
Yeti Holdings Inc
Leisure-Products
|
$70.67
|
-2.74
-3.73% |
$73.44
|
911,301
61.04% of 50 DAV
50 DAV is 1,493,000
|
$80.89
-12.63%
|
2/19/2021
|
$74.99
|
PP = $80.99
|
|
MB = $85.04
|
Most Recent Note - 2/24/2021 5:27:59 PM
Y - Still sputtering near its 50 DMA line ($71.61). Prior low ($64.80) on 2/01/21) defines important near term support where a violation may trigger a more worrisome technical sell signal. New pivot point cited was based on its 1/14/21 high plus 10 cents after a flat base. Subsequent gains above the pivot point backed by at least 40% above average volume may trigger a new (or add-on) technical buy signal. Reported Dec '20 quarterly earnings +72% on +26% sales revenues versus the year ago period.
>>> FEATURED STOCK ARTICLE : Rebounded Just Above 50-Day Moving Average Line - 2/18/2021 |
View all notes |
Set NEW NOTE alert |
Company Profile |
SEC
News |
Chart |
Request a new note
C
A
S
I |
DOCU
-
NASDAQ
Docusign Inc
Computer Sftwr-Enterprse
|
$239.66
|
-3.94
-1.62% |
$243.00
|
3,419,751
117.92% of 50 DAV
50 DAV is 2,900,000
|
$290.23
-17.42%
|
1/12/2021
|
$253.50
|
PP = $256.10
|
|
MB = $268.91
|
Most Recent Note - 2/22/2021 6:27:02 PM
Y - Suffered a big volume-driven loss today testing the 50 DMA line ($242.65) again. More damaging losses would raise greater concerns. Faces little resistance due to overhead supply. Fundamentals remain strong.
>>> FEATURED STOCK ARTICLE : Consolidating Back Above 50-Day Moving Average Near Prior High - 2/9/2021 |
View all notes |
Set NEW NOTE alert |
Company Profile |
SEC
News |
Chart |
Request a new note
C
A
S
I |
Symbol/Exchange
Company Name
Industry Group |
PRICE |
CHANGE
(%Change) |
Day High |
Volume
(% DAV)
(% 50 day avg vol) |
52 Wk Hi
% From Hi |
Featured
Date |
Price
Featured |
Pivot Featured |
|
Max Buy |
XPEL
-
NASDAQ
Xpel Inc
Auto/Truck-Tires andamp; Misc
|
$46.40
|
-2.65
-5.40% |
$50.85
|
360,999
135.21% of 50 DAV
50 DAV is 267,000
|
$60.77
-23.65%
|
2/22/2021
|
$59.00
|
PP = $60.87
|
|
MB = $63.91
|
Most Recent Note - 2/24/2021 5:26:19 PM
G - Suffered a 2nd consecutive damaging volume-driven loss after violating its 50 DMA line on the prior session and triggering a technical sell signal. Pivot point cited was based on its 1/14/21 high plus 10 cents when noted in the prior mid-day report - "A gain and strong close above its pivot point backed by at least +40% above average volume may trigger a technical buy signal. Keep in mind it is a riskier late-stage base, however, no resistance remains due to overhead supply as its challenging its all-time high after finding prompt support at its 50 DMA line ($52.92) during prior consolidations. This Auto/Truck - Replacement Parts firm reported Sep '20 quarterly earnings +50% on +29% sales revenues versus the year ago period. Three of the past 4 quarterly comparisons were above the +25% minimum earnings guideline (C criteria). Annual earnings history has been strong after a downturn in FY '17." See the latest FSU analysis for more details and an annotated graph.
>>> FEATURED STOCK ARTICLE : Damaging Loss Indicative of Distributional Pressure - 2/23/2021 |
View all notes |
Set NEW NOTE alert |
Company Profile |
SEC
News |
Chart |
Request a new note
C
A
S
I |
DT
-
NYSE
Dynatrace Inc
Computer Sftwr-Enterprse
|
$51.86
|
+1.23
2.43% |
$52.18
|
1,339,099
54.84% of 50 DAV
50 DAV is 2,442,000
|
$56.77
-8.65%
|
2/4/2021
|
$51.39
|
PP = $48.95
|
|
MB = $51.40
|
Most Recent Note - 2/22/2021 6:28:43 PM
G - Pulled back further with average volume today. Its relative Strength Rating has slumped to 71, below the 80+ minimum guideline for buy candidates. Prior highs in the $48 area define initial support to watch above its 50 DMA line ($45.31). Fundamentals remain strong after it reported Dec '20 earnings +70% on +28% sales revenues versus the year ago period.
>>> FEATURED STOCK ARTICLE : Breakout Action Returns Dynatrace to Featured Stocks List - 2/4/2021 |
View all notes |
Set NEW NOTE alert |
Company Profile |
SEC
News |
Chart |
Request a new note
C
A
S
I |
MRBK
-
NASDAQ
Meridian Corp
Banks-Northeast
|
$25.77
|
+0.57
2.26% |
$25.81
|
52,856
203.29% of 50 DAV
50 DAV is 26,000
|
$26.94
-4.34%
|
2/22/2021
|
$25.58
|
PP = $26.10
|
|
MB = $27.41
|
Most Recent Note - 2/24/2021 5:32:58 PM
Y - Posted a solid gain today with +95% above average volume for a best ever close. Pivot point cited was based on its 12/18/21 high plus 10 cents. Subsequent gains and a strong close above its pivot point backed by at least +40% above average volume may help clinch a convincing technical buy signal. The past 3 quarterly comparisons through Dec '20 had earnings increases well above the +25% minimum guideline (C criteria). Annual earnings growth has been good since it Nov '17 IPO at $17. See the latest FSU analysis for more details and an annotated graph.
>>> FEATURED STOCK ARTICLE : Negative Reversal When Poised to Convincingly Breakout - 2/22/2021 |
View all notes |
Set NEW NOTE alert |
Company Profile |
SEC
News |
Chart |
Request a new note
C
A
S
I |
AXON
-
NASDAQ
Axon Enterprise Inc
Security/Sfty
|
$161.45
|
-7.69
-4.55% |
$171.82
|
813,229
115.52% of 50 DAV
50 DAV is 704,000
|
$212.37
-23.98%
|
12/22/2020
|
$127.84
|
PP = $130.51
|
|
MB = $137.04
|
Most Recent Note - 2/24/2021 5:24:08 PM
G - Suffered a 3rd consecutive loss today on higher volume, slumping toward its 50 DMA line ($151.85). Due to report Dec '20 quarterly results after the market closes on Thursday, February 25, 2021. Volume and volatility often increase near earnings news. Formerly traded under the ticker symbol AAXN where prior notes and detailed analysis may be reviewed.
>>> FEATURED STOCK ARTICLE : Extended From Prior Base Following Streak fo Volume-Driven Gains - 2/2/2021 |
View all notes |
Set NEW NOTE alert |
Company Profile |
SEC
News |
Chart |
Request a new note
C
A
S
I |
|
|
|
THESE ARE NOT BUY RECOMMENDATIONS!
Comments contained in the body of this report are technical
opinions only. The material herein has been obtained
from sources believed to be reliable and accurate, however,
its accuracy and completeness cannot be guaranteed.
This site is not an investment advisor, hence it does
not endorse or recommend any securities or other investments.
Any recommendation contained in this report may not
be suitable for all investors and it is not to be deemed
an offer or solicitation on our part with respect to
the purchase or sale of any securities. All trademarks,
service marks and trade names appearing in this report
are the property of their respective owners, and are
likewise used for identification purposes only.
This report is a service available
only to active Paid Premium Members.
You may opt-out of receiving report notifications
at any time. Questions or comments may be submitted
by writing to Premium Membership Services 665 S.E. 10 Street, Suite 201 Deerfield Beach, FL 33441-5634 or by calling 1-800-965-8307
or 954-785-1121.
|
|
|