You are not logged in.
This means you
CAN ONLY VIEW reports that were published prior to Tuesday, March 25, 2025.
You
MUST UPGRADE YOUR MEMBERSHIP if you want to see any current reports.
AFTER MARKET UPDATE - THURSDAY, DECEMBER 10TH, 2020
Previous After Market Report Next After Market Report >>>
|
|
|
|
DOW |
-69.55 |
29,999.26 |
-0.23% |
|
Volume |
965,811,479 |
-8% |
|
Volume |
4,447,403,300 |
-13% |
|
NASDAQ |
+68.03 |
12,406.98 |
+0.55% |
|
Advancers |
1,646 |
53% |
|
Advancers |
2,229 |
62% |
|
S&P 500 |
-4.72 |
3,668.10 |
-0.13% |
|
Decliners |
1,434 |
47% |
|
Decliners |
1,394 |
38% |
|
Russell 2000 |
+20.56 |
1,922.70 |
+1.08% |
|
52 Wk Highs |
178 |
|
|
52 Wk Highs |
236 |
|
|
S&P 600 |
+5.38 |
1,095.22 |
+0.49% |
|
52 Wk Lows |
3 |
|
|
52 Wk Lows |
16 |
|
|
 |
Tech Heavy Nasdaq Rose While Other Indices Inched Lower
Kenneth J. Gruneisen - Passed the CAN SLIM® Master's Exam
The Dow fell 69 points, while the S&P 500 declined 0.1%. The Nasdaq Composite bucked the downtrend, advancing 0.5%. The volume totals were lighter than the prior session on the NYSE and on the Nasdaq exchange. Advancers led decliners by an 8-7 margin on the NYSE and by a 3-2 margin on the Nasdaq exchange. Leadership thinned as there were 37 high-ranked companies from the Leaders List that hit new 52-week highs and were listed on the BreakOuts Page, versus the total of 91 on the prior session. New 52-week highs totals contacted yet still solidly outnumbered new 52-week lows totals on both exchanges. The major indices confirmed a new uptrend (M criteria) with recent follow-through gains backed by higher volume and more leadership. Investors are reminded to always make buying and selling decisions based based on the strict criteria and rules of the fact-based investment system. 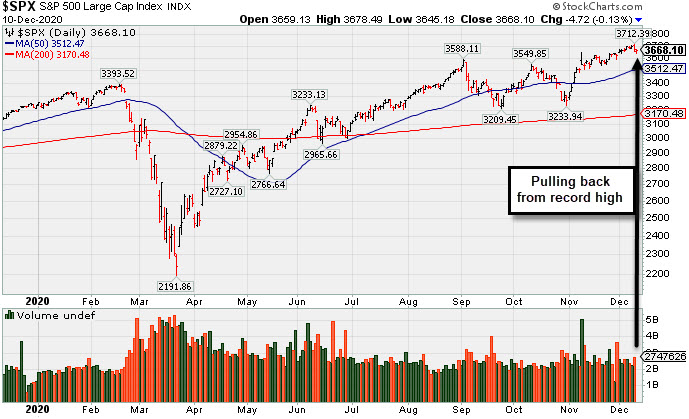 PICTURED: The S&P 500 Index retreated from its record high.
Stocks finished mixed on Thursday, as investors weighed disappointing unemployment data against hopes for additional fiscal stimulus. Leaders from both parties signaled that progress had been made on Thursday, while a separate news report showed a bipartisan group of lawmakers reached an agreement for a $160 billion proposal in state and local aid. However, coronavirus liability protections for business is likely to remain as a key hurdle. Meanwhile, the U.S. surpassed 3,000 COVID-related deaths for the first time on Wednesday and new daily infections remained elevated above 200,000.
On the data front, the weekly initial jobless claims release showed the number of Americans filing for unemployment benefits jumped more than anticipated to 853,000 in the latest week from an upwardly revised 716,000 the prior period. Separately, the headline consumer price index (CPI) ticked up 0.2% in November, while the year-over-year core figure (ex- food and energy) rose 1.6%. Treasuries advanced, with the yield on the 10-year note slipping three basis points to 0.90%. In commodities, WTI crude added 3% to $46.88/barrel.
Eight of 11 S&P 500 sectors ended in negative territory. The Energy, Financial, and Information Technology groups bucked the downtrend, while the Industrials and Materials lagged the most. In corporate news, Starbucks (SBUX +4.97%) rose to a new all-time high after the coffee chain giant said its U.S. stores are rebounding faster than expected, and the company anticipates a “significant” recovery next year. |
 Kenneth J. Gruneisen started out as a licensed stockbroker in August 1987, a couple of months prior to the historic stock market crash that took the Dow Jones Industrial Average down -22.6% in a single day. He has published daily fact-based fundamental and technical analysis on high-ranked stocks online for two decades. Through FACTBASEDINVESTING.COM, Kenneth provides educational articles, news, market commentary, and other information regarding proven investment systems that work in good times and bad.
Comments contained in the body of this report are technical opinions only and are not necessarily those of Gruneisen Growth Corp. The material herein has been obtained from sources believed to be reliable and accurate, however, its accuracy and completeness cannot be guaranteed. Our firm, employees, and customers may effect transactions, including transactions contrary to any recommendation herein, or have positions in the securities mentioned herein or options with respect thereto. Any recommendation contained in this report may not be suitable for all investors and it is not to be deemed an offer or solicitation on our part with respect to the purchase or sale of any securities. |
|
 |
Energy Biotech and Networking Indexes Rose
Kenneth J. Gruneisen - Passed the CAN SLIM® Master's Exam
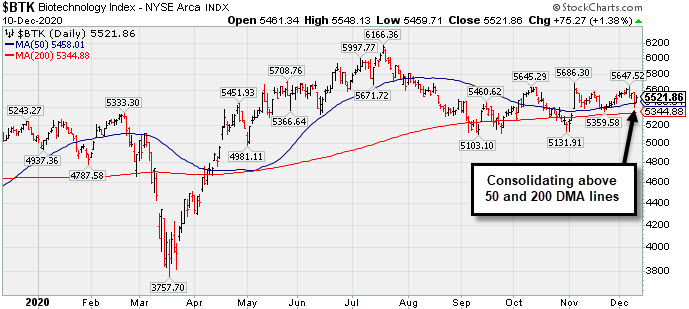
Strength in energy-related shares helped the Oil Services Index ($OSX +4.14%) and Integrated Oil Index ($XOI +3.40%) post standout gains. The Biotech Index ($BTK +1.38%) and Networking Index ($NWX +0.99%) led the tech sector higher while the Semiconductor Index ($SOX -0.07%) finished flat. Financial shares were mixed as the Bank Index ($BKX +0.46%) edged higher but the Broker/Dealer Index ($XBD -0.65%) lost ground. The Retail Index ($RLX -0.20%) edged lower and the Gold & Silver Index ($XAU +0.35%) edged higher.
PICTURED: The Biotech Index ($BTK +1.38%) is consolidating above its 50 and 200 DMA lines.
| Oil Services |
$OSX |
47.02 |
+1.87 |
+4.14% |
-39.93% |
| Integrated Oil |
$XOI |
848.62 |
+27.89 |
+3.40% |
-33.21% |
| Semiconductor |
$SOX |
2,732.91 |
-1.86 |
-0.07% |
+47.76% |
| Networking |
$NWX |
670.04 |
+6.57 |
+0.99% |
+14.85% |
| Broker/Dealer |
$XBD |
360.93 |
-2.36 |
-0.65% |
+24.29% |
| Retail |
$RLX |
3,438.68 |
-6.81 |
-0.20% |
+40.40% |
| Gold & Silver |
$XAU |
140.10 |
+0.49 |
+0.35% |
+31.03% |
| Bank |
$BKX |
95.50 |
+0.44 |
+0.46% |
-15.76% |
| Biotech |
$BTK |
5,521.86 |
+75.27 |
+1.38% |
+8.97% |
|
|
|
 |
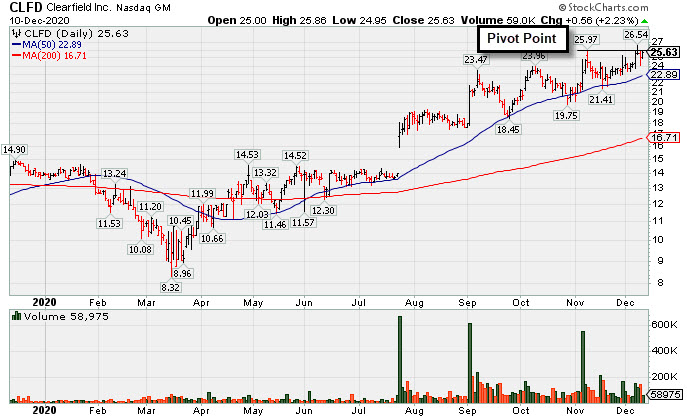
Perched Near Pivot Point in Need of Confirming Gain on Volume
Kenneth J. Gruneisen - Passed the CAN SLIM® Master's Exam
Clearfield Inc (CLFD +$0.56 or +2.23% to $25.63) posted a gain today with below above average volume hovering near its 52-week high. Near term support is defined by its 50-day moving average (DMA) line ($22.89) and an upward trendline. Subsequent gains and a close above the pivot point backed by at least +40% above average volume are needed to trigger a proper technical buy signal.
The high-ranked TELECOMMUNICATIONS - Cables / Satalite Equipment firm reported earnings +57% on +14% sales revenues for the Sep '20 quarter versus the year ago period, its 3rd consecutive quarterly earnings comparison above the +25% minimum guideline (C criteria). Annual earnings (A criteria) history has improved after a downturn in FY '17.
The number of top-rated funds owning its shares rose from 132 in Jun '20 to 136 in Sep '20. Its current Up/Down Volume ratio of 1.6 is an unbiased indication its shares have been under accumulation over the past 50 days. It currently has a Timeliness Rating of A but a Sponsorship Rating of D. Its Accumulation/Distribution Rating is B.
|
|
|
Color Codes Explained :
Y - Better candidates highlighted by our
staff of experts.
G - Previously featured
in past reports as yellow but may no longer be buyable under the
guidelines.
***Last / Change / Volume data in this table is the closing quote data***
Symbol/Exchange
Company Name
Industry Group |
PRICE |
CHANGE
(%Change) |
Day High |
Volume
(% DAV)
(% 50 day avg vol) |
52 Wk Hi
% From Hi |
Featured
Date |
Price
Featured |
Pivot Featured |
|
Max Buy |
 CRL
-
NYSE
CRL
-
NYSE
Charles River Labs Intl
DRUGS - Biotechnology
|
$239.77
|
-0.57
-0.24% |
$243.10
|
260,954
82.84% of 50 DAV
50 DAV is 315,000
|
$257.88
-7.02%
|
7/15/2020
|
$192.66
|
PP = $189.95
|
|
MB = $199.45
|
Most Recent Note - 12/7/2020 7:02:59 PM
G - Still consolidating above its 50 DMA line ($234.72) which has been acting as support. Reported Sep '20 quarterly earnings +38% on +11% sales revenues versus the year ago period, above the +25% minimum earnings guideline (C criteria).
>>> FEATURED STOCK ARTICLE : Consolidating Near Important Support Levels - 11/23/2020 |
View all notes |
Set NEW NOTE alert |
Company Profile |
SEC
News |
Chart |
Request a new note
C
A
S
I |
AMD
-
NASDAQ
Advanced Micro Devices
ELECTRONICS - Semiconductor - Broad Line
|
$91.66
|
+1.83
2.04% |
$92.09
|
33,599,857
68.19% of 50 DAV
50 DAV is 49,277,000
|
$96.37
-4.89%
|
11/18/2020
|
$82.54
|
PP = $88.72
|
|
MB = $93.16
|
Most Recent Note - 12/9/2020 12:45:37 PM
G - Volume totals are cooling while still stubbornly holding ground perched at its all-time high. Its 50 DMA line ($84.14) defines important near term support to watch on pulllbacks.
>>> FEATURED STOCK ARTICLE : Volume Heavy Behind AMD's Breakout from Double Bottom Base - 11/30/2020 |
View all notes |
Set NEW NOTE alert |
Company Profile |
SEC
News |
Chart |
Request a new note
C
A
S
I |
TER
-
NASDAQ
Teradyne Inc
ELECTRONICS - Semiconductor Equipment and Mate
|
$115.68
|
+1.66
1.46% |
$116.14
|
1,617,973
106.38% of 50 DAV
50 DAV is 1,521,000
|
$118.96
-2.76%
|
10/21/2020
|
$92.22
|
PP = $93.54
|
|
MB = $98.22
|
Most Recent Note - 12/7/2020 7:08:00 PM
G - Posted a small gain today with below average volume for another new all-time high. Support to watch on pullbacks is its 50 DMA line and prior highs in the $93 area. See the latest FSU analysis for more details and a new annotated graph.
>>> FEATURED STOCK ARTICLE : Stubbornly Holding Ground and Rising for a New High - 12/7/2020 |
View all notes |
Set NEW NOTE alert |
Company Profile |
SEC
News |
Chart |
Request a new note
C
A
S
I |
TREX
-
NYSE
Trex Company Inc
MATERIALS and CONSTRUCTION - General Building Materials
|
$77.54
|
+0.37
0.48% |
$77.68
|
506,573
68.73% of 50 DAV
50 DAV is 737,000
|
$81.23
-4.54%
|
6/26/2020
|
$54.53
|
PP = $66.47
|
|
MB = $69.79
|
Most Recent Note - 12/9/2020 12:40:35 PM
G - Gapped up today and it is perched within striking distance of its 52-week high. Its 50 DMA line ($74.56) defines near-term support. Recently noted that it reported Sep '20 quarterly earnings +14% on +19% sales revenues versus the year ago period, below the +25% minimum guideline (C criteria) raising fundamental concerns.
>>> FEATURED STOCK ARTICLE : Consolidating Back Above 50-Day Moving Average Line - 12/1/2020 |
View all notes |
Set NEW NOTE alert |
Company Profile |
SEC
News |
Chart |
Request a new note
C
A
S
I |
CLFD
-
NASDAQ
Clearfield Inc
TELECOMMUNICATIONS - Cables / Satalite Equipment
|
$25.63
|
+0.56
2.23% |
$25.86
|
58,975
62.74% of 50 DAV
50 DAV is 94,000
|
$26.54
-3.43%
|
11/17/2020
|
$22.06
|
PP = $26.07
|
|
MB = $27.37
|
 Most Recent Note - 12/10/2020 5:22:57 PM
Y - Posted a gain today with below average volume challenging its 52-week high. Near term support is defined by its 50 DMA line ($22.89) and an upward trendline. A subsequent gain and close above the pivot point backed by at least +40% above average volume is needed to trigger a proper technical buy signal. See the latest FSU analysis for more details and a new annotated graph.
>>> FEATURED STOCK ARTICLE : Perched Near Pivot Point in Need of Confirming Gain on Volume - 12/10/2020 |
View all notes |
Set NEW NOTE alert |
Company Profile |
SEC
News |
Chart |
Request a new note
C
A
S
I |
Symbol/Exchange
Company Name
Industry Group |
PRICE |
CHANGE
(%Change) |
Day High |
Volume
(% DAV)
(% 50 day avg vol) |
52 Wk Hi
% From Hi |
Featured
Date |
Price
Featured |
Pivot Featured |
|
Max Buy |
NOW
-
NYSE
Servicenow Inc
Computer Sftwr-Enterprse
|
$538.00
|
+10.01
1.90% |
$538.56
|
1,024,071
77.88% of 50 DAV
50 DAV is 1,315,000
|
$545.00
-1.28%
|
8/20/2020
|
$453.34
|
PP = $454.79
|
|
MB = $477.53
|
Most Recent Note - 12/7/2020 7:04:35 PM
G - Perched near ita all-time high after finding prompt support near its 50 DMA line. Recently reported Sep '20 quarterly earnings +22% on +30% sales revenues versus the year ago period, below the +25% minimum guideline (C criteria) of the fact-based investment system.
>>> FEATURED STOCK ARTICLE : Consolidating Above 50-Day Average Still Perched Near All-Time High - 11/24/2020 |
View all notes |
Set NEW NOTE alert |
Company Profile |
SEC
News |
Chart |
Request a new note
C
A
S
I |
ALRM
-
NASDAQ
Alarm.com Holdings Inc
Security/Sfty
|
$78.88
|
+2.56
3.35% |
$79.42
|
219,494
62.89% of 50 DAV
50 DAV is 349,000
|
$80.99
-2.61%
|
11/6/2020
|
$71.88
|
PP = $74.76
|
|
MB = $78.50
|
Most Recent Note - 12/10/2020 5:29:42 PM
G - Overcame early weakness and managed a "positive reversal" today, posting a gain with light volume. Perched near its all-time high stubbornly holding its ground. Prior high ($74.66 on 7/23/20) defnes initial support to watch above its 50 DMA line.
>>> FEATURED STOCK ARTICLE : Alarm Hits a New Record High - 12/4/2020 |
View all notes |
Set NEW NOTE alert |
Company Profile |
SEC
News |
Chart |
Request a new note
C
A
S
I |
TEAM
-
NASDAQ
Atlassian Corp Plc Cl A
Comp Sftwr-Spec Enterprs
|
$227.19
|
+3.65
1.63% |
$228.41
|
735,833
38.32% of 50 DAV
50 DAV is 1,920,000
|
$235.17
-3.39%
|
10/12/2020
|
$193.77
|
PP = $199.60
|
|
MB = $209.58
|
Most Recent Note - 12/8/2020 7:18:33 PM
G - Extended from any sound base, it posted another gain with below average volume today for a new all-time high and best-ever close. Reported earnings +7% on +26% sales revenues for the Sep '20 quarter versus the year ago period, well below the +25% minimum earnings guideline (C criteria), raising concerns.
>>> FEATURED STOCK ARTICLE : Quiet Volume Behind Gain Today for a New All-Time High - 11/27/2020 |
View all notes |
Set NEW NOTE alert |
Company Profile |
SEC
News |
Chart |
Request a new note
C
A
S
I |
YETI
-
NYSE
Yeti Holdings Inc
Leisure-Products
|
$71.27
|
+1.65
2.37% |
$72.02
|
1,496,487
122.97% of 50 DAV
50 DAV is 1,217,000
|
$71.49
-0.31%
|
11/5/2020
|
$57.25
|
PP = $55.14
|
|
MB = $57.90
|
Most Recent Note - 12/10/2020 5:27:00 PM
G - Extended from any sound base, and it posted a 4th consecutive gain today while hitting another new all-time high. Its 50 DMA line ($55.82) and prior highs in the $55-54 area define important near-term support to watch on pullbacks.
>>> FEATURED STOCK ARTICLE : Volume Totals Cooloing While Stubbornly Holding Ground at High - 12/2/2020 |
View all notes |
Set NEW NOTE alert |
Company Profile |
SEC
News |
Chart |
Request a new note
C
A
S
I |
BJ
-
NYSE
BJs Wholesale Club Hldgs
Retail-DiscountandVariety
|
$37.94
|
+0.24
0.64% |
$38.20
|
1,935,381
84.91% of 50 DAV
50 DAV is 2,279,200
|
$47.46
-20.06%
|
11/19/2020
|
$42.97
|
PP = $47.56
|
|
MB = $49.94
|
Most Recent Note - 12/9/2020 12:47:02 PM
G - Still sputtering below its 50 DMA line ($40.65). A rebound above the 50 DMA line is needed for its outlook to improve.
>>> FEATURED STOCK ARTICLE : Rebounding Near High With 3rd Strong Quarterly Report - 11/19/2020 |
View all notes |
Set NEW NOTE alert |
Company Profile |
SEC
News |
Chart |
Request a new note
C
A
S
I |
Symbol/Exchange
Company Name
Industry Group |
PRICE |
CHANGE
(%Change) |
Day High |
Volume
(% DAV)
(% 50 day avg vol) |
52 Wk Hi
% From Hi |
Featured
Date |
Price
Featured |
Pivot Featured |
|
Max Buy |
AAXN
-
NASDAQ
Axon Enterprise Inc
Security/Sfty
|
$125.48
|
+2.29
1.86% |
$126.25
|
787,338
150.54% of 50 DAV
50 DAV is 523,000
|
$130.41
-3.78%
|
11/6/2020
|
$122.75
|
PP = $113.00
|
|
MB = $118.65
|
Most Recent Note - 12/10/2020 5:25:03 PM
G - After early weakness it managed a "positive reversal" today for a gain with above average volume. Its 50 DMA line ($111.65) defines near term support to watch on pullbacks. Recently reported Sep '20 quarterly earnings +43% on +27% sales revenues versus the year ago period.
>>> FEATURED STOCK ARTICLE : Volume Totals Cooling While Hovering Near All-Time High - 12/3/2020 |
View all notes |
Set NEW NOTE alert |
Company Profile |
SEC
News |
Chart |
Request a new note
C
A
S
I |
QTWO
-
NYSE
Q2 Holdings Inc
Computer Sftwr-Financial
|
$115.33
|
+2.33
2.06% |
$115.60
|
377,762
92.59% of 50 DAV
50 DAV is 408,000
|
$119.97
-3.87%
|
11/12/2020
|
$105.14
|
PP = $106.54
|
|
MB = $111.87
|
Most Recent Note - 12/8/2020 7:16:58 PM
G - Posted a small gain today with above average volume while hovering above its "max buy" level and near its all-time high. Prior high in the $106 area and its 50 DMA line ($102) define important near term suport to watch on pullbacks. See the latest FSU analysis for more details and a new annotated graph.
>>> FEATURED STOCK ARTICLE : Computer Software - Financial Firm Hovering Near Record High - 12/8/2020 |
View all notes |
Set NEW NOTE alert |
Company Profile |
SEC
News |
Chart |
Request a new note
C
A
S
I |
|
|
|
THESE ARE NOT BUY RECOMMENDATIONS!
Comments contained in the body of this report are technical
opinions only. The material herein has been obtained
from sources believed to be reliable and accurate, however,
its accuracy and completeness cannot be guaranteed.
This site is not an investment advisor, hence it does
not endorse or recommend any securities or other investments.
Any recommendation contained in this report may not
be suitable for all investors and it is not to be deemed
an offer or solicitation on our part with respect to
the purchase or sale of any securities. All trademarks,
service marks and trade names appearing in this report
are the property of their respective owners, and are
likewise used for identification purposes only.
This report is a service available
only to active Paid Premium Members.
You may opt-out of receiving report notifications
at any time. Questions or comments may be submitted
by writing to Premium Membership Services 665 S.E. 10 Street, Suite 201 Deerfield Beach, FL 33441-5634 or by calling 1-800-965-8307
or 954-785-1121.
|
|
|