You are not logged in.
This means you
CAN ONLY VIEW reports that were published prior to Thursday, March 20, 2025.
You
MUST UPGRADE YOUR MEMBERSHIP if you want to see any current reports.
AFTER MARKET UPDATE - MONDAY, MARCH 29TH, 2021
Previous After Market Report Next After Market Report >>>
|
|
|
|
DOW |
+98.49 |
33,171.37 |
+0.30% |
|
Volume |
1,092,192,374 |
-4% |
|
Volume |
4,818,632,200 |
-6% |
|
NASDAQ |
-81.57 |
13,057.15 |
-0.62% |
|
Advancers |
1,275 |
35% |
|
Advancers |
1,033 |
25% |
|
S&P 500 |
-3.44 |
3,971.10 |
-0.09% |
|
Decliners |
2,374 |
65% |
|
Decliners |
3,070 |
75% |
|
Russell 2000 |
-62.80 |
2,158.68 |
-2.83% |
|
52 Wk Highs |
211 |
|
|
52 Wk Highs |
128 |
|
|
S&P 600 |
-34.46 |
1,296.80 |
-2.59% |
|
52 Wk Lows |
20 |
|
|
52 Wk Lows |
71 |
|
|
 |
Leadership Improved But Major Indices Ended Mixed
Kenneth J. Gruneisen - Passed the CAN SLIM® Master's Exam
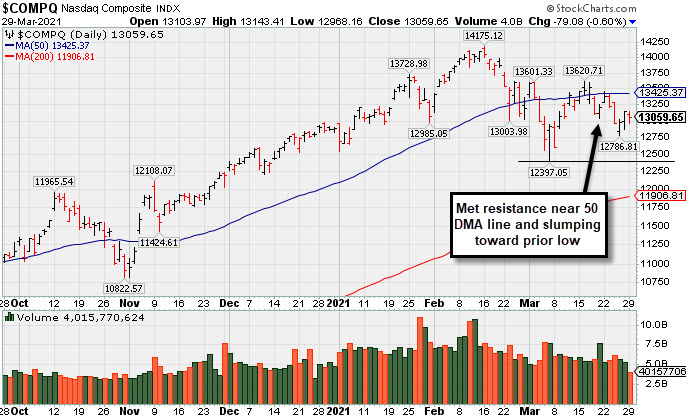
The S&P 500 drifted down 0.1% from its record level notched on Friday, while the Nasdaq Composite dipped 0.6%. The Dow added 98 points, closing at a new all-time high. The volume totals were lighter than the prior session totals on the NYSE and on the Nasdaq exchange. Breadth was negative as decliners led advancers by almost a 2-1 margin on the NYSE and by a 3-1 margin on the Nasdaq exchange. Leadership improved as there were 42 high-ranked companies from the Leaders List that hit new 52-week highs and were listed on the BreakOuts Page, versus the total of 29 on the prior session. New 52-week highs totals improved and outnumbered new 52-week lows totals on both the NYSE and the Nasdaq exchange. The major indices (M criteria) are in an uptrend under pressure. Investors are reminded to always make buying and selling decisions on case-by-case basis under the strict criteria and rules of the fact-based investment system.
PICTURED: The Nasdaq Composite Index met resistance near its 50-day moving average (DMA) line and is slumping toward the prior low.
U.S. stocks finished mixed on Monday as Wall Street assessed the potential impact to financial markets in the aftermath of Archegos Capital Management fallout. Last week, the U.S. hedge fund defaulted on margin calls, unwinding $20 billion in U.S. media and Chinese tech giants. Southwest Airlines (LUV -0.54%) placed a large order for Boeing’s (BA +2.31%) 737-MAX aircrafts.
Six of 11 S&P 500 sectors closed in negative territory, with Energy and Financials lagging the most. ViacomCBS (VIAC -6.68%) fell, while Discovery (DISCA -1.60%) edged lower after each stock fell by roughly 27% on Friday as a result of the Archegos Capital Management liquidations. Selling was heavier in investment banks tied to the hedge fund’s fallout, with Nomura (NMR -14.07%) and Credit Suisse Group AG Adr (CS -11.50%).
In commodities, WTI crude jumped 1% to $61.57/barrel despite news that traffic has resumed in the Suez Canal as the stranded cargo ship was successfully refloated. Still, prices were buoyed by the expectation that OPEC and its allies may extend production cuts, along with optimism surrounding the COVID-19 vaccine rollout. President Biden announced that 90% of American adults would be eligible for immunization by April 19. Treasuries weakened with the yield on the 10-year note up four basis points to 1.71%. On the data front, the lone economic release of note today revealed manufacturing activity in the Dallas Fed region unexpectedly improved in March. |
 Kenneth J. Gruneisen started out as a licensed stockbroker in August 1987, a couple of months prior to the historic stock market crash that took the Dow Jones Industrial Average down -22.6% in a single day. He has published daily fact-based fundamental and technical analysis on high-ranked stocks online for two decades. Through FACTBASEDINVESTING.COM, Kenneth provides educational articles, news, market commentary, and other information regarding proven investment systems that work in good times and bad.
Comments contained in the body of this report are technical opinions only and are not necessarily those of Gruneisen Growth Corp. The material herein has been obtained from sources believed to be reliable and accurate, however, its accuracy and completeness cannot be guaranteed. Our firm, employees, and customers may effect transactions, including transactions contrary to any recommendation herein, or have positions in the securities mentioned herein or options with respect thereto. Any recommendation contained in this report may not be suitable for all investors and it is not to be deemed an offer or solicitation on our part with respect to the purchase or sale of any securities. |
|
 |
Financial, Tech, and Energy-Linked Groups Fell
Kenneth J. Gruneisen - Passed the CAN SLIM® Master's Exam
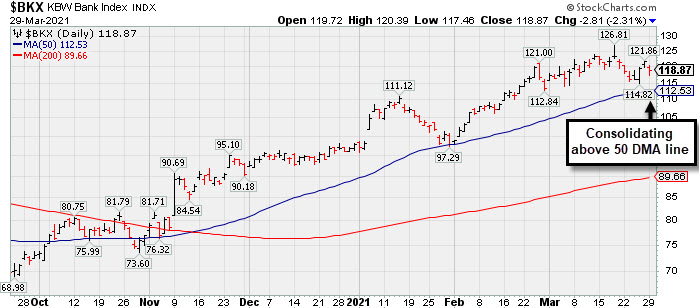
The Broker/Dealer Index ($XBD -2.01%) and Bank Index ($BKX -2.31%) created a drag on the major averages while the Retail Index ($RLX +0.03%) finished flat. The Biotech Index ($BTK -1.12%), Semiconductor Index ($SOX -1.72%), and Networking Index ($NWX -2.27%) suffered unanimous losses. The Oil Services Index ($OSX -3.18%) outpaced the Integrated Oil Index ($XOI -1.18%) to the downside and the Gold & Silver Index ($XAU +0.01%) finished flat.PICTURED: The Bank Index ($BKX -2.31%) is consolidating above its 50-day moving average (DMA) line.
| Oil Services |
$OSX |
53.28 |
-1.75 |
-3.18% |
+20.19% |
| Integrated Oil |
$XOI |
1,021.20 |
-12.23 |
-1.18% |
+28.86% |
| Semiconductor |
$SOX |
3,052.72 |
-53.56 |
-1.72% |
+9.20% |
| Networking |
$NWX |
802.37 |
-18.60 |
-2.27% |
+11.89% |
| Broker/Dealer |
$XBD |
435.08 |
-8.92 |
-2.01% |
+15.22% |
| Retail |
$RLX |
3,629.50 |
+1.24 |
+0.03% |
+1.86% |
| Gold & Silver |
$XAU |
135.88 |
+0.01 |
+0.01% |
-5.76% |
| Bank |
$BKX |
118.87 |
-2.81 |
-2.31% |
+21.40% |
| Biotech |
$BTK |
5,409.90 |
-61.23 |
-1.12% |
-5.73% |
|
|
|
 |
Fell Further Below 50-Day Average Testing Near Old High
Kenneth J. Gruneisen - Passed the CAN SLIM® Master's Exam
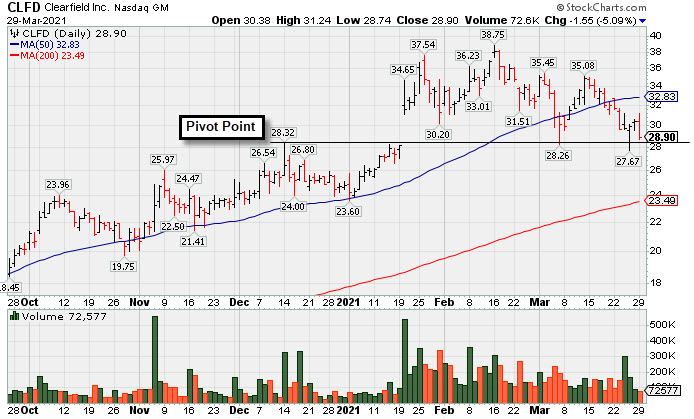
Clearfield Inc (CLFD -$1.55 or -5.09% to $28.90) slumped and closed further below its 50-day moving average (DMA) line ($32.83) today, testing support at prior highs in the $28 area. More damaging losses would raise greater concerns. It will be dropped from the Featured Stocks list tonight. A rebound above the 50 DMA line is needed for its outlook to improve.
Fundamentals remain strong. The high-ranked TELECOMMUNICATIONS - Fiber Optics firm reported Dec '20 quarterly earnings +475% on +40% sales revenues versus the year ago period, continuing its strong earning track record with a 4th consecutive quarterly earnings comparison above the +25% minimum guideline (C criteria). Annual earnings (A criteria) history has improved after a downturn in FY '17.
CLFD traded up as much as 74.2% since highlighted in yellow with pivot point cited based on its 11/09/20 high plus 10 cents in the 11/17/20 mid-day report (read here). It was last shown in this FSU section on 3/09/21 with an annotated graph under the headline, "Quiet Gain Repaired 50-Day Moving Average Violation".
The number of top-rated funds owning its shares rose from 132 in Jun '20 to 152 in Dec '20. Its current Up/Down Volume Ratio of 1.3 is an unbiased indication its shares have been under accumulation over the past 50 days. Its Accumulation/Distribution Rating is C- and Timeliness Rating is B, and its Sponsorship Rating is C.
|
|
|
Color Codes Explained :
Y - Better candidates highlighted by our
staff of experts.
G - Previously featured
in past reports as yellow but may no longer be buyable under the
guidelines.
***Last / Change / Volume data in this table is the closing quote data***
Symbol/Exchange
Company Name
Industry Group |
PRICE |
CHANGE
(%Change) |
Day High |
Volume
(% DAV)
(% 50 day avg vol) |
52 Wk Hi
% From Hi |
Featured
Date |
Price
Featured |
Pivot Featured |
|
Max Buy |
 FBC
-
NYSE
FBC
-
NYSE
Flagstar Bancorp Inc
BANKING - Savings and Loans
|
$44.89
|
-0.11
-0.24% |
$45.49
|
551,786
82.48% of 50 DAV
50 DAV is 669,000
|
$51.58
-12.97%
|
3/4/2021
|
$47.26
|
PP = $48.02
|
|
MB = $50.42
|
 Most Recent Note - 3/29/2021 5:20:46 PM
G - Still sputtering below its 50 DMA line ($45.70) Only a prompt rebound would help its outlook improve. Near-term support to watch is prior lows.
>>> FEATURED STOCK ARTICLE : Slumping Into Prior Base Following Breakout - 3/22/2021 |
View all notes |
Set NEW NOTE alert |
Company Profile |
SEC
News |
Chart |
Request a new note
C
A
S
I |
CRL
-
NYSE
Charles River Labs Intl
DRUGS - Biotechnology
|
$282.95
|
-5.09
-1.77% |
$289.56
|
224,771
71.56% of 50 DAV
50 DAV is 314,100
|
$303.79
-6.86%
|
12/17/2020
|
$247.06
|
PP = $257.98
|
|
MB = $270.88
|
Most Recent Note - 3/29/2021 5:19:13 PM
G - Today's loss had lighter volume. Consolidating above its 50 DMA line ($280) which acted as support throughout its ongoing ascent. Its Relative Strength Rating is 75, below the 80+ minimum guideline for buy candidates. Recently reported Dec '20 quarterly earnings +19% on +14% sales revenues versus the year ago period, below the +25% minimum earnings guideline (C criteria), raising fundamental concerns.
>>> FEATURED STOCK ARTICLE : Made Gradual Progress, Now Extended From Any Sound Base - 3/16/2021 |
View all notes |
Set NEW NOTE alert |
Company Profile |
SEC
News |
Chart |
Request a new note
C
A
S
I |
OPY
-
NYSE
Oppenheimer Holdings Inc
FINANCIAL SERVICES - Investment Brokerage - Regiona
|
$39.37
|
-0.75
-1.87% |
$40.29
|
150,910
110.96% of 50 DAV
50 DAV is 136,000
|
$44.38
-11.29%
|
2/25/2021
|
$38.95
|
PP = $38.11
|
|
MB = $40.02
|
Most Recent Note - 3/25/2021 11:38:35 AM
Y - Pulling back for a 5th consecutive loss, consolidating after getting extended from the previously noted base. Its 50 DMA line ($37.53) defines near-term support to watch.
>>> FEATURED STOCK ARTICLE : Perched at Record High After 6 Consecutive Gains - 3/12/2021 |
View all notes |
Set NEW NOTE alert |
Company Profile |
SEC
News |
Chart |
Request a new note
C
A
S
I |
CLFD
-
NASDAQ
Clearfield Inc
TELECOMMUNICATIONS - Cables / Satalite Equipment
|
$28.90
|
-1.55
-5.09% |
$31.24
|
72,576
39.44% of 50 DAV
50 DAV is 184,000
|
$38.75
-25.42%
|
1/20/2021
|
$31.38
|
PP = $28.42
|
|
MB = $29.84
|
Most Recent Note - 3/29/2021 5:14:41 PM
Erased an early gain and closed further below its 50 DMA line ($32.83) with today's big loss on lighter volume. Testing prior highs in the $28 area that previously acted as support. It will be dropped from the Featured Stocks list tonight. A rebound above the 50 DMA line is needed for its outlook to improve. Fundamentals remain strong. See the latest FSU analysis for more details and a new annotated graph.
>>> FEATURED STOCK ARTICLE : Fell Further Below 50-Day Average Testing Near Old High - 3/29/2021 |
View all notes |
Set NEW NOTE alert |
Company Profile |
SEC
News |
Chart |
Request a new note
C
A
S
I |
EDUC
-
NASDAQ
Educational Development
WHOLESALE - Basic Materials Wholesale
|
$18.13
|
+0.83
4.80% |
$18.99
|
38,361
100.95% of 50 DAV
50 DAV is 38,000
|
$20.00
-9.35%
|
3/10/2021
|
$17.89
|
PP = $20.10
|
|
MB = $21.11
|
Most Recent Note - 3/29/2021 12:23:02 PM
Y - Found support above its 50 DMA line ($16.12) and rising toward its 52-week high with today's gain backed by higher volume. Subsequent gains above the pivot point backed by at least +40% above average volume are needed to trigger a proper technical buy signal. This thinly traded Media - Books firm's annual earnings (A criteria) history has strong.
>>> FEATURED STOCK ARTICLE : Gain Leaves Media - Books Firm Perched Near Pivot Point - 3/10/2021 |
View all notes |
Set NEW NOTE alert |
Company Profile |
SEC
News |
Chart |
Request a new note
C
A
S
I |
Symbol/Exchange
Company Name
Industry Group |
PRICE |
CHANGE
(%Change) |
Day High |
Volume
(% DAV)
(% 50 day avg vol) |
52 Wk Hi
% From Hi |
Featured
Date |
Price
Featured |
Pivot Featured |
|
Max Buy |
SMPL
-
NASDAQ
Simply Good Foods Co
Food-Confectionery
|
$29.77
|
-0.93
-3.03% |
$30.70
|
649,310
92.61% of 50 DAV
50 DAV is 701,100
|
$35.25
-15.55%
|
12/28/2020
|
$30.40
|
PP = $31.44
|
|
MB = $33.01
|
Most Recent Note - 3/26/2021 5:33:14 PM
G - Today's gain helped it rebound and close well above its 50 DMA line ($29.80) helping its outlook improve. However, its Relative Strength Rating is still 63, below the 80+ minimum guideline for buy candidates. Faces resistance due to overhead supply up to the $35 level.
>>> FEATURED STOCK ARTICLE : Violation of 50-Day Moving Average Triggered Technical Sell Signal - 3/24/2021 |
View all notes |
Set NEW NOTE alert |
Company Profile |
SEC
News |
Chart |
Request a new note
C
A
S
I |
XPEL
-
NASDAQ
Xpel Inc
Auto/Truck-Tires andamp; Misc
|
$50.71
|
-2.15
-4.07% |
$53.57
|
140,786
47.40% of 50 DAV
50 DAV is 297,000
|
$65.74
-22.86%
|
3/11/2021
|
$59.70
|
PP = $60.87
|
|
MB = $63.91
|
Most Recent Note - 3/29/2021 5:17:50 PM
Slumped back to close further below its 50 DMA line ($53.61) hurting its outlook. Faces resistance due to overhead supply up to the $65 level. It will be dropped from the Featured Stocks list tonight.
>>> FEATURED STOCK ARTICLE : Powerful Breakout Backed by Heavy Volume - 3/11/2021 |
View all notes |
Set NEW NOTE alert |
Company Profile |
SEC
News |
Chart |
Request a new note
C
A
S
I |
UI
-
NYSE
Ubiquiti Inc
Telecom-Infrastructure
|
$376.78
|
-13.10
-3.36% |
$401.81
|
174,626
149.25% of 50 DAV
50 DAV is 117,000
|
$396.00
-4.85%
|
3/26/2021
|
$383.00
|
PP = $362.99
|
|
MB = $381.14
|
Most Recent Note - 3/29/2021 12:57:23 PM
Y - Perched at its all-time high. Finished strong after highlighted in yellow with pivot point cited based on its 2/10/21 high plus 10 cents in the 3/26/21 mid-day report. Gapped up and powered into new all-time high territory with a considerable gain backed by +231% above average volume triggering a technical buy signal. Found support above its 50 DMA line since noted in the 2/05/21 mid-day report. Earnings rose +81% on +56% sales revenues for the Dec '20 quarter versus the year ago period. Recent quarterly comparisons show accelerating sales revenues and strong earnings growth near or well above the +25% minimum guideline (C criteria). See the latest FSU analysis for more details and an annotated graph.
>>> FEATURED STOCK ARTICLE : Volume +231% Above Average With Breakout Gain - 3/26/2021 |
View all notes |
Set NEW NOTE alert |
Company Profile |
SEC
News |
Chart |
Request a new note
C
A
S
I |
DT
-
NYSE
Dynatrace Inc
Computer Sftwr-Enterprse
|
$46.75
|
-0.58
-1.23% |
$47.50
|
2,653,837
100.22% of 50 DAV
50 DAV is 2,648,000
|
$56.94
-17.90%
|
2/4/2021
|
$51.39
|
PP = $48.95
|
|
MB = $51.40
|
Most Recent Note - 3/24/2021 6:07:05 PM
G - Color code is changed to green after today's big loss violated its 50 DMA line ($49.46) raising concerns. Prior highs in the $48 area help define import near-term support. More damaging losses would raise serious concerns. Its Relative Strength Rating has slumped to 54, well below the 80+ minimum guideline for buy candidates. Fundamentals remain strong after it reported Dec '20 earnings +70% on +28% sales revenues versus the year ago period.
>>> FEATURED STOCK ARTICLE : 50-Day Moving Average Line Tested Again - 3/19/2021 |
View all notes |
Set NEW NOTE alert |
Company Profile |
SEC
News |
Chart |
Request a new note
C
A
S
I |
MRBK
-
NASDAQ
Meridian Corp
Banks-Northeast
|
$25.38
|
-0.70
-2.68% |
$26.19
|
25,916
74.05% of 50 DAV
50 DAV is 35,000
|
$27.96
-9.23%
|
2/22/2021
|
$25.58
|
PP = $26.10
|
|
MB = $27.41
|
Most Recent Note - 3/29/2021 5:22:52 PM
Y - Its 50 DMA line ($23.84) defines important near-term support to watch. Its Relative Strength Rating has slumped to 77, below the 80+ minimum guideline.
>>> FEATURED STOCK ARTICLE : Prior High Defines Initial Support to Watch - 3/15/2021 |
View all notes |
Set NEW NOTE alert |
Company Profile |
SEC
News |
Chart |
Request a new note
C
A
S
I |
Symbol/Exchange
Company Name
Industry Group |
PRICE |
CHANGE
(%Change) |
Day High |
Volume
(% DAV)
(% 50 day avg vol) |
52 Wk Hi
% From Hi |
Featured
Date |
Price
Featured |
Pivot Featured |
|
Max Buy |
|
|
|
THESE ARE NOT BUY RECOMMENDATIONS!
Comments contained in the body of this report are technical
opinions only. The material herein has been obtained
from sources believed to be reliable and accurate, however,
its accuracy and completeness cannot be guaranteed.
This site is not an investment advisor, hence it does
not endorse or recommend any securities or other investments.
Any recommendation contained in this report may not
be suitable for all investors and it is not to be deemed
an offer or solicitation on our part with respect to
the purchase or sale of any securities. All trademarks,
service marks and trade names appearing in this report
are the property of their respective owners, and are
likewise used for identification purposes only.
This report is a service available
only to active Paid Premium Members.
You may opt-out of receiving report notifications
at any time. Questions or comments may be submitted
by writing to Premium Membership Services 665 S.E. 10 Street, Suite 201 Deerfield Beach, FL 33441-5634 or by calling 1-800-965-8307
or 954-785-1121.
|
|
|