You are not logged in.
This means you
CAN ONLY VIEW reports that were published prior to Monday, March 24, 2025.
You
MUST UPGRADE YOUR MEMBERSHIP if you want to see any current reports.
AFTER MARKET UPDATE - WEDNESDAY, AUGUST 17TH, 2022
Previous After Market Report Next After Market Report >>>
|
|
|
|
DOW |
-171.69 |
33,980.32 |
-0.50% |
|
Volume |
775,638,907 |
-3% |
|
Volume |
5,116,252,900 |
+3% |
|
NASDAQ |
-164.43 |
12,938.12 |
-1.25% |
|
Advancers |
612 |
20% |
|
Advancers |
1,130 |
26% |
|
S&P 500 |
-31.16 |
4,274.04 |
-0.72% |
|
Decliners |
2,477 |
80% |
|
Decliners |
3,136 |
73% |
|
Russell 2000 |
-33.22 |
1,987.31 |
-1.64% |
|
52 Wk Highs |
35 |
|
|
52 Wk Highs |
50 |
|
|
S&P 600 |
-17.29 |
1,280.54 |
-1.33% |
|
52 Wk Lows |
34 |
|
|
52 Wk Lows |
75 |
|
|
 |
Breadth Negative as Major Averages Sputtered
Kenneth J. Gruneisen - Passed the CAN SLIM® Master's Exam
The Dow lost 171 points, snapping a five-session winning streak. The S&P 500 shed 0.7% after approaching its 200-day moving average (a closely watched technical level) on Tuesday. Yesterday, the broad benchmark eclipsed the 4,300 level for the first time since late April. The Nasdaq Composite fell 1.3% amid weakness in mega-cap tech shares. The volume totals reported were mixed, lighter than the prior session on the NYSE and higher on the Nasdaq exchange. Decliners led advancers by a 4-1 margin on the NYSE ad by a 3-1 margin on the Nasdaq exchange. There were 17 high-ranked companies from the Leaders List that hit new 52-week highs and were listed on the BreakOuts Page, down from the total of 45 on the prior session. New 52-week highs outnumbered new 52-week lows on the NYSE, but new lows outnumbered new highs on the Nasdaq exchange. The market is in a confirmed uptrend (M criteria). Any sustainable rally requires a healthy crop of leading stocks hitting new highs, so the recent improvement in leadership was a reassuring sign.
Chart courtesy of www.stockcharts.com on Tuesday. Yesterday, the broad benchmark eclipsed the 4,300 level for the first time since late April. The Nasdaq Composite fell 1.3% amid weakness in mega-cap tech shares. The volume totals reported were mixed, lighter than the prior session on the NYSE and higher on the Nasdaq exchange. Decliners led advancers by a 4-1 margin on the NYSE ad by a 3-1 margin on the Nasdaq exchange. There were 17 high-ranked companies from the Leaders List that hit new 52-week highs and were listed on the BreakOuts Page, down from the total of 45 on the prior session. New 52-week highs outnumbered new 52-week lows on the NYSE, but new lows outnumbered new highs on the Nasdaq exchange. The market is in a confirmed uptrend (M criteria). Any sustainable rally requires a healthy crop of leading stocks hitting new highs, so the recent improvement in leadership was a reassuring sign.) 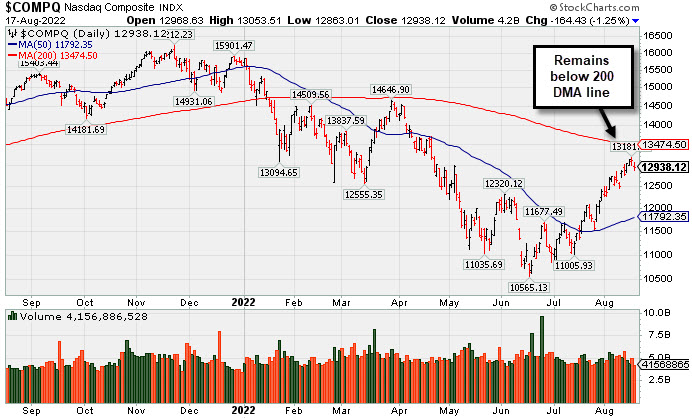 PICTURED: The Nasdaq Composite Index pulled back for a 2nd consecutive loss. It remains below its downward sloping 200-day moving average (DMA) line.
U.S. stocks declined on Wednesday, though finished off session lows. The major averages trimmed earlier losses after the minutes from the July Federal Reserve (Fed) meeting suggested the pace of interest rate hikes could eventually slow as officials weighed the impact of monetary tightening. Still, policymakers anticipated that further rate increases would be warranted to quell inflation.
A key retail earnings report dampened the mood early in the session. Target Corp. (TGT -2.69%) fell after its profit fell well below even the lowest analyst estimate as the company scrambled to reduce excess inventory. Elsewhere, Lowe’s Cos Inc. (LOW +0.58%) offered a bright spot, with the home improvement retailer posting better-than-expected profit and offering upbeat guidance despite a downturn in the housing market.
Ten of 11 S&P 500 sectors closed in negative territory, with Energy bucking the downtrend. West Texas Intermediate crude gained 1.3% to $87.69/barrel as a larger-than-forecasted drawdown in weekly domestic stockpiles helped offset lingering demand concerns.
Treasuries retreated in tandem with global sovereign debt after the U.K.’s Consumer Price Index (CPI) surged 10.1% year-over-year in July, the fastest pace since 1982. The yield on the 10-year Treasury note jumped eight basis points (0.08%) to 2.89%. On the domestic data front, retail sales held steady in July, slowing from the prior month’s 0.8% advance. |
 Kenneth J. Gruneisen started out as a licensed stockbroker in August 1987, a couple of months prior to the historic stock market crash that took the Dow Jones Industrial Average down -22.6% in a single day. He has published daily fact-based fundamental and technical analysis on high-ranked stocks online for two decades. Through FACTBASEDINVESTING.COM, Kenneth provides educational articles, news, market commentary, and other information regarding proven investment systems that work in good times and bad.
Comments contained in the body of this report are technical opinions only and are not necessarily those of Gruneisen Growth Corp. The material herein has been obtained from sources believed to be reliable and accurate, however, its accuracy and completeness cannot be guaranteed. Our firm, employees, and customers may effect transactions, including transactions contrary to any recommendation herein, or have positions in the securities mentioned herein or options with respect thereto. Any recommendation contained in this report may not be suitable for all investors and it is not to be deemed an offer or solicitation on our part with respect to the purchase or sale of any securities. |
|
 |
Tech, Retail, Financial, and Gold & Silver Indexes Fell
Kenneth J. Gruneisen - Passed the CAN SLIM® Master's Exam
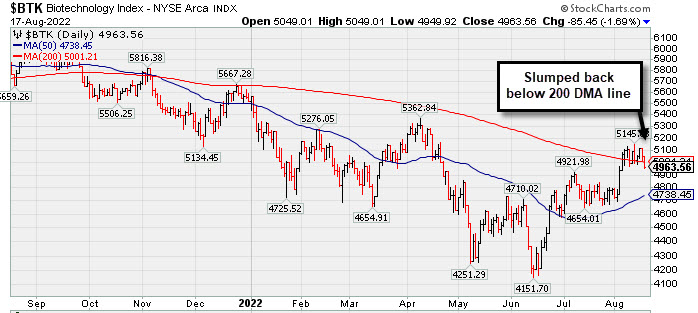
The Broker/Dealer Index ($XBD -0.43%), Bank Index ($BKX -1.00%) and Retail Index ($RLX -1.16%) suffered unanimous losses. The tech sector also had a negative bias as the Semiconductor Index ($SOX -2.48%), Biotech Index ($BTK -1.69%), and Networking Index ($NWX -1.54%) each lost ground. The Gold & Silver Index ($XAU -3.72%) was a standout decliner. The Integrated Oil Index ($XOI +1.16%) outpaced the Oil Services Index ($OSX +0.19%) while the energy group had a positive bias.
PICTURED: The Biotech Index ($BTK -1.69%) pulled back and slumped below its downward sloping 200-day moving average (DMA) line.
| Oil Services |
$OSX |
66.65 |
+0.12 |
+0.19% |
+26.43% |
| Integrated Oil |
$XOI |
1,592.98 |
+18.21 |
+1.16% |
+35.20% |
| Semiconductor |
$SOX |
2,970.12 |
-75.53 |
-2.48% |
-24.73% |
| Networking |
$NWX |
832.15 |
-13.01 |
-1.54% |
-14.31% |
| Broker/Dealer |
$XBD |
468.45 |
-2.01 |
-0.43% |
-3.78% |
| Retail |
$RLX |
3,587.63 |
-42.08 |
-1.16% |
-15.12% |
| Gold & Silver |
$XAU |
106.00 |
-4.09 |
-3.72% |
-19.97% |
| Bank |
$BKX |
114.39 |
-1.16 |
-1.00% |
-13.48% |
| Biotech |
$BTK |
4,963.56 |
-85.45 |
-1.69% |
-10.06% |
|
|
|
 |
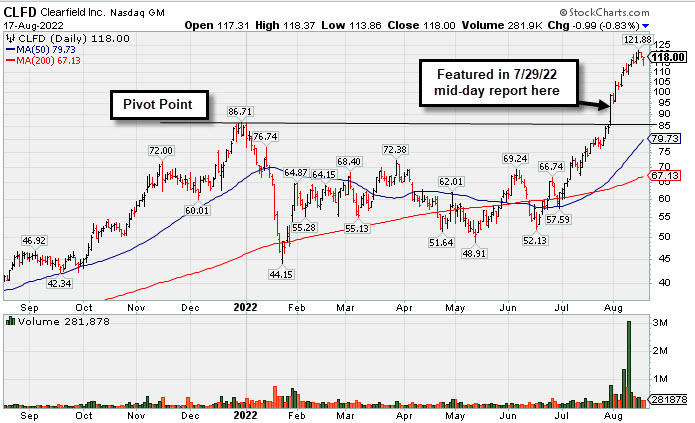
Clearfield Showed Resilience After Considerable Rally
Kenneth J. Gruneisen - Passed the CAN SLIM® Master's Exam
Clearfield Inc (CLFD -$0.99 or -0.83% to $118.00) gapped down today retreating from its all-time high, however, it rebounded to close near the session high. It is very extended from any sound base. The prior high in the $86 area defines initial support to watch.
CLFD finished strong after highlighted in yellow with pivot point cited based on its 12/30/21 high plus 10 cents in the 7/29/22 mid-day report (read here). More detailed analysis was shown that evening with an annotated graph under the headline "Volume Heavy Behind Technical Breakout".
CLFD has the highest possible Earnings Per Share Rating of 99. Fundamentals remain strong after it reported Jun '22 quarterly earnings +109% on +84% sales revenues above the year ago period. Annual earnings (A criteria) growth has been strong after a downturn in FY '17.
The TELECOMMUNICATIONS - Fiber Optics group is currently ranked 29th on the 197 Industry Groups list (L criteria). There are only 13.8 million shares outstanding (S criteria) which can contribute to greater price volatility in the event of institutional buying or selling. The number of top-rated funds owning its shares rose from 132 in Jun '20 to 261 in Jun '22, a reassuring sign concerning the I criteria. Its current Up/Down Volume Ratio of 2.3 is an unbiased indication its shares have been under accumulation over the past 50 days. Its Accumulation/Distribution Rating is A+, Timeliness Rating is A, and its Sponsorship Rating is B.
|
|
|
Color Codes Explained :
Y - Better candidates highlighted by our
staff of experts.
G - Previously featured
in past reports as yellow but may no longer be buyable under the
guidelines.
***Last / Change / Volume data in this table is the closing quote data***
Symbol/Exchange
Company Name
Industry Group |
PRICE |
CHANGE
(%Change) |
Day High |
Volume
(% DAV)
(% 50 day avg vol) |
52 Wk Hi
% From Hi |
Featured
Date |
Price
Featured |
Pivot Featured |
|
Max Buy |
 IMXI
-
NASDAQ
IMXI
-
NASDAQ
International Money Exp
Financial Svcs-Specialty
|
$25.35
|
+0.35
1.40% |
$25.37
|
326,038
63.56% of 50 DAV
50 DAV is 513,000
|
$26.11
-2.91%
|
7/1/2022
|
$21.27
|
PP = $21.38
|
|
MB = $22.45
|
Most Recent Note - 8/16/2022 6:13:52 PM
G - Perched near its all-time high, extended from the previously noted base. Prior highs in the $22 area and its 50 DMA line ($22.13) define important near-term support to watch. Reported Jun '22 quarterly earnings +21% on +17% sales revenues versus the year ago period, below the +25% minimum earnings guideline (C criteria).
>>> FEATURED STOCK ARTICLE : Finished Strong With Another Volume-Driven Gain After Earnings - 8/3/2022 |
View all notes |
Set NEW NOTE alert |
Company Profile |
SEC
News |
Chart |
Request a new note
C
A
S
I |
HRMY
-
NASDAQ
Harmony Biosciences Holdings
Medical-Biomed/Biotech
|
$46.55
|
-3.56
-7.10% |
$49.76
|
1,005,137
176.65% of 50 DAV
50 DAV is 569,000
|
$57.13
-18.52%
|
7/6/2022
|
$54.12
|
PP = $52.85
|
|
MB = $55.49
|
 Most Recent Note - 8/17/2022 10:33:59 AM
G - Color code is changed to green after it gapped down today violating its 50 DMA line ($50.56) and prior low ($48.85) with a damaging loss raising concerns and triggering a technical sell signal. Only a prompt rebound above the 50 DMA line would help its outlook improve. Met stubborn resistance in the $57 area after reporting Jun '22 quarterly earnings +54% on +45% sales revenues versus the year ago period.
>>> FEATURED STOCK ARTICLE : Churning Higher Volume While Perched Near High After Earnings News - 8/4/2022 |
View all notes |
Set NEW NOTE alert |
Company Profile |
SEC
News |
Chart |
Request a new note
C
A
S
I |
CI
-
NYSE
Cigna Corp
Medical-Managed Care
|
$291.60
|
+0.99
0.34% |
$293.38
|
1,104,086
54.42% of 50 DAV
50 DAV is 2,029,000
|
$293.50
-0.65%
|
7/7/2022
|
$276.55
|
PP = $273.68
|
|
MB = $287.36
|
Most Recent Note - 8/16/2022 6:19:29 PM
G - Hovering at its all-time high holding its ground after rising above its "max buy" level. Reported earnings for the Jun '22 quarter rose +19% on +5% sales revenues versus the year ago period, breaking a streak of 3 quarterly earnings increases above the +25% minimum guideline (C criteria), raising concerns. Near-term support to watch is at its 50 DMA line ($269.11).
>>> FEATURED STOCK ARTICLE : Wedging Higher With Lighter Volume Behind Gain for New High - 8/9/2022 |
View all notes |
Set NEW NOTE alert |
Company Profile |
SEC
News |
Chart |
Request a new note
C
A
S
I |
AN
-
NYSE
Autonation Inc
SPECIALTY RETAIL - Auto Dealerships
|
$127.20
|
-5.29
-3.99% |
$131.30
|
572,371
80.73% of 50 DAV
50 DAV is 709,000
|
$135.57
-6.17%
|
7/20/2022
|
$122.03
|
PP = $126.49
|
|
MB = $132.81
|
Most Recent Note - 8/17/2022 4:57:27 PM
Y - Abruptly retreated today with below average volume, retesting prior highs which define initial support to watch. Big gain on the prior session backed by +46% above average volume cleared resistance in the $126 area triggering a technical buy signal. Faces no resistance due to overhead supply. Reported Jun '22 quarterly earnings +34% on -2% sales revenues versus the year ago period.
>>> FEATURED STOCK ARTICLE : Autonation Hovering Near Stubborn Resistance - 8/11/2022 |
View all notes |
Set NEW NOTE alert |
Company Profile |
SEC
News |
Chart |
Request a new note
C
A
S
I |
ESQ
-
NASDAQ
Esquire Financial Hldgs
Finance-Commercial Loans
|
$40.21
|
+0.03
0.07% |
$40.52
|
34,806
57.06% of 50 DAV
50 DAV is 61,000
|
$41.68
-3.53%
|
7/26/2022
|
$37.74
|
PP = $39.19
|
|
MB = $41.15
|
Most Recent Note - 8/16/2022 6:17:58 PM
Y - Encountered distributional pressure as there was a "negative reversal" today with +112% above average volume after hitting a new all-time high. It closed near the session low. Wedged above resistance in the $39 area with gains lacking volume conviction. Confirming gains above the pivot point backed by at least +40% above average volume may help clinch a proper technical buy signal. Its 50 DMA line ($35.51) defines important near-term support.
>>> FEATURED STOCK ARTICLE : Closed at Session High With Gain for New All-Time High - 8/12/2022 |
View all notes |
Set NEW NOTE alert |
Company Profile |
SEC
News |
Chart |
Request a new note
C
A
S
I |
Symbol/Exchange
Company Name
Industry Group |
PRICE |
CHANGE
(%Change) |
Day High |
Volume
(% DAV)
(% 50 day avg vol) |
52 Wk Hi
% From Hi |
Featured
Date |
Price
Featured |
Pivot Featured |
|
Max Buy |
GPK
-
NYSE
Graphic Packaging Hldg
CONSUMER NON-DURABLES - Packaging and Containers
|
$23.35
|
-0.19
-0.81% |
$23.49
|
2,155,698
72.36% of 50 DAV
50 DAV is 2,979,000
|
$23.64
-1.23%
|
7/26/2022
|
$22.63
|
PP = $23.09
|
|
MB = $24.24
|
Most Recent Note - 8/15/2022 5:23:09 PM
Y - Churned heavy volume as it paused today after a streak of 6 consecutive gains for new 52-week highs triggered a technical buy signal. See the latest FSU analysis for more details and a new annotated graph.
>>> FEATURED STOCK ARTICLE : Churned Heavy Volume Perched at High After 6 Straight Gains - 8/15/2022 |
View all notes |
Set NEW NOTE alert |
Company Profile |
SEC
News |
Chart |
Request a new note
C
A
S
I |
CSL
-
NYSE
Carlisle Cos Inc
Diversified Operations
|
$314.07
|
-0.77
-0.24% |
$315.18
|
395,525
100.13% of 50 DAV
50 DAV is 395,000
|
$317.96
-1.22%
|
7/28/2022
|
$282.31
|
PP = $275.23
|
|
MB = $288.99
|
Most Recent Note - 8/15/2022 5:25:11 PM
G - Hit yet another new all-time high with today's 4th consecutive volume-driven gain, getting very extended from the previously noted base. Prior highs in the $275 area define initial support to watch on pullbacks.
>>> FEATURED STOCK ARTICLE : Carlisle Perched at All-Time High After Noted Breakout - 8/2/2022 |
View all notes |
Set NEW NOTE alert |
Company Profile |
SEC
News |
Chart |
Request a new note
C
A
S
I |
ENPH
-
NASDAQ
Enphase Energy Inc
Energy-Solar
|
$293.13
|
+0.19
0.06% |
$296.79
|
2,172,467
64.39% of 50 DAV
50 DAV is 3,374,000
|
$308.88
-5.10%
|
7/28/2022
|
$276.66
|
PP = $282.55
|
|
MB = $296.68
|
Most Recent Note - 8/16/2022 6:09:58 PM
Y - Lost ground today with average volume, and its color code is changed to yellow after pulling back below its "max buy" level. The prior high in the $282 area has been noted as initial support to watch on pullbacks. Fundamentals remain strong.
>>> FEATURED STOCK ARTICLE : Pullback Following 3 Consecutive Gains With Heavier Volume - 8/1/2022 |
View all notes |
Set NEW NOTE alert |
Company Profile |
SEC
News |
Chart |
Request a new note
C
A
S
I |
PWR
-
NYSE
Quanta Services Inc
MATERIALS and CONSTRUCTION - General Contractors
|
$144.12
|
+1.69
1.19% |
$144.23
|
1,073,919
83.25% of 50 DAV
50 DAV is 1,290,000
|
$146.84
-1.85%
|
7/28/2022
|
$141.83
|
PP = $140.14
|
|
MB = $147.15
|
Most Recent Note - 8/16/2022 6:06:01 PM
Y - Volume totals have been below average after recently wedging back above its pivot point since encountering some distributional pressure. Confirming volume-driven gains for new highs would be a reassuring sign of serious institutional buying demand. Fundamentals remain strong. See the latest FSU analysis for more details and a new annotated graph.
>>> FEATURED STOCK ARTICLE : Stalled After Breakout But Still Quietly Hovering Near High - 8/16/2022 |
View all notes |
Set NEW NOTE alert |
Company Profile |
SEC
News |
Chart |
Request a new note
C
A
S
I |
CLFD
-
NASDAQ
Clearfield Inc
TELECOMMUNICATIONS - Cables / Satalite Equipment
|
$118.00
|
-0.99
-0.83% |
$118.37
|
281,878
88.36% of 50 DAV
50 DAV is 319,000
|
$121.88
-3.18%
|
7/29/2022
|
$94.10
|
PP = $86.81
|
|
MB = $91.15
|
Most Recent Note - 8/17/2022 5:13:05 PM
G - Gapped down today yet showed resilience and closed near the session high. Very extended from any sound base. Prior high in the $86 area defines initial support to watch. Fundamentals remain strong. See the latest FSU analysis for more details and a new annotated graph.
>>> FEATURED STOCK ARTICLE : Clearfield Showed Resilience After Considerable Rally - 8/17/2022 |
View all notes |
Set NEW NOTE alert |
Company Profile |
SEC
News |
Chart |
Request a new note
C
A
S
I |
Symbol/Exchange
Company Name
Industry Group |
PRICE |
CHANGE
(%Change) |
Day High |
Volume
(% DAV)
(% 50 day avg vol) |
52 Wk Hi
% From Hi |
Featured
Date |
Price
Featured |
Pivot Featured |
|
Max Buy |
GFF
-
NYSE
Griffon Corporation
MATERIALS and CONSTRUCTION - General Building Materials
|
$32.48
|
-0.81
-2.43% |
$32.98
|
259,093
56.94% of 50 DAV
50 DAV is 455,000
|
$34.35
-5.44%
|
8/8/2022
|
$32.46
|
PP = $31.12
|
|
MB = $32.68
|
Most Recent Note - 8/16/2022 6:12:21 PM
G - Pulled back today for a 3rd consecutive small loss with light volume, hovering near its 52-week high. Prior highs in the $31 area define initial support to watch on pullbacks.
>>> FEATURED STOCK ARTICLE : Breakout for New High Backed by +52% Above Average Volume - 8/8/2022 |
View all notes |
Set NEW NOTE alert |
Company Profile |
SEC
News |
Chart |
Request a new note
C
A
S
I |
CLH
-
NYSE
Clean Harbors Inc
Pollution Control
|
$117.48
|
-0.65
-0.55% |
$118.00
|
214,012
66.67% of 50 DAV
50 DAV is 321,000
|
$118.92
-1.21%
|
8/10/2022
|
$111.78
|
PP = $115.10
|
|
MB = $120.86
|
Most Recent Note - 8/15/2022 5:33:20 PM
Y - Pulled back today with average volume. Prior gain and strong close above the pivot point backed by +116% above average volume triggered a technical buy signal. No resistance remains due to overhead supply. Fundamentals remain strong.
>>> FEATURED STOCK ARTICLE : Pollution Control Firm Perched Near Prior High - 8/10/2022 |
View all notes |
Set NEW NOTE alert |
Company Profile |
SEC
News |
Chart |
Request a new note
C
A
S
I |
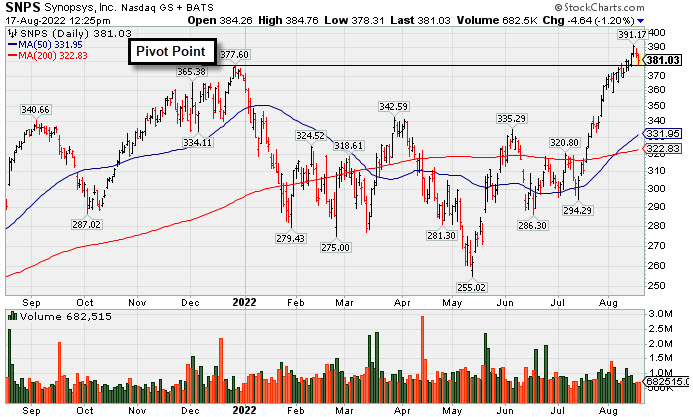
SNPS
-
NASDAQ
Synopsys Inc
COMPUTER SOFTWARE and SERVICES - Technical and System Software
|
$381.00
|
-4.67
-1.21% |
$384.76
|
1,452,671
164.14% of 50 DAV
50 DAV is 885,000
|
$391.17
-2.60%
|
8/17/2022
|
$381.37
|
PP = $377.70
|
|
MB = $396.59
|
Most Recent Note - 8/17/2022 12:28:20 PM
Y - Color code is changed to yellow with pivot point cited based on its 12/28/21 high plus 10 cents. Perched at its all-time high with earnings news due for the Jul '22 quarter. Volume and volatility often increase near earnings news. Subsequent gains above the pivot point backed by at least +40% above average volume may help clinch a convincing technical buy signal. Earnings for the Jan and Apr '22 quarters versus the year ago periods were above the +25% minimum guideline (C criteria). Annual earnings (A criteria) history has been strong and steady.
>>> FEATURED STOCK ARTICLE : Latest Earnings Report Missed the +25% Minimum Guideline - 8/18/2021 |
View all notes |
Set NEW NOTE alert |
Company Profile |
SEC
News |
Chart |
Request a new note
C
A
S
I |
|
|
|
THESE ARE NOT BUY RECOMMENDATIONS!
Comments contained in the body of this report are technical
opinions only. The material herein has been obtained
from sources believed to be reliable and accurate, however,
its accuracy and completeness cannot be guaranteed.
This site is not an investment advisor, hence it does
not endorse or recommend any securities or other investments.
Any recommendation contained in this report may not
be suitable for all investors and it is not to be deemed
an offer or solicitation on our part with respect to
the purchase or sale of any securities. All trademarks,
service marks and trade names appearing in this report
are the property of their respective owners, and are
likewise used for identification purposes only.
This report is a service available
only to active Paid Premium Members.
You may opt-out of receiving report notifications
at any time. Questions or comments may be submitted
by writing to Premium Membership Services 665 S.E. 10 Street, Suite 201 Deerfield Beach, FL 33441-5634 or by calling 1-800-965-8307
or 954-785-1121.
|
|
|