You are not logged in.
This means you
CAN ONLY VIEW reports that were published prior to Thursday, March 20, 2025.
You
MUST UPGRADE YOUR MEMBERSHIP if you want to see any current reports.
AFTER MARKET UPDATE - TUESDAY, MARCH 9TH, 2021
Previous After Market Report Next After Market Report >>>
|
|
|
|
DOW |
+30.30 |
31,832.74 |
+0.10% |
|
Volume |
1,123,691,887 |
-7% |
|
Volume |
6,250,191,600 |
+6% |
|
NASDAQ |
+469.25 |
13,078.41 |
+3.72% |
|
Advancers |
1,945 |
61% |
|
Advancers |
2,798 |
72% |
|
S&P 500 |
+54.09 |
3,875.44 |
+1.42% |
|
Decliners |
1,257 |
39% |
|
Decliners |
1,083 |
28% |
|
Russell 2000 |
+42.07 |
2,245.06 |
+1.91% |
|
52 Wk Highs |
278 |
|
|
52 Wk Highs |
318 |
|
|
S&P 600 |
+12.17 |
1,339.99 |
+0.92% |
|
52 Wk Lows |
9 |
|
|
52 Wk Lows |
24 |
|
|
Following a brief "correction", technical strength in the Dow Jones Industrial Average and Small Cap Index already this week has helped the uptrend resume - noted as a quick positive shift concerning the M criteria.
|
 |
Breadth Positive as Major Indices Rise
Kenneth J. Gruneisen - Passed the CAN SLIM® Master's Exam
The Dow advanced 30 points, hitting a new all-time high, while the S&P 500 rose 1.4% and now sits within 2% of its record level. The Nasdaq Composite surged 3.7% for its best day since November, climbing out of correction territory (defined as a 10% drop from a recent peak). Notably, the tech-heavy benchmark saw its seventh consecutive session of a 1.5% move in either direction, the longest such streak in a year. The volume was mixed, lighter than the prior session total on the NYSE and higher on the Nasdaq exchange. Advancers led decliners by a 3-2 margin on the NYSE and by a 5-2 margin on the Nasdaq exchange. There were 89 high-ranked companies from the Leaders List that hit new 52-week highs and were listed on the BreakOuts Page, versus the total of 132 on the prior session. New 52-week highs totals contracted yet still easily outnumbered shrinking new 52-week lows totals on the NYSE and on the Nasdaq exchange. The Dow Jones Industrial Average posted a 3rd consecutive gain and is perched at a new record high. The technical strength shown by the Blue Chip index and the Small Cap index (see below), essentially ended a brief "correction" and resumed the prior market uptrend (M criteria). Investors are reminded to always make buying and selling decisions on a case-by-case basis under the strict criteria and rules of the fact-based investment system.
PICTURED: The S&P 600 Small Cap Index found support well above its 50-day moving average (DMA) line and posted a 3rd consecutive big gain, hitting a new record high. The Small Cap index coupled with the Dow Jones Industrial Average in hitting new highs, technically, argues that the market is in an uptrend (M criteria).
U.S. equities rallied on Tuesday as tech shares bounced back from their recent sell-off. Fiscal stimulus remained in focus, with the latest $1.9 trillion spending bill facing a vote in the House tomorrow.
Treasuries also caught a bid, with the yield on the benchmark 10-year note down six basis points to 1.54%, falling for the first time in five sessions. On the data front, the NFIB's measure of small business optimism improved less than expected in February. In FOREX trading, a gauge of the U.S. dollar slid 0.4% after rising to its highest point in nearly four months on Monday. Amid the weakness in the greenback, COMEX gold rebounded 2.1% to $1,713.20/ounce.
Seven of 11 S&P 500 sectors finished in positive territory, with the more cyclical-oriented Energy, Financials and Industrials groups lagging. Energy, the best performing sector of 2021, fared the worst with WTI crude retreating 1.8% to $63.89/barrel. Meanwhile, Consumer Discretionary stocks paced the gains with electric carmaker Tesla (TSLA +19.64%) surging to halt a five-day losing streak. Other tech and growth-oriented stocks outperformed, with shares of Apple, Microsoft, Facebook, and Netflix all recovering more than 2.5%. |
 Kenneth J. Gruneisen started out as a licensed stockbroker in August 1987, a couple of months prior to the historic stock market crash that took the Dow Jones Industrial Average down -22.6% in a single day. He has published daily fact-based fundamental and technical analysis on high-ranked stocks online for two decades. Through FACTBASEDINVESTING.COM, Kenneth provides educational articles, news, market commentary, and other information regarding proven investment systems that work in good times and bad.
Comments contained in the body of this report are technical opinions only and are not necessarily those of Gruneisen Growth Corp. The material herein has been obtained from sources believed to be reliable and accurate, however, its accuracy and completeness cannot be guaranteed. Our firm, employees, and customers may effect transactions, including transactions contrary to any recommendation herein, or have positions in the securities mentioned herein or options with respect thereto. Any recommendation contained in this report may not be suitable for all investors and it is not to be deemed an offer or solicitation on our part with respect to the purchase or sale of any securities. |
|
 |
Gold & Silver, Retail, Broker/Dealer, and Tech Indexes Rose
Kenneth J. Gruneisen - Passed the CAN SLIM® Master's Exam
Gains from the Retail Index ($RLX +2.66%) and Broker/Dealer Index ($XBD +1.62%) were a positive influence while the Bank Index ($BKX -1.95%) created a drag and ended lower. The Semiconductor Index ($SOX +6.20%) led the tech sector rebound while the Networking Index ($NWX +2.87%) also posted a solid gain and the Biotech Index ($BTK +0.53%) edged higher. Commodity-linked groups were mixed as the Oil Services Index ($OSX -3.97%) and Integrated Oil Index ($XOI -2.18%) both lost ground while the Gold & Silver Index ($XAU +2.31%) rose.
PICTURED: The Networking Index ($NWX +2.87%) graph shows its rebound back above its 50-day moving average line.
| Oil Services |
$OSX |
60.52 |
-2.50 |
-3.97% |
+36.53% |
| Integrated Oil |
$XOI |
1,058.41 |
-23.63 |
-2.18% |
+33.56% |
| Semiconductor |
$SOX |
2,934.06 |
+171.30 |
+6.20% |
+4.96% |
| Networking |
$NWX |
775.24 |
+21.66 |
+2.87% |
+8.10% |
| Broker/Dealer |
$XBD |
443.17 |
+7.04 |
+1.62% |
+17.37% |
| Retail |
$RLX |
3,498.30 |
+90.49 |
+2.66% |
-1.82% |
| Gold & Silver |
$XAU |
134.75 |
+3.04 |
+2.31% |
-6.55% |
| Bank |
$BKX |
118.40 |
-2.35 |
-1.95% |
+20.92% |
| Biotech |
$BTK |
5,453.58 |
+28.79 |
+0.53% |
-4.97% |
|
|
|
 |
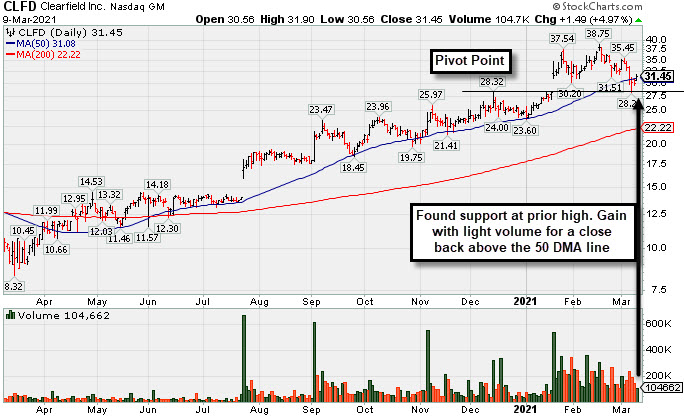
Quiet Gain Repaired 50-Day Moving Average Violation
Kenneth J. Gruneisen - Passed the CAN SLIM® Master's Exam
Clearfield Inc (CLFD +$1.49 or +4.97% to $31.45) posted a big gain today with below average volume, rebounding to close above its 50-day moving average (DMA) line ($31.08), helping its outlook improve. It found prompt support above prior highs in the $28 area.
Fundamentals remain strong. The high-ranked TELECOMMUNICATIONS - Fiber Optics firm reported Dec '20 quarterly earnings +475% on +40% sales revenues versus the year ago period, continuing its strong earning track record with a 4th consecutive quarterly earnings comparison above the +25% minimum guideline (C criteria). Annual earnings (A criteria) history has improved after a downturn in FY '17.
CLFD traded up as much as 74.2% since highlighted in yellow with pivot point cited based on its 11/09/20 high plus 10 cents in the 11/17/20 mid-day report (read here). It was last shown in this FSU section on 2/24/21 with an annotated graph under the headline, "Consolidating Well Above 50-Day Moving Average Line".
The number of top-rated funds owning its shares rose from 132 in Jun '20 to 153 in Dec '20. Its current Up/Down Volume Ratio of 1.3 is an unbiased indication its shares have been under accumulation over the past 50 days. Its Accumulation/Distribution Rating is C- and Timeliness Rating is B, and its Sponsorship Rating is C.
|
|
|
Color Codes Explained :
Y - Better candidates highlighted by our
staff of experts.
G - Previously featured
in past reports as yellow but may no longer be buyable under the
guidelines.
***Last / Change / Volume data in this table is the closing quote data***
Symbol/Exchange
Company Name
Industry Group |
PRICE |
CHANGE
(%Change) |
Day High |
Volume
(% DAV)
(% 50 day avg vol) |
52 Wk Hi
% From Hi |
Featured
Date |
Price
Featured |
Pivot Featured |
|
Max Buy |
 FBC
-
NYSE
FBC
-
NYSE
Flagstar Bancorp Inc
BANKING - Savings and Loans
|
$46.26
|
+1.42
3.17% |
$46.90
|
703,727
111.21% of 50 DAV
50 DAV is 632,800
|
$49.15
-5.88%
|
3/4/2021
|
$47.26
|
PP = $48.02
|
|
MB = $50.42
|
 Most Recent Note - 3/9/2021 5:42:40 PM
Y - Perched within close striking distance of its 52-week high, it posted a big gain today with near average volume. Near its 50 DMA line ($44) it found prompt support. Featured in yellow with pivot point cited based on its 1/26/21 high plus 10 cents in the 3/04/21 mid-day report and repeatedly noted - "Subsequent gains and a strong close above the pivot point backed by at least +40% above average volume are needed to trigger a proper technical buy signal."
>>> FEATURED STOCK ARTICLE : Negative Reversal When Poised For Technical Breakout - 3/4/2021 |
View all notes |
Set NEW NOTE alert |
Company Profile |
SEC
News |
Chart |
Request a new note
C
A
S
I |
CRL
-
NYSE
Charles River Labs Intl
DRUGS - Biotechnology
|
$278.44
|
+7.47
2.76% |
$280.00
|
228,479
72.08% of 50 DAV
50 DAV is 317,000
|
$303.79
-8.34%
|
12/17/2020
|
$247.06
|
PP = $257.98
|
|
MB = $270.88
|
Most Recent Note - 3/9/2021 5:38:45 PM
G - Consolidating above its 50 DMA line ($272) where it recently found prompt support again. Its Relative Strength Rating is still 75, below the 80+ minimum guideline for buy candidates. Recently reported Dec '20 quarterly earnings +19% on +14% sales revenues versus the year ago period, below the +25% minimum earnings guideline (C criteria), raising concerns.
>>> FEATURED STOCK ARTICLE : CRL Still Hovering Near Record High - 3/1/2021 |
View all notes |
Set NEW NOTE alert |
Company Profile |
SEC
News |
Chart |
Request a new note
C
A
S
I |
OPY
-
NYSE
Oppenheimer Holdings Inc
FINANCIAL SERVICES - Investment Brokerage - Regiona
|
$41.71
|
+0.49
1.19% |
$42.48
|
149,359
122.43% of 50 DAV
50 DAV is 122,000
|
$41.71
0.00%
|
2/25/2021
|
$38.95
|
PP = $38.11
|
|
MB = $40.02
|
Most Recent Note - 3/8/2021 5:28:02 PM
G - Closed strong today as it hit another new all-time high with a big gain backed by average volume. Disciplined investors avoid chasing stocks extended more than +5% above their pivot point.
>>> FEATURED STOCK ARTICLE : Rose From "3-weeks Tight" Base But Ended Near Session Low - 2/25/2021 |
View all notes |
Set NEW NOTE alert |
Company Profile |
SEC
News |
Chart |
Request a new note
C
A
S
I |
CLFD
-
NASDAQ
Clearfield Inc
TELECOMMUNICATIONS - Cables / Satalite Equipment
|
$31.45
|
+1.49
4.97% |
$31.90
|
104,662
65.01% of 50 DAV
50 DAV is 161,000
|
$38.75
-18.84%
|
1/20/2021
|
$31.38
|
PP = $28.42
|
|
MB = $29.84
|
Most Recent Note - 3/9/2021 5:35:46 PM
G - Posted a big gain with light volume to close back above its 50 DMA line ($31.08), helping its technical stance and outlook improve. Prior highs in the $28 area acted as support. Fundamentals remain strong. See the latest FSU analysis for more details and a new annotated graph.
>>> FEATURED STOCK ARTICLE : Quiet Gain Repaired 50-Day Moving Average Violation - 3/9/2021 |
View all notes |
Set NEW NOTE alert |
Company Profile |
SEC
News |
Chart |
Request a new note
C
A
S
I |
SMPL
-
NASDAQ
Simply Good Foods Co
Food-Confectionery
|
$31.56
|
+1.06
3.48% |
$31.84
|
472,664
45.45% of 50 DAV
50 DAV is 1,040,000
|
$32.03
-1.47%
|
12/28/2020
|
$30.40
|
PP = $31.44
|
|
MB = $33.01
|
Most Recent Note - 3/9/2021 5:44:08 PM
Y - Managed a best-ever close with today's 4th consecutive gain with below average volume. Its 50 DMA line ($29.21) recently acted as support. Its Relative Strength Rating is 80, right at the minimum guideline for buy candidates. Its prior low ($26.78) defines the next important near term support to watch.
>>> FEATURED STOCK ARTICLE : Found Support at 50-Day Moving Average; Relative Strength Improved - 3/5/2021 |
View all notes |
Set NEW NOTE alert |
Company Profile |
SEC
News |
Chart |
Request a new note
C
A
S
I |
Symbol/Exchange
Company Name
Industry Group |
PRICE |
CHANGE
(%Change) |
Day High |
Volume
(% DAV)
(% 50 day avg vol) |
52 Wk Hi
% From Hi |
Featured
Date |
Price
Featured |
Pivot Featured |
|
Max Buy |
DT
-
NYSE
Dynatrace Inc
Computer Sftwr-Enterprse
|
$50.85
|
+2.97
6.20% |
$51.39
|
2,189,127
85.77% of 50 DAV
50 DAV is 2,552,200
|
$58.77
-13.48%
|
2/4/2021
|
$51.39
|
PP = $48.95
|
|
MB = $51.40
|
Most Recent Note - 3/9/2021 5:40:29 PM
G - Posted a big gain with below average volume today. Found prompt support after testing prior highs in the $48 area and its 50 DMA line ($47.26). More damaging losses would raise serious concerns. Its Relative Strength Rating is 74, still below the 80+ minimum guideline for buy candidates. Fundamentals remain strong after it reported Dec '20 earnings +70% on +28% sales revenues versus the year ago period.
>>> FEATURED STOCK ARTICLE : Consolidating Above Prior Highs and 50-Day Moving Average - 3/3/2021 |
View all notes |
Set NEW NOTE alert |
Company Profile |
SEC
News |
Chart |
Request a new note
C
A
S
I |
MRBK
-
NASDAQ
Meridian Corp
Banks-Northeast
|
$26.64
|
+0.17
0.64% |
$26.95
|
19,944
71.23% of 50 DAV
50 DAV is 28,000
|
$26.94
-1.11%
|
2/22/2021
|
$25.58
|
PP = $26.10
|
|
MB = $27.41
|
Most Recent Note - 3/8/2021 5:26:35 PM
Y - Posted a 4th consecutive gain today with near average volume, rising above the pivot point and challenging its 52-week high. Pivot point cited was based on its 12/18/21 high plus 10 cents. Repeatedly noted - "Subsequent gains and a strong close above its pivot point backed by at least +40% above average volume may help clinch a convincing technical buy signal. Fundamentals are strong.
>>> FEATURED STOCK ARTICLE : Negative Reversal When Poised to Convincingly Breakout - 2/22/2021 |
View all notes |
Set NEW NOTE alert |
Company Profile |
SEC
News |
Chart |
Request a new note
C
A
S
I |
|
|
|
THESE ARE NOT BUY RECOMMENDATIONS!
Comments contained in the body of this report are technical
opinions only. The material herein has been obtained
from sources believed to be reliable and accurate, however,
its accuracy and completeness cannot be guaranteed.
This site is not an investment advisor, hence it does
not endorse or recommend any securities or other investments.
Any recommendation contained in this report may not
be suitable for all investors and it is not to be deemed
an offer or solicitation on our part with respect to
the purchase or sale of any securities. All trademarks,
service marks and trade names appearing in this report
are the property of their respective owners, and are
likewise used for identification purposes only.
This report is a service available
only to active Paid Premium Members.
You may opt-out of receiving report notifications
at any time. Questions or comments may be submitted
by writing to Premium Membership Services 665 S.E. 10 Street, Suite 201 Deerfield Beach, FL 33441-5634 or by calling 1-800-965-8307
or 954-785-1121.
|
|
|


 r
r