You are not logged in.
This means you
CAN ONLY VIEW reports that were published prior to Sunday, April 6, 2025.
You
MUST UPGRADE YOUR MEMBERSHIP if you want to see any current reports.
AFTER MARKET UPDATE - THURSDAY, OCTOBER 27TH, 2022
Previous After Market Report Next After Market Report >>>
|
|
|
|
DOW |
+194.17 |
32,033.28 |
+0.61% |
|
Volume |
1,026,021,395 |
+2% |
|
Volume |
4,714,903,100 |
-9% |
|
NASDAQ |
-178.32 |
10,792.67 |
-1.63% |
|
Advancers |
1,657 |
54% |
|
Advancers |
2,082 |
45% |
|
S&P 500 |
-23.11 |
3,807.49 |
-0.60% |
|
Decliners |
1,388 |
46% |
|
Decliners |
2,554 |
55% |
|
Russell 2000 |
+1.99 |
1,806.32 |
+0.11% |
|
52 Wk Highs |
76 |
|
|
52 Wk Highs |
109 |
|
|
S&P 600 |
+4.08 |
1,171.58 |
+0.35% |
|
52 Wk Lows |
128 |
|
|
52 Wk Lows |
182 |
|
|
 |
Major Indices Were Mixed as Tech-Heavy Nasdaq Fell
Kenneth J. Gruneisen - Passed the CAN SLIM® Master's Exam
The Dow added 194 points, while the Nasdaq Composite declined 1.6%. The S&P 500 lost 0.6%. The volume totals reported were mixed, higher than the prior session on the NYSE and lower on the Nasdaq exchange. Advancers led decliners by an 8-7 margin on the NYSE but decliners led advancers by a 5-4 margin on the Nasdaq exchange. There were 45 high-ranked companies from the Leaders List that hit new 52-week highs and were listed on the BreakOuts Page, versus the total of 44 on the prior session. New 52-week lows totals still outnumbered new 52-week highs totals on both the NYSE and the Nasdaq exchange. The recent follow-through day helped establish a confirmed uptrend (M criteria). Healthy leadership (new 52-week highs totals) will be essential in the near-term for the rally to be productive. Only stocks meeting all key-criteria of the fact-based investment system should be considered as buy candidates.
Chart courtesy of www.stockcharts.com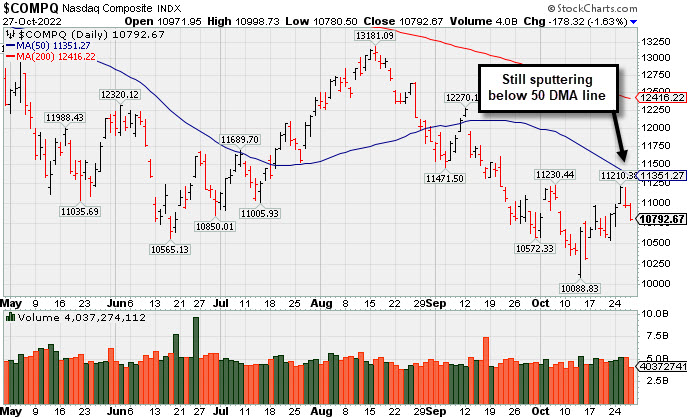 PICTURED: The Nasdaq Composite Index pulled back with lighter volume for a 2nd consecutive loss, still sputtering below its 50-day moving average (DMA) line.
U.S. equities closed mixed Thursday after technology firms’ earnings continued to fall short of analyst’s expectations. Five of the 11 S&P 500 sectors closed in negative territory, with Communication Services leading laggards. Facebook operator Meta Platforms Inc (META -24.56%) gapped down after reporting Sep '22 quarterly earnings -49% on -4% sales revenues versus the year ago period.
In earnings news, Apple Inc (AAPL -3.05%) was set to release earnings after the bell as analysts expect record revenue and slowing product demand. Amazon.com Inc (AMZN -4.06%) was also set to report earnings after the close with forecasts of a $2.2 billion profit, marking a 32% decline from the previous year. In other news, Twitter Inc (TWTR +0.66%) will suspend trading its shares on Friday as Elon Musk faces a court-ordered October 28 deadline to close the $44 billion deal.
Treasury yields declined after the U.S. Gross Domestic Product (GDP) reading came in above forecasts at 2.6% in the third quarter following two consecutive quarters of contraction. The yield on the benchmark 10-year note lost eleven basis points (0.11%) to 3.90%, while the 30-year bond yield decreased nine basis points (0.09%) to 4.06%. The more policy-sensitive two-year note yield fell thirteen basis points (0.13%) to 4.29%. In commodities, West Texas Intermediate (WTI) crude extended Wednesday’s rally and surged 1.25% to $89.01/barrel as demand appears strong. Meanwhile, the U.S. and Western officials continue finalizing their plans to impose a price cap on Russian oil with price expectations around historical averages of $63-64/barrel. This price from the Biden Administration is seen to cut revenues from Russia while Treasury Secretary Janet Yellen sees this as an incentive for Russia to keep producing oil. Finalized numbers are set to be released on December 5. |
 Kenneth J. Gruneisen started out as a licensed stockbroker in August 1987, a couple of months prior to the historic stock market crash that took the Dow Jones Industrial Average down -22.6% in a single day. He has published daily fact-based fundamental and technical analysis on high-ranked stocks online for two decades. Through FACTBASEDINVESTING.COM, Kenneth provides educational articles, news, market commentary, and other information regarding proven investment systems that work in good times and bad.
Comments contained in the body of this report are technical opinions only and are not necessarily those of Gruneisen Growth Corp. The material herein has been obtained from sources believed to be reliable and accurate, however, its accuracy and completeness cannot be guaranteed. Our firm, employees, and customers may effect transactions, including transactions contrary to any recommendation herein, or have positions in the securities mentioned herein or options with respect thereto. Any recommendation contained in this report may not be suitable for all investors and it is not to be deemed an offer or solicitation on our part with respect to the purchase or sale of any securities. |
|
 |
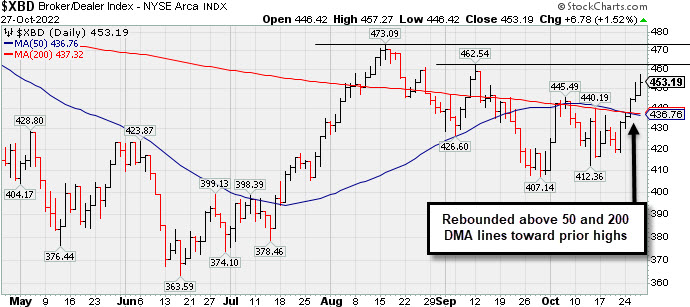
Broker/Dealer and Integrated Oil Indexes Rose
Kenneth J. Gruneisen - Passed the CAN SLIM® Master's Exam
The Broker/Dealer Index ($XBD +1.52%) rose while the Bank Index ($BKX +0.00%) finished flat and the Retail Index ($RLX -1.61%) lost ground. The tech sector saw losses from the Biotech Index ($BTK -1.87%) and Semiconductor Index ($SOX -1.50%) while the Networking Index ($NWX +0.24%) eked out a small gain. The Gold & Silver Index ($XAU -1.37%) lost ground and the Oil Services Index ($OSX -0.28%) edged lower while the Integrated Oil Index ($XOI +0.40%) posted a modest gain.
PICTURED: The Broker/Dealer Index ($XBD +1.52%) has been rebounding above its 50-day and 200-day moving average (DMA) lines toward prior highs. The improvement is a reassuring sign because the financial indexes have been reliable leading indicators.
| Oil Services |
$OSX |
81.63 |
-0.23 |
-0.28% |
+54.84% |
| Integrated Oil |
$XOI |
1,827.30 |
+7.21 |
+0.40% |
+55.09% |
| Semiconductor |
$SOX |
2,340.60 |
-35.74 |
-1.50% |
-40.69% |
| Networking |
$NWX |
821.97 |
+1.99 |
+0.24% |
-15.35% |
| Broker/Dealer |
$XBD |
453.19 |
+6.78 |
+1.52% |
-6.92% |
| Retail |
$RLX |
3,059.85 |
-50.07 |
-1.61% |
-27.60% |
| Gold & Silver |
$XAU |
105.65 |
-1.47 |
-1.37% |
-20.23% |
| Bank |
$BKX |
102.74 |
+0.00 |
+0.00% |
-22.30% |
| Biotech |
$BTK |
4,807.65 |
-91.64 |
-1.87% |
-12.88% |
|
|
|
 |
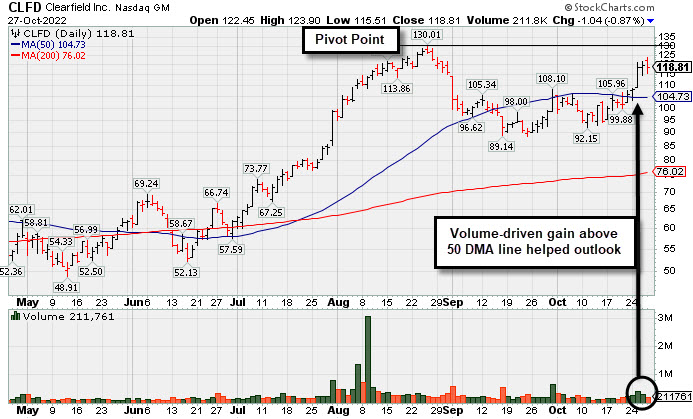
Clearfield Perched -8.6% Off High After Recent Rebound
Kenneth J. Gruneisen - Passed the CAN SLIM® Master's Exam
Clearfield Inc (CLFD ) paused today after rallying toward its 52-week high with 4 consecutive gains. A new pivot point was cited based on its 8/25/22 high plus 10 cents. Subsequent gains above the pivot point backed by at least +40% above average volume may trigger a technical buy signal. Keep in mid it is due to report Sep '22 quarterly results on 11/04/22. Volume and volatility often increase near earnings news.
CLFD showed resilience since dropped from the Featured Stocks list on 9/01/22. It slumped below its 50-day moving average and sputtered below it for several weeks since last shown in this FSU section on 8/17/22 with an annotated graph under the headline "Clearfield Showed Resilience After Considerable Rally".
CLFD has the highest possible Earnings Per Share Rating of 99. Fundamentals have been strong. It reported Jun '22 quarterly earnings +109% on +84% sales revenues above the year ago period. Annual earnings (A criteria) growth has been strong after a downturn in FY '17.
The TELECOMMUNICATIONS - Fiber Optics group is currently ranked 21st on the 197 Industry Groups list (L criteria). There are only 13.8 million shares outstanding (S criteria) which can contribute to greater price volatility in the event of institutional buying or selling. The number of top-rated funds owning its shares rose from 132 in Jun '20 to 303 in Sep '22, a reassuring sign concerning the I criteria. Its current Up/Down Volume Ratio of 1.1 is an unbiased indication its shares have been near neutral concerning accumulation/distribution over the past 50 days. Its Accumulation/Distribution Rating is B+, Timeliness Rating is A, and its Sponsorship Rating is B.
|
|
|
Color Codes Explained :
Y - Better candidates highlighted by our
staff of experts.
G - Previously featured
in past reports as yellow but may no longer be buyable under the
guidelines.
***Last / Change / Volume data in this table is the closing quote data***
Symbol/Exchange
Company Name
Industry Group |
PRICE |
CHANGE
(%Change) |
Day High |
Volume
(% DAV)
(% 50 day avg vol) |
52 Wk Hi
% From Hi |
Featured
Date |
Price
Featured |
Pivot Featured |
|
Max Buy |
 CI
-
NYSE
CI
-
NYSE
Cigna Corp
Medical-Managed Care
|
$316.58
|
+1.63
0.52% |
$319.50
|
1,408,092
73.15% of 50 DAV
50 DAV is 1,925,000
|
$317.73
-0.36%
|
7/7/2022
|
$276.55
|
PP = $273.68
|
|
MB = $287.36
|
 Most Recent Note - 10/27/2022 5:25:48 PM
G - Posted a 6th consecutive gain today with below average volume for yet another new all-time high. Its 50 DMA line ($290) defines near-term support to watch above the recent low ($283.79 on 10/10/22). Due to report Sep '22 quarterly results on 11/03/22. Volume and volatility often increase near earnings news.
>>> FEATURED STOCK ARTICLE : No Resistance Remains Due to Overhead Supply - 10/4/2022 |
View all notes |
Set NEW NOTE alert |
Company Profile |
SEC
News |
Chart |
Request a new note
C
A
S
I |
ESQ
-
NASDAQ
Esquire Financial Hldgs
Finance-Commercial Loans
|
$42.97
|
+0.07
0.16% |
$43.56
|
26,704
102.71% of 50 DAV
50 DAV is 26,000
|
$44.70
-3.86%
|
10/18/2022
|
$40.02
|
PP = $39.95
|
|
MB = $41.95
|
Most Recent Note - 10/26/2022 1:00:14 PM
G - Hit another new 52-week high with today's 3rd consecutive volume-driven gain and its color code is changed to green after rising above its "max buy". level. Prior highs in the $41 area define initial support to watch on pullbacks.
>>> FEATURED STOCK ARTICLE : Rebound Above 50-Day Moving Average Needed for Outlook to Improve - 10/7/2022 |
View all notes |
Set NEW NOTE alert |
Company Profile |
SEC
News |
Chart |
Request a new note
C
A
S
I |
CCRN
-
NASDAQ
Cross Country Healthcare
DIVERSIFIED SERVICES - Staffing and Outsourcing Service
|
$36.40
|
+0.04
0.11% |
$38.47
|
1,050,454
118.70% of 50 DAV
50 DAV is 885,000
|
$38.46
-5.36%
|
9/9/2022
|
$27.32
|
PP = $30.61
|
|
MB = $32.14
|
Most Recent Note - 10/27/2022 5:23:35 PM
G - Posted a small gain today but closed in the lower third of its intra-day range. It is extended from the previously noted base. Prior highs in the $30.50 area define initial support to watch above its 50 DMA line ($29.42).
>>> FEATURED STOCK ARTICLE : Healthcare Staffing Firm Hovering Near All-Time High - 10/17/2022 |
View all notes |
Set NEW NOTE alert |
Company Profile |
SEC
News |
Chart |
Request a new note
C
A
S
I |
CMC
-
NYSE
Commercial Metals Co
METALS and MINING - Steel and Iron
|
$44.38
|
-0.75
-1.66% |
$45.42
|
870,366
86.26% of 50 DAV
50 DAV is 1,009,000
|
$46.68
-4.93%
|
10/14/2022
|
$41.61
|
PP = $44.45
|
|
MB = $46.67
|
Most Recent Note - 10/26/2022 5:48:18 PM
Y - Posted a 5th consecutive small gain today with above average volume, inching further above the pivot point. Faces very little resistance due to overhead supply up to the $46 level. Reported Aug '22 quarterly earnings +94% on +19% sales revenues versus the year ago period and prior quarterly comparisons were well above the +25% minimum earnings guideline (C criteria) of the fact-based investment system. Annual earnings growth has been strong.
>>> FEATURED STOCK ARTICLE : Little Resistance Remains for Strong Steel/Metal Products Firm - 10/14/2022 |
View all notes |
Set NEW NOTE alert |
Company Profile |
SEC
News |
Chart |
Request a new note
C
A
S
I |
VRTX
-
NASDAQ
Vertex Pharmaceuticals
Medical-Biomed/Biotech
|
$287.89
|
-23.29
-7.48% |
$311.50
|
4,006,537
313.50% of 50 DAV
50 DAV is 1,278,000
|
$316.48
-9.03%
|
10/24/2022
|
$308.47
|
PP = $306.05
|
|
MB = $321.35
|
Most Recent Note - 10/27/2022 1:15:13 PM
G - Color code is changed to green while slumping back below its pivot point and undercutting its 50 DMA line ($291) with today's big volume-driven loss raising concerns. Due to report Sep '22 quarterly results after the close. Volume and volatility often increase near earnings news. Highlighted in yellow with pivot point cited based on its 8/15/22 high pus 10 cents in the 10/24/22 mid-day report. Three of the past 4 quarterly comparisons were above the +25% minimum earnings guideline (C criteria). Annual earnings (A criteria) history has been strong.
>>> FEATURED STOCK ARTICLE : Volume-Driven Gain Triggered Technical Buy Signal - 10/24/2022 |
View all notes |
Set NEW NOTE alert |
Company Profile |
SEC
News |
Chart |
Request a new note
C
A
S
I |
Symbol/Exchange
Company Name
Industry Group |
PRICE |
CHANGE
(%Change) |
Day High |
Volume
(% DAV)
(% 50 day avg vol) |
52 Wk Hi
% From Hi |
Featured
Date |
Price
Featured |
Pivot Featured |
|
Max Buy |
CLFD
-
NASDAQ
Clearfield Inc
TELECOMMUNICATIONS - Cables / Satalite Equipment
|
$118.81
|
-1.04
-0.87% |
$123.90
|
211,761
87.50% of 50 DAV
50 DAV is 242,000
|
$130.01
-8.61%
|
10/25/2022
|
$117.96
|
PP = $130.11
|
|
MB = $136.62
|
Most Recent Note - 10/27/2022 5:16:34 PM
Y - Paused today near its 52-week high following 4 consecutive gains. New pivot point was cited based on its 8/25/22 high plus 10 cents. Subsequent gains above the pivot point backed by at least +40% above average volume may trigger a technical buy signal. Fundamentals remain strong. Due to report Sep '22 quarterly results on 11/04/22. Showed resilience since dropped from the Featured Stocks list on 9/01/22. See the latest FSU analysis for more details and a new annotated graph.
>>> FEATURED STOCK ARTICLE : Clearfield Perched -8.6% Off High After Recent Rebound - 10/27/2022 |
View all notes |
Set NEW NOTE alert |
Company Profile |
SEC
News |
Chart |
Request a new note
C
A
S
I |
GPK
-
NYSE
Graphic Packaging Hldg
CONSUMER NON-DURABLES - Packaging and Containers
|
$23.05
|
-0.37
-1.58% |
$23.61
|
3,740,322
136.06% of 50 DAV
50 DAV is 2,749,000
|
$24.07
-4.24%
|
10/25/2022
|
$22.75
|
PP = $24.17
|
|
MB = $25.38
|
Most Recent Note - 10/26/2022 1:07:33 PM
Y - Challenging its 52-week high with today's 4th consecutive volume-driven gain. Finished strong after highlighted in yellow in the prior mid-day report with pivot point cited based on its 9/12/22 high plus 10 cents. Subsequent gains above the pivot point backed by at least +40% above average volume may trigger a technical buy signal. Reported Sep '22 quarterly earnings +79% on +38% sales revenues versus the year ago period. Fundamentals have been strong. Big gain and rebound above its 50 DMA line ($21.73) helped its outlook improve. Rebounded after sputtering below its 200 DMA line since dropped from the Featured Stocks list on 9/20/22. See the latest FSU analysis for more details and an annotated graph.
>>> FEATURED STOCK ARTICLE : Rebound Above 50-Day Moving Average Helped Outlook Improve - 10/25/2022 |
View all notes |
Set NEW NOTE alert |
Company Profile |
SEC
News |
Chart |
Request a new note
C
A
S
I |
CBZ
-
NYSE
C B I Z Inc
Comml Svcs-Consulting
|
$48.80
|
+1.63
3.46% |
$49.62
|
448,301
187.57% of 50 DAV
50 DAV is 239,000
|
$48.47
0.68%
|
10/26/2022
|
$47.83
|
PP = $48.57
|
|
MB = $51.00
|
Most Recent Note - 10/27/2022 5:21:27 PM
Y - Hit a new 52-week high today with a gain above its pivot point backed by +87% above average volume triggering a technical buy signal. Reported Sep '22 quarterly earnings +24% on +28% sales revenues versus the year ago period. Volume and volatility often increase near earnings news. Earnings rose +26% on +30% sales revenues for the Jun '22 quarter versus the year ago period. Annual earnings history has been strong and it has a 94 Earnings Per Share Rating. See the latest FSU analysis for more details and an annotated graph.
>>> FEATURED STOCK ARTICLE : Earnings Report Due for Commercial Services and Consulting Firm - 10/26/2022 |
View all notes |
Set NEW NOTE alert |
Company Profile |
SEC
News |
Chart |
Request a new note
C
A
S
I |
ENPH
-
NASDAQ
Enphase Energy Inc
Energy-Solar
|
$306.08
|
+14.21
4.87% |
$312.77
|
5,443,985
143.38% of 50 DAV
50 DAV is 3,797,000
|
$324.84
-5.78%
|
10/26/2022
|
$301.55
|
PP = $324.94
|
|
MB = $341.19
|
Most Recent Note - 10/27/2022 12:46:24 PM
Y - On track today for a 6th consecutive volume-driven gain. Highlighted in yellow in the prior mid-day report with new pivot point cited based on its 9/08/22 high plus 10 cents. Rebound above its 50 DMA line ($281.77) helped its outlook improve. Faces little resistance due to overhead supply up to the $324 level. Reported Sep '22 quarterly earnings +108% on +81% sales revenues versus the year ago period, continuing its strong earnings history above the +25% minimum guideline (C criteria). Showed resilience since dropped from the Featured Stocks list on 10/05/22.
>>> FEATURED STOCK ARTICLE : Found Support After Undercutting 50 DMA and Prior Low - 9/27/2022 |
View all notes |
Set NEW NOTE alert |
Company Profile |
SEC
News |
Chart |
Request a new note
C
A
S
I |
|
|
|
THESE ARE NOT BUY RECOMMENDATIONS!
Comments contained in the body of this report are technical
opinions only. The material herein has been obtained
from sources believed to be reliable and accurate, however,
its accuracy and completeness cannot be guaranteed.
This site is not an investment advisor, hence it does
not endorse or recommend any securities or other investments.
Any recommendation contained in this report may not
be suitable for all investors and it is not to be deemed
an offer or solicitation on our part with respect to
the purchase or sale of any securities. All trademarks,
service marks and trade names appearing in this report
are the property of their respective owners, and are
likewise used for identification purposes only.
This report is a service available
only to active Paid Premium Members.
You may opt-out of receiving report notifications
at any time. Questions or comments may be submitted
by writing to Premium Membership Services 665 S.E. 10 Street, Suite 201 Deerfield Beach, FL 33441-5634 or by calling 1-800-965-8307
or 954-785-1121.
|
|
|