You are not logged in.
This means you
CAN ONLY VIEW reports that were published prior to Tuesday, April 8, 2025.
You
MUST UPGRADE YOUR MEMBERSHIP if you want to see any current reports.
AFTER MARKET UPDATE - MONDAY, DECEMBER 19TH, 2022
Previous After Market Report Next After Market Report >>>
|
|
|
|
DOW |
-162.92 |
32,757.54 |
-0.49% |
|
Volume |
950,543,946 |
-71% |
|
Volume |
4,595,765,000 |
-43% |
|
NASDAQ |
-159.38 |
10,546.03 |
-1.49% |
|
Advancers |
902 |
30% |
|
Advancers |
1,234 |
27% |
|
S&P 500 |
-34.70 |
3,817.66 |
-0.90% |
|
Decliners |
2,145 |
70% |
|
Decliners |
3,385 |
73% |
|
Russell 2000 |
-24.84 |
1,738.58 |
-1.41% |
|
52 Wk Highs |
41 |
|
|
52 Wk Highs |
80 |
|
|
S&P 600 |
-8.69 |
1,145.85 |
-0.75% |
|
52 Wk Lows |
166 |
|
|
52 Wk Lows |
541 |
|
|
 |
Breath Negative as Major Averages Slump Further
Kenneth J. Gruneisen - Passed the CAN SLIM® Master's Exam
The Dow shed 162 points, while the technology heavy Nasdaq Composite fell 1.5%. The S&P 500 declined 0.9% as it heads for its worst December in four years. Volume totals on Monday were much lower than the prior session on the NYSE and on the Nasdaq exchange, as Friday's totals were inflated by options expirations. Breadth was negative as decliners led advancers by more than a 2-1 margin on the NYSE and nearly 3-1 on the Nasdaq exchange. There were only 5 high-ranked companies from the Leaders List that hit new 52-week highs and were listed on the BreakOuts Page, versus the total of 4 on the prior session. New 52-week lows totals solidly outnumbered new 52-week highs on the NYSE and on the Nasdaq exchange. The market is in an uptrend under pressure (M criteria) while showing the threatening look of a more serious market correction. Healthy leadership (new 52-week highs totals) must continue for the rally be productive, but new highs totals have recently contracted. Only stocks meeting all key-criteria of the fact-based investment system should be considered as buy candidates.
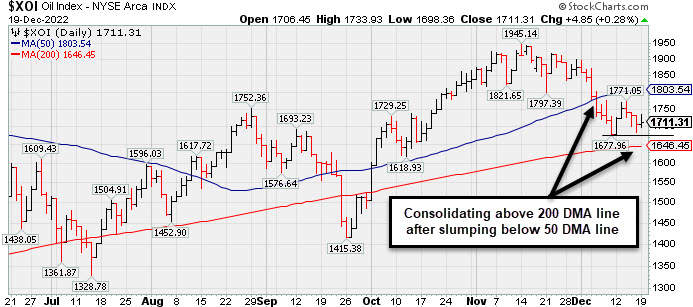
Chart courtesy of www.stockcharts.com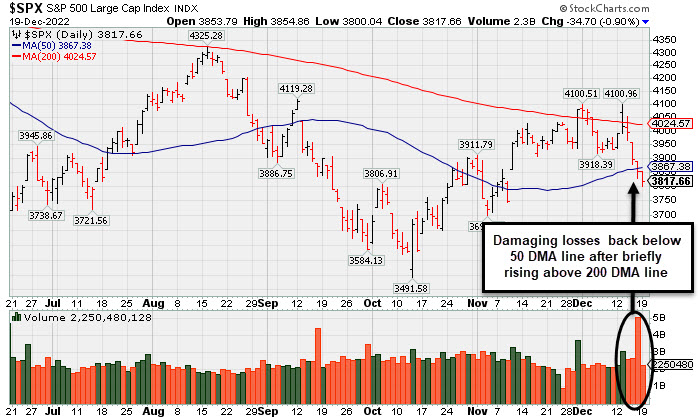 PICTURED: The S&P 500 Index fell back below its 50-day moving average (DMA) line with damaging losses after briefly trading above its 200 DMA line.
U.S. equities finished in negative territory Monday following two weeks of back-to-back losses as investor’s hopes for a Santa Clause rally start to dwindle. Investors continue to assess recessionary worries following the Federal Reserve’s (Fed) vow to keep raising rates until they feel confident inflation has been tamed. Ten of the eleven S&P sectors finished in negative territory with Communication Services leading laggards.
On the data front, December’s National Association of Home Builders Housing Index declined two-points to 31, marking a decline of twelve consecutive months. Today’s reading notched one of the lowest readings the index has seen since 2012, excluding the start of the pandemic in 2020, as home builder sentiment continues to be dragged down by high mortgage rates, high construction costs, and lower demand.
Treasury yields increased Monday with the yield on the benchmark 10-year note climbing eleven basis points (0.11%) to 3.59%, while the 30-year bond yield advanced nine basis points (0.09%) to 3.64%. The yield on the more Fed-sensitive two-year note gained seven basis points (0.07%) to 4.26%. In commodities, West Texas Intermediate (WTI) crude rose 2% to $75.77/barrel amid optimism over the Chinese economy reopening. Meanwhile, the U.S. Energy Department stated on Friday, their plans to repurchase crude oil for its Strategic Petroleum Reserves. This will be the Departments first repurchase since releasing 180 million barrels to combat record high gas prices.
|
 Kenneth J. Gruneisen started out as a licensed stockbroker in August 1987, a couple of months prior to the historic stock market crash that took the Dow Jones Industrial Average down -22.6% in a single day. He has published daily fact-based fundamental and technical analysis on high-ranked stocks online for two decades. Through FACTBASEDINVESTING.COM, Kenneth provides educational articles, news, market commentary, and other information regarding proven investment systems that work in good times and bad.
Comments contained in the body of this report are technical opinions only and are not necessarily those of Gruneisen Growth Corp. The material herein has been obtained from sources believed to be reliable and accurate, however, its accuracy and completeness cannot be guaranteed. Our firm, employees, and customers may effect transactions, including transactions contrary to any recommendation herein, or have positions in the securities mentioned herein or options with respect thereto. Any recommendation contained in this report may not be suitable for all investors and it is not to be deemed an offer or solicitation on our part with respect to the purchase or sale of any securities. |
|
 |
Retail, Broker/Dealer, Gold & Silver, and Tech Indexes Fell
Kenneth J. Gruneisen - Passed the CAN SLIM® Master's Exam
The Retail Index ($RLX -2.05%) and Broker/Dealer Index ($XBD -0.91%) lost ground and created a drag on the major averages while the Bank Index ($BKX -0.02%) finished flat. The tech sector had a negative bias as the Biotech Index ($BTK -2.19%) outpaced the Semiconductor Index ($SOX -1.37%), and Networking Index ($NWX -1.59%) to the downside. Commodity-linked groups were mixed as the Gold & Silver Index ($XAU -1.63%) lost ground while the Oil Services Index ($OSX -0.05%) finished flat and the Integrated Oil Index ($XOI +0.28%) inched higher.
PICTURED: The Integrated Oil Index ($XOI +0.28%) is consolidating above its 200-day moving average (DMA) line after recently slumping below its 50 DMA line.
| Oil Services |
$OSX |
78.42 |
-0.04 |
-0.05% |
+48.75% |
| Integrated Oil |
$XOI |
1,711.31 |
+4.85 |
+0.28% |
+45.25% |
| Semiconductor |
$SOX |
2,599.86 |
-36.24 |
-1.37% |
-34.12% |
| Networking |
$NWX |
773.25 |
-12.51 |
-1.59% |
-20.37% |
| Broker/Dealer |
$XBD |
441.41 |
-4.05 |
-0.91% |
-9.34% |
| Retail |
$RLX |
2,754.16 |
-57.62 |
-2.05% |
-34.84% |
| Gold & Silver |
$XAU |
115.67 |
-1.91 |
-1.63% |
-12.67% |
| Bank |
$BKX |
97.66 |
-0.02 |
-0.02% |
-26.14% |
| Biotech |
$BTK |
5,209.87 |
-116.54 |
-2.19% |
-5.59% |
|
|
|
 |
Fourth Straight Loss in Slump Violating 50-Day Moving Average Line
Kenneth J. Gruneisen - Passed the CAN SLIM® Master's Exam
C B I Z Inc (CBZ -$1.10 or -2.29% to $46.97) pulled back further from its 52-week high today with a 4th consecutive loss. It has violated its 50-day moving average (DMA) line ($47.83) raising concerns and triggering a technical sell signal. It recently formed an orderly new 6-week flat base but no new pivot point was cited because it had made little headway from the prior base and remained below the "max buy" level. Only a prompt rebound above its 50 DMA line would help its outlook improve.
The company's Earnings Per Share Rating fell from 95 to 94 after it reported Sep '22 quarterly earnings +24% on +28% sales revenues versus the year ago period. CBZ was highlighted in yellow in the 10/26/22 mid-day report (read here) and last shown in greater detail on 11/18/22 with an annotated graph under the headline, "Gapped Up and Rebounded Above Pivot Point". The prior 2 quarterly comparisons were above the +25% minimum earnings guideline (C criteria). Annual earnings (A criteria) history has been strong.
The number of top-rated funds owning its shares rose from 361 in Dec '21 to 381 in Sep '22. Its current Up/Down Volume Ratio of 1.1 is an unbiased indication its shares have been under slight distributional pressure over the past 50 days. There are only 50.8 million shares outstanding (S criteria) which can contribute to greater volatility in the event of institutional buying or selling. It has an A Timeliness Rating and a B Sponsorship Rating.
|
|
|
Color Codes Explained :
Y - Better candidates highlighted by our
staff of experts.
G - Previously featured
in past reports as yellow but may no longer be buyable under the
guidelines.
***Last / Change / Volume data in this table is the closing quote data***
Symbol/Exchange
Company Name
Industry Group |
PRICE |
CHANGE
(%Change) |
Day High |
Volume
(% DAV)
(% 50 day avg vol) |
52 Wk Hi
% From Hi |
Featured
Date |
Price
Featured |
Pivot Featured |
|
Max Buy |
 ESQ
-
NASDAQ
ESQ
-
NASDAQ
Esquire Financial Hldgs
Finance-Commercial Loans
|
$42.30
|
+0.05
0.12% |
$42.43
|
28,287
101.03% of 50 DAV
50 DAV is 28,000
|
$48.13
-12.11%
|
10/18/2022
|
$40.02
|
PP = $39.95
|
|
MB = $41.95
|
Most Recent Note - 12/16/2022 6:36:34 PM
G - Managed a positive "reversal today" finding support near prior highs in the $41 area and rebounding toward its 50 DMA line ($42.74). Gains above the 50 DMA line are needed for its outlook to improve.
>>> FEATURED STOCK ARTICLE : Pulled Back Following "Negative Reversal" at All-Time High - 11/25/2022 |
View all notes |
Set NEW NOTE alert |
Company Profile |
SEC
News |
Chart |
Request a new note
C
A
S
I |
CMC
-
NYSE
Commercial Metals Co
METALS and MINING - Steel and Iron
|
$47.27
|
-0.88
-1.83% |
$48.78
|
1,103,793
104.13% of 50 DAV
50 DAV is 1,060,000
|
$50.83
-7.00%
|
10/14/2022
|
$41.61
|
PP = $44.45
|
|
MB = $46.67
|
Most Recent Note - 12/15/2022 4:30:42 PM
G - Gapped down today for a loss with below average volume, pulling back toward its 50 DMA line ($45.74) and prior highs in the $46 area defining important near-term support to watch. Fundamentals remain strong.
>>> FEATURED STOCK ARTICLE : Wedging Higher With Recent Gains Lacking Great Volume - 12/2/2022 |
View all notes |
Set NEW NOTE alert |
Company Profile |
SEC
News |
Chart |
Request a new note
C
A
S
I |
VRTX
-
NASDAQ
Vertex Pharmaceuticals
Medical-Biomed/Biotech
|
$291.59
|
-13.21
-4.33% |
$302.59
|
1,658,039
110.46% of 50 DAV
50 DAV is 1,501,000
|
$324.75
-10.21%
|
10/24/2022
|
$308.47
|
PP = $306.05
|
|
MB = $321.35
|
 Most Recent Note - 12/19/2022 5:48:44 PM
G - Gapped down today for a damaging loss triggering a technical sell signal and its color code is changed to green. Only a prompt rebound above the 50 DMA line ($307.76) would help its outlook improve. Recently reported Sep '22 quarterly earnings +14% on +18% sales revenues versus the year ago period, below the +25% minimum earnings guideline raising fundamental concerns (C criteria).
>>> FEATURED STOCK ARTICLE : Testing Support Near 50-Day Moving Average Line and Prior Pivot - 12/13/2022 |
View all notes |
Set NEW NOTE alert |
Company Profile |
SEC
News |
Chart |
Request a new note
C
A
S
I |
GPK
-
NYSE
Graphic Packaging Hldg
CONSUMER NON-DURABLES - Packaging and Containers
|
$21.26
|
-0.07
-0.33% |
$21.80
|
4,302,073
145.00% of 50 DAV
50 DAV is 2,967,000
|
$24.07
-11.67%
|
10/25/2022
|
$22.75
|
PP = $24.17
|
|
MB = $25.38
|
Most Recent Note - 12/15/2022 5:31:26 PM
G - Pulled back below its 50-day moving average (DMA) line ($22.09) with today's loss on near average volume raising concerns and triggering a technical sell signal. Color code is changed to green. A prompt rebound above the 50 DMA line is needed for its outlook to improve Fundamentals remain strong. See the latest FSU analysis for more details and a new annotated graph.
>>> FEATURED STOCK ARTICLE : Violated 50-Day Moving Average After Recently Failing to Break Out - 12/15/2022 |
View all notes |
Set NEW NOTE alert |
Company Profile |
SEC
News |
Chart |
Request a new note
C
A
S
I |
CBZ
-
NYSE
C B I Z Inc
Comml Svcs-Consulting
|
$46.97
|
-1.10
-2.29% |
$48.07
|
222,696
84.04% of 50 DAV
50 DAV is 265,000
|
$51.67
-9.10%
|
10/26/2022
|
$47.83
|
PP = $48.57
|
|
MB = $51.00
|
Most Recent Note - 12/19/2022 5:43:43 PM
G - Pulled back for a 4th consecutive loss and its color code is changed to green after violating its 50 DMA line ($47.83) triggering a technical sell signal. Recently reported Sep '22 quarterly earnings +24% on +28% sales revenues versus the year ago period. See the latest FSU analysis for more details and a new annotated graph.
>>> FEATURED STOCK ARTICLE : Fourth Straight Loss in Slump Violating 50-Day Moving Average Line - 12/19/2022 |
View all notes |
Set NEW NOTE alert |
Company Profile |
SEC
News |
Chart |
Request a new note
C
A
S
I |
Symbol/Exchange
Company Name
Industry Group |
PRICE |
CHANGE
(%Change) |
Day High |
Volume
(% DAV)
(% 50 day avg vol) |
52 Wk Hi
% From Hi |
Featured
Date |
Price
Featured |
Pivot Featured |
|
Max Buy |
ENPH
-
NASDAQ
Enphase Energy Inc
Energy-Solar
|
$305.01
|
+1.62
0.53% |
$312.91
|
2,347,965
62.61% of 50 DAV
50 DAV is 3,750,000
|
$339.92
-10.27%
|
10/26/2022
|
$301.55
|
PP = $324.94
|
|
MB = $341.19
|
Most Recent Note - 12/16/2022 6:32:32 PM
Y - Pulled back today with above average volume while slumping back below its pivot point. Stalled after hitting a new all-time high on 12/02/22 with a volume-driven gain above its pivot point. Its 50 DMA line ($292) defines near-term support to watch on pullbacks. Fundamentals remain strong.
>>> FEATURED STOCK ARTICLE : Perched Near High Still Awaiting Technical Breakout - 11/21/2022 |
View all notes |
Set NEW NOTE alert |
Company Profile |
SEC
News |
Chart |
Request a new note
C
A
S
I |
HRMY
-
NASDAQ
Harmony Biosciences Holdings
Medical-Biomed/Biotech
|
$55.27
|
-0.41
-0.74% |
$56.29
|
402,845
82.72% of 50 DAV
50 DAV is 487,000
|
$62.09
-10.98%
|
11/1/2022
|
$55.31
|
PP = $57.23
|
|
MB = $60.09
|
Most Recent Note - 12/15/2022 4:49:29 PM
Y - Suffered a 3rd consecutive loss today slumping below its pivot point raising concerns. Its 50 DMA line ($55.29) and 11/17/22 low ($53.06) define important near-term support to watch.
>>> FEATURED STOCK ARTICLE : Harmony Still Hovering Near All-Time High - 11/28/2022 |
View all notes |
Set NEW NOTE alert |
Company Profile |
SEC
News |
Chart |
Request a new note
C
A
S
I |
CLH
-
NYSE
Clean Harbors Inc
Pollution Control
|
$112.55
|
-2.45
-2.13% |
$114.64
|
519,379
127.30% of 50 DAV
50 DAV is 408,000
|
$125.41
-10.25%
|
11/2/2022
|
$121.59
|
PP = $124.59
|
|
MB = $130.82
|
Most Recent Note - 12/19/2022 5:46:43 PM
G - Color code is changed to green after gapping down today for a damaging 4th consecutive loss. Violated its 50 DMA line ($117) and the recent low ($114.86 on 11/29/22) triggering technical sell signals. Only a prompt rebound above the 50 DMA line would help its outlook improve. Fundamentals remain strong.
>>> FEATURED STOCK ARTICLE : Volume-Driven Losses Undercut 50-Day Moving Average - 11/29/2022 |
View all notes |
Set NEW NOTE alert |
Company Profile |
SEC
News |
Chart |
Request a new note
C
A
S
I |
DGII
-
NASDAQ
Digi International Inc
COMPUTER HARDWARE - Networking and Communication Dev
|
$37.04
|
-0.40
-1.07% |
$37.65
|
250,430
68.42% of 50 DAV
50 DAV is 366,000
|
$43.68
-15.20%
|
11/10/2022
|
$41.82
|
PP = $40.96
|
|
MB = $43.01
|
Most Recent Note - 12/16/2022 6:31:23 PM
G - Violated its 50 DMA line ($38.86) this week with 3 damaging losses backed by ever increasing volume triggering a technical sell signal and its color code is changed to green. Only a prompt rebound above the 50 DMA line would help its outlook improve. Fundamentals remain strong.
>>> FEATURED STOCK ARTICLE : Sputtering After Recently Wedging to New Highs - 12/6/2022 |
View all notes |
Set NEW NOTE alert |
Company Profile |
SEC
News |
Chart |
Request a new note
C
A
S
I |
GFF
-
NYSE
Griffon Corporation
MATERIALS and CONSTRUCTION - General Building Materials
|
$34.41
|
-0.54
-1.55% |
$35.45
|
431,396
108.12% of 50 DAV
50 DAV is 399,000
|
$37.69
-8.70%
|
11/10/2022
|
$34.13
|
PP = $35.02
|
|
MB = $36.77
|
Most Recent Note - 12/16/2022 6:38:10 PM
Y - Managed a "positive reversal" today after slumping near prior highs in the $34 area which define initial support to watch above its 50 DMA line ($33.19). Reported Sep '22 quarterly earnings +230% on +24% sales revenues versus the year ago period.
>>> FEATURED STOCK ARTICLE : No Meaningful Progress After Breakout 3 Weeks Ago - 12/7/2022 |
View all notes |
Set NEW NOTE alert |
Company Profile |
SEC
News |
Chart |
Request a new note
C
A
S
I |
Symbol/Exchange
Company Name
Industry Group |
PRICE |
CHANGE
(%Change) |
Day High |
Volume
(% DAV)
(% 50 day avg vol) |
52 Wk Hi
% From Hi |
Featured
Date |
Price
Featured |
Pivot Featured |
|
Max Buy |
ANET
-
NYSE
Arista Networks Inc
Computer-Networking
|
$122.55
|
-1.11
-0.90% |
$124.25
|
1,682,393
67.43% of 50 DAV
50 DAV is 2,495,000
|
$148.57
-17.51%
|
11/14/2022
|
$132.05
|
PP = $133.70
|
|
MB = $140.39
|
Most Recent Note - 12/16/2022 6:46:44 PM
G - Color code is changed to green as today's 3rd consecutive loss with increasing volume undercut the prior low and tested its 50-day moving average (DMA) line ($123.74). Faces some resistance due to overhead supply up to the $148 level. Fundamentals are strong.
>>> FEATURED STOCK ARTICLE : Sputtered Back Below Prior High Hurting Outlook - 12/9/2022 |
View all notes |
Set NEW NOTE alert |
Company Profile |
SEC
News |
Chart |
Request a new note
C
A
S
I |
CPRX
-
NASDAQ
Catalyst Pharma Inc
Medical-Biomed/Biotech
|
$16.41
|
+0.41
2.56% |
$16.48
|
1,805,291
79.35% of 50 DAV
50 DAV is 2,275,000
|
$18.39
-10.77%
|
11/22/2022
|
$17.38
|
PP = $16.66
|
|
MB = $17.49
|
Most Recent Note - 12/19/2022 5:50:07 PM
Y - Posted a solid gain today with lighter volume. Slump below its pivot point raised some concerns. Recently consolidating near the prior high and well above its 50 DMA line ($15.13).
>>> FEATURED STOCK ARTICLE : Breakout From Cup-With-Handle With 90% Above Average Volume - 11/22/2022 |
View all notes |
Set NEW NOTE alert |
Company Profile |
SEC
News |
Chart |
Request a new note
C
A
S
I |
TITN
-
NASDAQ
Titan Machinery Inc
SPECIALTY RETAIL
|
$38.46
|
-0.62
-1.59% |
$39.66
|
213,821
107.45% of 50 DAV
50 DAV is 199,000
|
$44.35
-13.28%
|
11/30/2022
|
$40.10
|
PP = $38.68
|
|
MB = $40.61
|
Most Recent Note - 12/15/2022 4:56:40 PM
Y - Suffered a big loss today consolidating near the prior high in the $38 area which defines initial support to watch. Fundamentals remain strong after reporting Oct '22 quarterly earnings +91% on +47% sales revenues.
>>> FEATURED STOCK ARTICLE : Gap Up and Big Volume-Driven Breakout Gain - 11/30/2022 |
View all notes |
Set NEW NOTE alert |
Company Profile |
SEC
News |
Chart |
Request a new note
C
A
S
I |
MYE
-
NYSE
Myers Industries Inc
Containers/Packaging
|
$22.81
|
+0.33
1.47% |
$23.06
|
188,850
121.06% of 50 DAV
50 DAV is 156,000
|
$25.55
-10.72%
|
12/8/2022
|
$23.94
|
PP = $25.65
|
|
MB = $26.93
|
Most Recent Note - 12/16/2022 6:41:18 PM
Y - Pulled back today for a 3rd consecutive loss with above average volume. Disciplined investors will note that it has failed thus far to produce the gains above the pivot point backed by at least +40% above average volume necessary to trigger a technical buy signal. The Sep '22 quarter showed +78% earnings on +14% sales revenues versus the year ago period. The past 4 quarterly comparisons were above the +25% minimum guideline (C criteria), however, its sales revenues growth rate has shown deceleration in sequential comparisons +45%, +29%, +24%, to +14%. Annual earnings (A criteria) history had a slight downturn in FY '19 but growth has been otherwise strong and steady.
>>> FEATURED STOCK ARTICLE : Myers Industries on Track for 9th Straight Weekly Gain - 12/8/2022 |
View all notes |
Set NEW NOTE alert |
Company Profile |
SEC
News |
Chart |
Request a new note
C
A
S
I |
BOX
-
NYSE
Box Inc Cl A
Computer Sftwr-Database
|
$30.75
|
-0.49
-1.57% |
$31.45
|
991,045
86.03% of 50 DAV
50 DAV is 1,152,000
|
$33.04
-6.93%
|
12/12/2022
|
$29.83
|
PP = $29.57
|
|
MB = $31.05
|
Most Recent Note - 12/15/2022 4:20:55 PM
G - Pulled back today following 3 consecutive volume-driven gains, consolidating near its "max buy" level. Faces some additional resistance due to overhead supply up to the $33 level. Quarterly and annual earnings increases have been strong and steady.
>>> FEATURED STOCK ARTICLE : Volume Heavy Behind Breakout for Box Inc - 12/12/2022 |
View all notes |
Set NEW NOTE alert |
Company Profile |
SEC
News |
Chart |
Request a new note
C
A
S
I |
Symbol/Exchange
Company Name
Industry Group |
PRICE |
CHANGE
(%Change) |
Day High |
Volume
(% DAV)
(% 50 day avg vol) |
52 Wk Hi
% From Hi |
Featured
Date |
Price
Featured |
Pivot Featured |
|
Max Buy |
STRL
-
NASDAQ
Sterling Infrastructure
MATERIALS and; CONSTRUCTION - Heavy Construction
|
$30.96
|
-0.05
-0.16% |
$31.72
|
222,908
118.57% of 50 DAV
50 DAV is 188,000
|
$33.62
-7.91%
|
12/14/2022
|
$32.41
|
PP = $33.72
|
|
MB = $35.41
|
Most Recent Note - 12/15/2022 4:55:05 PM
Y - Pulled back today for a 2nd loss with lighter volume. Highlighted in yellow with pivot point cited based on its 11/08/22 high plus 10 cents in the 12/14/22 mid-day report. Consolidating for about 5 weeks in a tight range near its all-time high with volume totals cooling. Faces very little resistance due to overhead supply. Subsequent gains above the pivot point backed by at least +40% above average volume are needed to trigger a proper technical buy signal. Reported Sep '22 quarterly earnings +35% on +20% sales revenues versus the year ago period, its 5th quarterly comparison at or above the +25% minimum earnings guideline (C criteria). After years of losses it has shown improving annual earnings (A criteria) since FY '17.
>>> FEATURED STOCK ARTICLE : Sterling Infrastructure Forming Orderly Base Pattern - 12/14/2022 |
View all notes |
Set NEW NOTE alert |
Company Profile |
SEC
News |
Chart |
Request a new note
C
A
S
I |
|
|
|
THESE ARE NOT BUY RECOMMENDATIONS!
Comments contained in the body of this report are technical
opinions only. The material herein has been obtained
from sources believed to be reliable and accurate, however,
its accuracy and completeness cannot be guaranteed.
This site is not an investment advisor, hence it does
not endorse or recommend any securities or other investments.
Any recommendation contained in this report may not
be suitable for all investors and it is not to be deemed
an offer or solicitation on our part with respect to
the purchase or sale of any securities. All trademarks,
service marks and trade names appearing in this report
are the property of their respective owners, and are
likewise used for identification purposes only.
This report is a service available
only to active Paid Premium Members.
You may opt-out of receiving report notifications
at any time. Questions or comments may be submitted
by writing to Premium Membership Services 665 S.E. 10 Street, Suite 201 Deerfield Beach, FL 33441-5634 or by calling 1-800-965-8307
or 954-785-1121.
|
|
|