Symbol/Exchange
Company Name
Industry Group |
PRICE |
CHANGE
(%Change) |
Day High |
Volume
(% DAV)
(% 50 day avg vol) |
52 Wk Hi
% From Hi |
Featured
Date |
Price
Featured |
Pivot Featured |
|
Max Buy |
 ABCB
-
NASDAQ
ABCB
-
NASDAQ
Ameris Bancorp
BANKING - Regional - Mid-Atlantic Banks
|
$54.17
|
+1.00
1.88% |
$54.41
|
538,409
112.17% of 50 DAV
50 DAV is 480,000
|
$59.85
-9.49%
|
5/21/2021
|
$58.86
|
PP = $57.91
|
|
MB = $60.81
|
Most Recent Note - 5/24/2021 6:13:38 PM
Y - Abruptly reversed from its high and fell back into the prior base raising concerns as it closed near the session low with +27% above average volume behind today's big loss. Finished strong after highlighted in yellow in the 5/21/21 mid-day report while hitting new 52-week and all-time highs clearing an orderly base. Pivot point cited was based on the 3/18/21 high plus 10 cents. The gain and strong close above the pivot point clinched a convincing technical buy signal. Reported earnings +196% on +25% sales revenues for the Mar '21 quarter versus the year ago period, its 3rd consecutive quarterly comparison above the +25% minimum earnings guideline (C criteria). Annual earnings growth has been steady. Completed a new Public Offering on 3/01/17. See the latest FSU analysis for more details and an annotated graph.
>>> FEATURED STOCK ARTICLE : Breakout to New All-Time High for Another Regional Bank - 5/21/2021 |
View all notes |
Set NEW NOTE alert |
Company Profile |
SEC
News |
Chart |
Request a new note
C
A
S
I |
SIVB
-
NASDAQ
S V B Financial Group
BANKING - Regional - Pacific Banks
|
$579.71
|
+11.17
1.96% |
$581.68
|
305,865
57.39% of 50 DAV
50 DAV is 533,000
|
$595.90
-2.72%
|
4/23/2021
|
$579.70
|
PP = $577.16
|
|
MB = $606.02
|
Most Recent Note - 5/25/2021 5:33:56 PM
Y - Hovering in a tight range and stubbornly holding its ground near its all-time high with volume totals cooling. Confirming volume-driven gains are still needed to help clinch a convincing technical buy signal. Its 50 DMA line ($536) defines near-term support to watch. Reported earnings +293% on +64% sales revenues for the Mar '21 quarter versus the year ago period, its 3rd strong comparison. Completed a new Public Offering on 3/24/21.
>>> FEATURED STOCK ARTICLE : Sputtering Since Featured Without Confirming Gains - 5/20/2021 |
View all notes |
Set NEW NOTE alert |
Company Profile |
SEC
News |
Chart |
Request a new note
C
A
S
I |
LOGI
-
NASDAQ
Logitech Intl Sa
COMPUTER HARDWARE - Computer Peripherals
|
$119.60
|
+3.53
3.04% |
$119.85
|
873,640
115.56% of 50 DAV
50 DAV is 756,000
|
$120.24
-0.53%
|
5/26/2021
|
$119.13
|
PP = $120.34
|
|
MB = $126.36
|
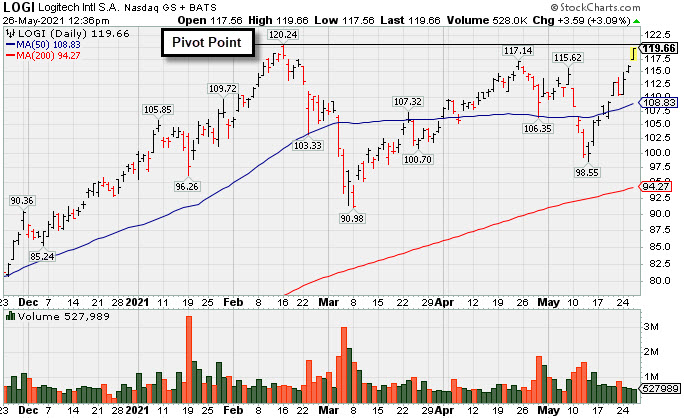
 Most Recent Note - 5/26/2021
Y - Color code is changed to yellow with pivot point cited based on its 2/16/21 high plus 10 cents. Switzerland-based Computer - Hardware/Peripherals firm is challenging its all-time high with today's 9th gain in the span of 10 sessions. Subsequent gains above its pivot point backed by at least +40% above average volume may trigger a technical buy signal. Reported Mar '21 quarterly earnings +245% on +117% sales revenues versus the year ago period, its 4th strong quarter well above the +25% minimum earnings guideline (C criteria). Annual earnings (A criteria) history has been strong. Sequential comparisons show encouraging acceleration in its sales revenues growth rate.
 There are no Featured Stock Updates™ available for this stock at this time. You may request one by clicking the Request a New Note link below |
View all notes |
Set NEW NOTE alert |
Company Profile |
SEC
News |
Chart |
Request a new note
C
A
S
I
There are no Featured Stock Updates™ available for this stock at this time. You may request one by clicking the Request a New Note link below |
View all notes |
Set NEW NOTE alert |
Company Profile |
SEC
News |
Chart |
Request a new note
C
A
S
I |
CROX
-
NASDAQ
Crocs Inc
CONSUMER NON-DURABLES - Textile - Apparel Footwear
|
$107.45
|
+3.94
3.81% |
$108.84
|
1,206,066
86.96% of 50 DAV
50 DAV is 1,387,000
|
$109.91
-2.24%
|
4/27/2021
|
$99.81
|
PP = $86.50
|
|
MB = $90.83
|
Most Recent Note - 5/26/2021 3:55:35 PM
G - Extended from any sound base and challenging its all-time high with today's 4th consecutive gain with below average volume. Its 50 DMA line ($89.32) defines initial support above prior highs in the $86 area.
>>> FEATURED STOCK ARTICLE : Powerful "Breakaway Gap" for CROX - 4/27/2021 |
View all notes |
Set NEW NOTE alert |
Company Profile |
SEC
News |
Chart |
Request a new note
C
A
S
I |
RCKY
-
NASDAQ
Rocky Brands Inc
CONSUMER NON-DURABLES - Textile - Apparel Footwear
|
$57.34
|
+4.60
8.72% |
$58.67
|
137,816
145.07% of 50 DAV
50 DAV is 95,000
|
$69.00
-16.90%
|
5/5/2021
|
$61.65
|
PP = $61.55
|
|
MB = $64.63
|
Most Recent Note - 5/26/2021 3:53:02 PM
G - Gapped up today and rebounded above its 50 DMA line ($55.16) helping its outlook improve. Fundamentals remain strong.
>>> FEATURED STOCK ARTICLE : Rocky Brands Powered Higher After Strong Earnings - 5/5/2021 |
View all notes |
Set NEW NOTE alert |
Company Profile |
SEC
News |
Chart |
Request a new note
C
A
S
I |
Symbol/Exchange
Company Name
Industry Group |
PRICE |
CHANGE
(%Change) |
Day High |
Volume
(% DAV)
(% 50 day avg vol) |
52 Wk Hi
% From Hi |
Featured
Date |
Price
Featured |
Pivot Featured |
|
Max Buy |
CRL
-
NYSE
Charles River Labs Intl
DRUGS - Biotechnology
|
$324.51
|
-5.01
-1.52% |
$333.81
|
542,229
89.62% of 50 DAV
50 DAV is 605,000
|
$349.13
-7.05%
|
12/17/2020
|
$247.06
|
PP = $257.98
|
|
MB = $270.88
|
Most Recent Note - 5/26/2021 5:14:57 PM
G - Consolidating above its 50 DMA line ($314.69) which defines initial support above the prior high ($303). Reported Mar '21 quarterly earnings +38% on +17%v sales revenues versus the year ago period. Two of the past 3 quarterly comparisons have been above the +25% minimum earnings guideline (C criteria).
>>> FEATURED STOCK ARTICLE : Pulling Back From Record High Following Strong Quarterly Report - 5/6/2021 |
View all notes |
Set NEW NOTE alert |
Company Profile |
SEC
News |
Chart |
Request a new note
C
A
S
I |
CAMT
-
NASDAQ
Camtek Ltd
ELECTRONICS - Scientific and Technical Instrum
|
$35.40
|
+0.41
1.17% |
$35.79
|
259,622
88.61% of 50 DAV
50 DAV is 293,000
|
$36.14
-2.05%
|
4/28/2021
|
$35.03
|
PP = $35.34
|
|
MB = $37.11
|
Most Recent Note - 5/25/2021 12:24:16 PM
Y - Challenging its 52-week high today after a 5th consecutive gain on the prior session with heavy volume clinched a technical buy signal. Abruptly rebounded above its 50 DMA line ($31.18) toward the prior high.
>>> FEATURED STOCK ARTICLE : Earnings Acceleration and Perched at High After Ascending Base - 4/28/2021 |
View all notes |
Set NEW NOTE alert |
Company Profile |
SEC
News |
Chart |
Request a new note
C
A
S
I |
ASML
-
NASDAQ
A S M L Holding N.V. NY
ELECTRONICS - Semiconductor Equipment and Mate
|
$665.77
|
-6.52
-0.97% |
$669.54
|
593,597
57.41% of 50 DAV
50 DAV is 1,034,000
|
$679.44
-2.01%
|
5/25/2021
|
$669.59
|
PP = $675.75
|
|
MB = $709.54
|
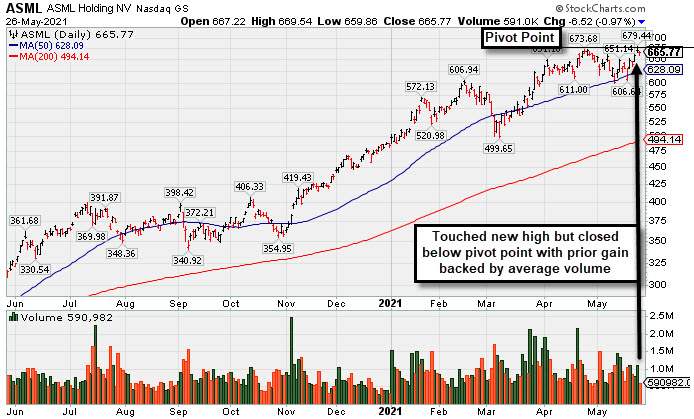
Most Recent Note - 5/26/2021 5:11:47 PM
Y - Pulled back today with light volume. Highlighted in yellow with pivot point cited based on its 4/26/21 high plus 10 cents. Subsequent gain and a strong close above its pivot point backed by at least +40% above average volume is needed to trigger a proper technical buy signal. Found support at its 50 DMA line ($629) during a 4-week consolidation. Reported Mar '21 quarterly earnings +264% on +90% sales revenues versus the year-ago period. The 4 latest quarterly comparisons were above the +25% minimum earnings guideline (C criteria). Annual earnings history included a small downturn in FY '19. Dutch Electronics - Semiconductor Equipment firm made an impressive rally from a deep slump in March. See the latest FSU analysis for more details and an annotated graph.
>>> FEATURED STOCK ARTICLE : Perched Near All-Time High After Short Base Above 50-Day Average - 5/26/2021 |
View all notes |
Set NEW NOTE alert |
Company Profile |
SEC
News |
Chart |
Request a new note
C
A
S
I |
BRKS
-
NASDAQ
Brooks Automation
ELECTRONICS - Semiconductor Equipment and Mate
|
$98.01
|
+1.93
2.01% |
$98.40
|
500,571
59.10% of 50 DAV
50 DAV is 847,000
|
$108.72
-9.85%
|
4/5/2021
|
$99.31
|
PP = $91.88
|
|
MB = $96.47
|
Most Recent Note - 5/25/2021 5:43:05 PM
Y - Color code is changed to yellow after pulling back below its "max buy" level. Volume totals have been cooling while consolidating above its 50 DMA line ($93.21) where it found prompt support. More damaging losses below the recent low ($86.12 on 5/12/21) would raise serious concerns.
>>> FEATURED STOCK ARTICLE : Extended From Base and Consolidating After Recent Rally - 4/30/2021 |
View all notes |
Set NEW NOTE alert |
Company Profile |
SEC
News |
Chart |
Request a new note
C
A
S
I |
OPY
-
NYSE
Oppenheimer Holdings Inc
FINANCIAL SERVICES - Investment Brokerage - Regiona
|
$48.67
|
+0.25
0.52% |
$48.93
|
46,472
41.13% of 50 DAV
50 DAV is 113,000
|
$52.45
-7.21%
|
2/25/2021
|
$38.95
|
PP = $38.11
|
|
MB = $40.02
|
Most Recent Note - 5/24/2021 6:05:58 PM
G - Posted a 3rd consecutive quiet gain, still consolidating above its 50 DMA line($45.20) and near its all-time high, very extended from any sound base. Bullish action came after it reported Mar '21 quarterly earnings +402% on +59% sales revenues versus the year ago period. Prior high in the $44 area defines support to watch below its 50 DMA line.
>>> FEATURED STOCK ARTICLE : Extended From Any Sound Base After Decent Rally - 5/17/2021 |
View all notes |
Set NEW NOTE alert |
Company Profile |
SEC
News |
Chart |
Request a new note
C
A
S
I |
Symbol/Exchange
Company Name
Industry Group |
PRICE |
CHANGE
(%Change) |
Day High |
Volume
(% DAV)
(% 50 day avg vol) |
52 Wk Hi
% From Hi |
Featured
Date |
Price
Featured |
Pivot Featured |
|
Max Buy |
MTH
-
NYSE
Meritage Homes Corp
MATERIALS and CONSTRUCTION - Residential Construction
|
$108.66
|
+2.41
2.27% |
$109.09
|
413,814
101.18% of 50 DAV
50 DAV is 409,000
|
$120.19
-9.59%
|
5/12/2021
|
$108.84
|
PP = $117.16
|
|
MB = $123.02
|
Most Recent Note - 5/24/2021 6:03:50 PM
Y -Volume totals have been cooling while consolidating since hitting a new 52-weekn high on 5/10/21. Subsequent gains above the pivot point with at least +40% above average volume would be a reassuring confirmation of fresh institutional buying demand. Reported earnings +88% on +20% sales revenues for the Mar '21 quarter versus the year ago period, its 7th consecutive strong quarterly comparison above the +25% minimum guideline (C criteria). Annual earnings (A criteria) history has been strong after a downturn in FY '15.
>>> FEATURED STOCK ARTICLE : Homebuilder Pulled Back After Hitting New High - 5/13/2021 |
View all notes |
Set NEW NOTE alert |
Company Profile |
SEC
News |
Chart |
Request a new note
C
A
S
I |
CRMT
-
NASDAQ
Americas Car-Mart Inc
SPECIALTY RETAIL - Auto Dealerships
|
$174.52
|
+15.02
9.42% |
$175.01
|
151,856
353.15% of 50 DAV
50 DAV is 43,000
|
$165.00
5.77%
|
5/25/2021
|
$159.80
|
PP = $165.10
|
|
MB = $173.36
|
Most Recent Note - 5/26/2021 12:08:28 PM
Y - Hitting a new all-time high with heavy volume behind today's 5th consecutive gain. On 5/25/21 it was noted - "Formed an orderly 10-week base and a new pivot point is cited based on its 3/15/21 high plus 10 cents. Subsequent gains and a strong close above its pivot point backed by at least +40% above average volume is needed to trigger a proper technical buy signal. Bullish action came after it reported earnings +359% on +43% sales revenues for the Apr '21 quarter versus the year-ago period, its 4th consecutive quarterly earnings increase above the +25% minimum guideline (C criteria) with accelerating sales revenues growth rate. Annual earnings (A criteria) history has been strong. See the latest FSU analysis for more details and a new annotated graph."
>>> FEATURED STOCK ARTICLE : Car Dealership Firm Challenging All-Time High - 5/25/2021 |
View all notes |
Set NEW NOTE alert |
Company Profile |
SEC
News |
Chart |
Request a new note
C
A
S
I |
LAD
-
NYSE
Lithia Motors Inc Cl A
SPECIALTY RETAIL - Auto Dealerships
|
$357.52
|
+8.96
2.57% |
$361.93
|
409,190
106.84% of 50 DAV
50 DAV is 383,000
|
$417.98
-14.46%
|
4/21/2021
|
$377.00
|
PP = $418.08
|
|
MB = $438.98
|
Most Recent Note - 5/26/2021 3:57:24 PM
G - Completed a new Public Offering last week. A rebound above its 50 DMA line ($379) is needed for its outlook to improve. Faces resistance due to overhead supply up to the $417 level.
>>> FEATURED STOCK ARTICLE : Gap Down After Proposing New Public Offering - 5/19/2021 |
View all notes |
Set NEW NOTE alert |
Company Profile |
SEC
News |
Chart |
Request a new note
C
A
S
I |
MED
-
NYSE
Medifast Inc
SPECIALTY RETAIL - Specialty Retail, Other
|
$330.52
|
+5.88
1.81% |
$331.19
|
116,693
94.11% of 50 DAV
50 DAV is 124,000
|
$332.00
-0.45%
|
5/11/2021
|
$285.72
|
PP = $279.56
|
|
MB = $293.54
|
Most Recent Note - 5/24/2021 5:59:24 PM
G - Rallied further into record high territory with today's gain backed by lighter volume, getting very extended from the previously noted base. Prior highs in the $279 area define initial support to watch on pullbacks.
>>> FEATURED STOCK ARTICLE : Held Ground Following Breakout Gain on Prior Session - 5/11/2021 |
View all notes |
Set NEW NOTE alert |
Company Profile |
SEC
News |
Chart |
Request a new note
C
A
S
I |
CLFD
-
NASDAQ
Clearfield Inc
TELECOMMUNICATIONS - Cables / Satalite Equipment
|
$36.97
|
+1.15
3.21% |
$37.01
|
43,133
33.44% of 50 DAV
50 DAV is 129,000
|
$40.26
-8.17%
|
4/26/2021
|
$39.68
|
PP = $38.85
|
|
MB = $40.79
|
Most Recent Note - 5/24/2021 5:58:10 PM
Y - Consolidating in a choppy fashion above its 50 DMA line ($33.28) and recent lows which define important near-term support. Fundamentals remain strong after it reported Mar '21 quarterly earnings +440% on +45% sales revenues versus the year ago period, continuing its strong earnings track record. See the latest FSU analysis for more details and a new annotated graph.
>>> FEATURED STOCK ARTICLE : Stalled and Found Support Above 50-Day Moving Average - 5/24/2021 |
View all notes |
Set NEW NOTE alert |
Company Profile |
SEC
News |
Chart |
Request a new note
C
A
S
I |
Symbol/Exchange
Company Name
Industry Group |
PRICE |
CHANGE
(%Change) |
Day High |
Volume
(% DAV)
(% 50 day avg vol) |
52 Wk Hi
% From Hi |
Featured
Date |
Price
Featured |
Pivot Featured |
|
Max Buy |
FSBW
-
NASDAQ
F S Bancorp
Banks-West/Southwest
|
$69.64
|
+1.49
2.19% |
$70.05
|
14,912
106.51% of 50 DAV
50 DAV is 14,000
|
$73.62
-5.41%
|
5/18/2021
|
$70.16
|
PP = $73.72
|
|
MB = $77.41
|
Most Recent Note - 5/26/2021 5:18:32 PM
Y - This thinly-traded Bank is perched within striking distance of the pivot point cited based on its 3/08/21 high plus 10 cents, still consolidating above its 50 DMA line ($68.24) where it found prompt support during its ongoing ascent. Subsequent gains above the pivot point backed by at least +40% above average volume are needed to trigger a technical buy signal. Reported Mar '21 quarterly earnings +137% on +16% sales revenues versus the year ago period, its 4th consecutive strong quarterly comparison above the +25% minimum earnings guideline (C criteria), matching the fact-based investment system's winning models. Its annual earnings (A criteria) history has been great. This thinly traded Bank completed a new Public Offering on 9/08/17.
>>> FEATURED STOCK ARTICLE : Thinly-Traded Bank Consolidating Above 50-Day Moving Average - 5/18/2021 |
View all notes |
Set NEW NOTE alert |
Company Profile |
SEC
News |
Chart |
Request a new note
C
A
S
I |
SMPL
-
NASDAQ
Simply Good Foods Co
Food-Confectionery
|
$34.98
|
+0.44
1.27% |
$35.12
|
346,008
56.17% of 50 DAV
50 DAV is 616,000
|
$35.34
-1.02%
|
12/28/2020
|
$30.40
|
PP = $31.44
|
|
MB = $33.01
|
Most Recent Note - 5/24/2021 6:08:27 PM
G - Perched within close striking distance of its 52-week and all-time highs. Found prompt support near its 50 DMA line ($32.85). Reported Feb '21 quarterly earnings +9% on +2% sales revenues versus the year ago period, below the +25% minimum earnings guideline (C criteria), raising fundamental concerns. Its current Relative Strength Rating has improved to 85, above the 80+ minimum guideline for buy candidates.
>>> FEATURED STOCK ARTICLE : Hovering Near All-Time High Following Lackluster Quarter - 5/10/2021 |
View all notes |
Set NEW NOTE alert |
Company Profile |
SEC
News |
Chart |
Request a new note
C
A
S
I |
QRVO
-
NASDAQ
"Qorvo, Inc"
ELECTRONICS - Semiconductor - Integrated Cir
|
$179.47
|
-1.15
-0.64% |
$182.97
|
1,118,508
96.99% of 50 DAV
50 DAV is 1,153,200
|
$201.68
-11.01%
|
4/1/2021
|
$190.48
|
PP = $191.92
|
|
MB = $201.52
|
Most Recent Note - 5/26/2021 5:16:40 PM
G - Still sputtering below its 50 DMA line ($183.78) which may act as resistance. A rebound above the 50 DMA line is needed for its outlook to improve. Its Relative Strength Rating is 70, below the 80+ minimum for buy candidates. Reported Mar '21 quarterly earnings +75% on +36% sales revenues versus the year ago period, its 3rd very strong quarterly comparison. It stalled after recently wedging up to new highs from a 9-week base.
>>> FEATURED STOCK ARTICLE : Quiet Gain For Best Ever Close - 4/29/2021 |
View all notes |
Set NEW NOTE alert |
Company Profile |
SEC
News |
Chart |
Request a new note
C
A
S
I |
YETI
-
NYSE
Yeti Holdings Inc
Leisure-Products
|
$87.62
|
+1.87
2.18% |
$88.04
|
965,171
67.64% of 50 DAV
50 DAV is 1,427,000
|
$91.55
-4.29%
|
5/13/2021
|
$84.20
|
PP = $90.65
|
|
MB = $95.18
|
Most Recent Note - 5/24/2021 12:56:58 PM
Y - Hitting a new all-time high with today's 3rd consecutive gain backed by ever-increasing volume. Quickly rebounded after a pullback last week tested support at its 50 DMA line and prior high. Reported Mar 21 quarterly earnings +245% on +42% sales revenues versus the year ago period, continuing its strong earnings track record. Previously noted that a valid secondary buy point exists from its 10 WMA line up to 5% above the latest high.
>>> FEATURED STOCK ARTICLE : Hovering Near Record High Following Volume-Driven Gains - 5/3/2021 |
View all notes |
Set NEW NOTE alert |
Company Profile |
SEC
News |
Chart |
Request a new note
C
A
S
I |
MRBK
-
NASDAQ
Meridian Corp
Banks-Northeast
|
$26.29
|
+0.07
0.27% |
$26.56
|
16,957
51.38% of 50 DAV
50 DAV is 33,000
|
$29.18
-9.90%
|
5/18/2021
|
$25.58
|
PP = $28.06
|
|
MB = $29.46
|
Most Recent Note - 5/24/2021 6:02:18 PM
Y - Volume totals have been cooling while hovering near its 52-week high hit when featured on 5/18/21. Reported Mar '21 earnings +323% on +93% sales revenues versus the year ago period, continuing its strong earnings track record. Recent low ($24.01 on 4/21/21) defines important near-term support where any violation may trigger a worrisome technical sell signal. Its Relative Strength Rating is 81, above the 80 minimum guideline.
>>> FEATURED STOCK ARTICLE : Bank Consolidating Near 50 Day Moving Average Line - 5/7/2021 |
View all notes |
Set NEW NOTE alert |
Company Profile |
SEC
News |
Chart |
Request a new note
C
A
S
I |
Symbol/Exchange
Company Name
Industry Group |
PRICE |
CHANGE
(%Change) |
Day High |
Volume
(% DAV)
(% 50 day avg vol) |
52 Wk Hi
% From Hi |
Featured
Date |
Price
Featured |
Pivot Featured |
|
Max Buy |
CLAR
-
NASDAQ
Clarus Corporation
Leisure-Products
|
$23.02
|
+0.86
3.88% |
$23.05
|
82,856
47.35% of 50 DAV
50 DAV is 175,000
|
$23.13
-0.48%
|
5/12/2021
|
$21.40
|
PP = $19.73
|
|
MB = $20.72
|
Most Recent Note - 5/26/2021 5:13:34 PM
G - Posted a small gain today with light volume for a best-ever close. Very extended from the previously noted base. Prior high ($19.63 on 3/09/21) defines initial support to watch above its 50 DMA line ($18.76).
>>> FEATURED STOCK ARTICLE : 4 Volume-Driven Gains Into New High Territory - 5/12/2021 |
View all notes |
Set NEW NOTE alert |
Company Profile |
SEC
News |
Chart |
Request a new note
C
A
S
I |