You are not logged in.
This means you
CAN ONLY VIEW reports that were published prior to Tuesday, April 8, 2025.
You
MUST UPGRADE YOUR MEMBERSHIP if you want to see any current reports.
AFTER MARKET UPDATE - MONDAY, FEBRUARY 22ND, 2021
Previous After Market Report Next After Market Report >>>
|
|
|
|
DOW |
+27.37 |
31,521.69 |
+0.09% |
|
Volume |
1,153,967,016 |
+8% |
|
Volume |
6,424,734,200 |
-3% |
|
NASDAQ |
-339.17 |
13,535.30 |
-2.44% |
|
Advancers |
1,527 |
47% |
|
Advancers |
1,522 |
39% |
|
S&P 500 |
-30.21 |
3,876.50 |
-0.77% |
|
Decliners |
1,692 |
53% |
|
Decliners |
2,380 |
61% |
|
Russell 2000 |
-15.62 |
2,251.07 |
-0.69% |
|
52 Wk Highs |
332 |
|
|
52 Wk Highs |
371 |
|
|
S&P 600 |
+7.74 |
1,296.51 |
+0.60% |
|
52 Wk Lows |
15 |
|
|
52 Wk Lows |
21 |
|
|
 |
Breadth Slightly Negative as Major Indices Show Some Weakness
Kenneth J. Gruneisen - Passed the CAN SLIM® Master's Exam
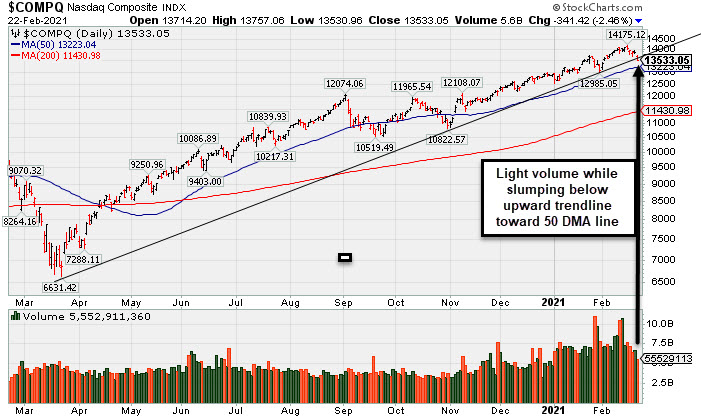
The Dow finished 27 points higher. The S&P 500 dipped 0.8% to extend its longest losing streak (five sessions) of the year. The Nasdaq Composite slumped 2.5%. The volume totals were mixed, higher than the prior session on the NYSE and lighter on the Nasdaq exchange. Decliners led advancers by a narrow margin on the NYSE and by nearly 5-3 on the Nasdaq exchange. There were 88 high-ranked companies from the Leaders List that hit new 52-week highs and were listed on the BreakOuts Page, versus the total of 89 on the prior session. New 52-week highs totals expanded and easily outnumbered new 52-week lows totals on both exchanges. The major indices are in a confirmed uptrend (M criteria) with healthy leadership provided by many stocks hitting new highs. Investors are reminded to always make buying and selling decisions based based on the strict criteria and rules of the fact-based investment system. PICTURED: The Nasdaq Composite Index quietly slumped below an upward trendline connecting the March and October lows. It is still well above its 50-day moving average (DMA) line.
U.S. stocks finished mostly lower on Monday, with growth-oriented shares lagging as investors continue to monitor rising Treasury yields. The recent backup in Treasury yields continued amid optimism that fiscal stimulus and broad vaccinations will inspire a swifter-than-anticipated U.S. economic recovery. A report this morning from the Conference Board revealed that the Leading Index ticked 0.5% higher in January, above expectations of a 0.4% increase. The yield on the benchmark 10-year note rose 2 basis points to finish at 1.36%, the highest closing level in 12 months.
Six of 11 S&P 500 sectors finished in positive territory. Energy stocks paced the gains, climbing 3.5% as WTI crude advanced 3.8% to $61.49/barrel. Information Technology and Consumer Discretionary shares lagged, with Apple (AAPL -2.98%) and Amazon (AMZN -2.13%) falling. In earnings, Discovery Inc. (DISCA +8.86%) blasted higher after topping Wall Street profit projections and announcing that its Discovery+ streaming service is on pace to have 12 million subscribers by the end of the month. Meanwhile, Royal Caribbean (RCL +9.51%) rose after reporting a 30% increase in quarterly bookings amid pent up travel demand. In M&A news, Cooper Tire (CTB +29.40%) gapped up for new all-time highs after agreeing to be acquired by rival Goodyear Tire (GT +21.05%) for $2.8 billion in cash and stock. |
 Kenneth J. Gruneisen started out as a licensed stockbroker in August 1987, a couple of months prior to the historic stock market crash that took the Dow Jones Industrial Average down -22.6% in a single day. He has published daily fact-based fundamental and technical analysis on high-ranked stocks online for two decades. Through FACTBASEDINVESTING.COM, Kenneth provides educational articles, news, market commentary, and other information regarding proven investment systems that work in good times and bad.
Comments contained in the body of this report are technical opinions only and are not necessarily those of Gruneisen Growth Corp. The material herein has been obtained from sources believed to be reliable and accurate, however, its accuracy and completeness cannot be guaranteed. Our firm, employees, and customers may effect transactions, including transactions contrary to any recommendation herein, or have positions in the securities mentioned herein or options with respect thereto. Any recommendation contained in this report may not be suitable for all investors and it is not to be deemed an offer or solicitation on our part with respect to the purchase or sale of any securities. |
|
 |
Commodity-Linked Groups Posted Standout Gains
Kenneth J. Gruneisen - Passed the CAN SLIM® Master's Exam
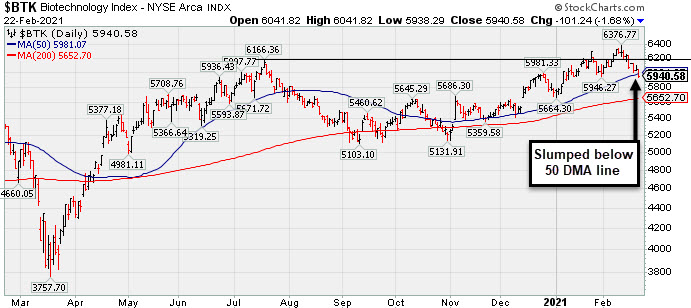
Commodity-linked groups were standout gainers as the Gold & Silver Index ($XAU +5.05%), Oil Services Index ($OSX +4.01%), and Integrated Oil Index ($XOI +3.39%) each notched a solid gain. The tech sector had a negative bias as the Semiconductor Index ($SOX -3.71%), Biotech Index ($BTK -1.68%), and Networking Index ($NWX -1.52%) ended unanimously lower. The Bank Index ($BKX +1.40%) was a positive influence while the Broker/Dealer Index ($XBD +0.06%) finished flat and the Retail Index ($RLX -1.45%) lost ground.
PICTURED: The Biotech Index ($BTK -1.68%) has slumped from a new record high hit and closed back below its 50-day moving average (DMA) line.
| Oil Services |
$OSX |
54.05 |
+2.08 |
+4.01% |
+21.93% |
| Integrated Oil |
$XOI |
979.09 |
+32.09 |
+3.39% |
+23.55% |
| Semiconductor |
$SOX |
3,103.97 |
-119.50 |
-3.71% |
+11.03% |
| Networking |
$NWX |
803.16 |
-12.42 |
-1.52% |
+12.00% |
| Broker/Dealer |
$XBD |
440.38 |
+0.29 |
+0.06% |
+16.63% |
| Retail |
$RLX |
3,606.17 |
-53.03 |
-1.45% |
+1.20% |
| Gold & Silver |
$XAU |
143.68 |
+6.90 |
+5.05% |
-0.35% |
| Bank |
$BKX |
115.52 |
+1.60 |
+1.40% |
+17.98% |
| Biotech |
$BTK |
5,940.58 |
-101.24 |
-1.68% |
+3.51% |
|
|
|
 |
Negative Reversal When Poised to Convincingly Breakout
Kenneth J. Gruneisen - Passed the CAN SLIM® Master's Exam
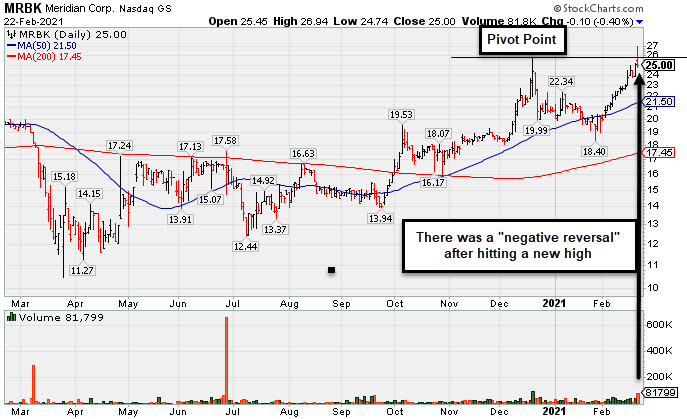
Meridian Corp (MRBK -$0.10 or -0.40% to $25.00) had a "negative reversal" today after hitting a new high. It was highlighted in yellow with pivot point cited based on its 12/18/21 high plus 10 cents in the earlier mid-day report (read here). It was noted - "A gain and strong close above its pivot point backed by at least +40% above average volume may trigger a technical buy signal." It has tallied an impressive spurt of gains in recent weeks after briefly undercutting its 50-day moving average (DMA) line. However, the negative reversal is a sign it encountered distributional pressure. Confirming volume-driven gains for new high (N criteria) are still needed to clinch a proper technical buy signal.
The thinly-traded company is in the Banks-Northeast industry group which currently has a Group Relative Strength Rating of 56 (B). There are a fair number of other strong leaders (L criteria) in the group. The past 3 quarterly comparisons through Dec '20 had earnings increases well above the +25% minimum guideline (C criteria). Annual earnings growth (A criteria) has been good since it Nov '17 IPO at $17.
The number of top rated funds that own its shares rose from 30 in Mar '20 to 116 in Dec '20, a reassuring sign concerning the I criteria. The current Up/Down Volume Ratio of 2.1 is an unbiased indication its shares have been under accumulation over the past 50 days. The small supply of only 6.1 million shares outstanding (S criteria) can contribute to greater volatility in the event of institutional buying or selling. |
|
|
Color Codes Explained :
Y - Better candidates highlighted by our
staff of experts.
G - Previously featured
in past reports as yellow but may no longer be buyable under the
guidelines.
***Last / Change / Volume data in this table is the closing quote data***
Symbol/Exchange
Company Name
Industry Group |
PRICE |
CHANGE
(%Change) |
Day High |
Volume
(% DAV)
(% 50 day avg vol) |
52 Wk Hi
% From Hi |
Featured
Date |
Price
Featured |
Pivot Featured |
|
Max Buy |
 CRL
-
NYSE
CRL
-
NYSE
Charles River Labs Intl
DRUGS - Biotechnology
|
$283.59
|
-5.96
-2.06% |
$286.09
|
353,177
109.34% of 50 DAV
50 DAV is 323,000
|
$303.79
-6.65%
|
12/17/2020
|
$247.06
|
PP = $257.98
|
|
MB = $270.88
|
Most Recent Note - 2/17/2021 12:16:19 PM
G - Reported Dec '20 quarterly earnings +19% on +14% sales revenues versus the year ago period, below the +25% minimum earnings guideline (C criteria). Hitting a new record high today. Volume and volatility often increase near earnings news.
>>> FEATURED STOCK ARTICLE : Testing Important Support on Pullback - 1/29/2021 |
View all notes |
Set NEW NOTE alert |
Company Profile |
SEC
News |
Chart |
Request a new note
C
A
S
I |
AMD
-
NYSE
Advanced Micro Devices
ELECTRONICS - Semiconductor - Broad Line
|
$85.37
|
-4.21
-4.70% |
$88.30
|
36,729,841
86.90% of 50 DAV
50 DAV is 42,264,400
|
$99.23
-13.97%
|
11/18/2020
|
$82.54
|
PP = $88.72
|
|
MB = $93.16
|
 Most Recent Note - 2/22/2021 6:23:18 PM
Slumped further its 50 DMA line ($91.58) which is now downward sloping. A rebound above the 50 DMA line is needed for its outlook to improve. It will be dropped from the Featured Stocks list tonight. Its current Relative Strength rating of 57 is well below the 80+ minimum guideline for buy candidates while it ended-14% off its high. Fundamentals remain strong after it reported Dec '20 quarterly earnings +63% on +53% sales revenues versus the year ago period.
>>> FEATURED STOCK ARTICLE : Close Above 50-Day Moving Average But Relative Strength a Concern - 2/10/2021 |
View all notes |
Set NEW NOTE alert |
Company Profile |
SEC
News |
Chart |
Request a new note
C
A
S
I |
AMRC
-
NYSE
Ameresco Inc Cl A
ENERGY - Alternative
|
$62.12
|
-2.16
-3.36% |
$63.97
|
262,336
56.78% of 50 DAV
50 DAV is 462,000
|
$70.26
-11.59%
|
12/15/2020
|
$46.72
|
PP = $47.10
|
|
MB = $49.46
|
Most Recent Note - 2/19/2021 5:41:53 PM
G - Posted a gain today with light volume. Recently retreating from its all-time high, it is extended from any sound base. Its 50-day moving average (DMA) line ($56.43) defines near-term support to watch.
>>> FEATURED STOCK ARTICLE : Rebounding After Retreat From Record High - 2/1/2021 |
View all notes |
Set NEW NOTE alert |
Company Profile |
SEC
News |
Chart |
Request a new note
C
A
S
I |
TREX
-
NYSE
Trex Company Inc
MATERIALS and CONSTRUCTION - General Building Materials
|
$100.19
|
-2.42
-2.36% |
$102.93
|
893,373
128.54% of 50 DAV
50 DAV is 695,000
|
$107.64
-6.92%
|
6/26/2020
|
$54.53
|
PP = $66.47
|
|
MB = $69.79
|
Most Recent Note - 2/22/2021 6:37:56 PM
G - Pulled back today after recently wedging to new all-time highs with gains backed by below average volume. Its 50 DMA line ($91.71) and prior low define important support to watch. Reported Dec '20 quarterly earnings +19% on +39% versus the year ago period, its 2nd quarterly comparison below the +25% minimum guideline (C criteria) raising more fundamental concerns.
>>> FEATURED STOCK ARTICLE : Wedged to New Highs With Earnings Report Due Soon - 2/16/2021 |
View all notes |
Set NEW NOTE alert |
Company Profile |
SEC
News |
Chart |
Request a new note
C
A
S
I |
CLFD
-
NASDAQ
Clearfield Inc
TELECOMMUNICATIONS - Cables / Satalite Equipment
|
$34.85
|
-1.24
-3.44% |
$36.20
|
105,255
67.91% of 50 DAV
50 DAV is 155,000
|
$38.75
-10.06%
|
1/20/2021
|
$31.38
|
PP = $28.42
|
|
MB = $29.84
|
Most Recent Note - 2/19/2021 5:33:49 PM
G - Perched near its all-time high, very extended from any sound base. Its 50 DMA line ($29.35) and prior highs in the $28 area define important near-term support to watch. Reported Dec '20 quarterly earnings +475% on +40% sales revenues versus the year ago period, continuing its strong earning track record.
>>> FEATURED STOCK ARTICLE : Perched Near Record High With Earnings Report Due Soon - 1/27/2021 |
View all notes |
Set NEW NOTE alert |
Company Profile |
SEC
News |
Chart |
Request a new note
C
A
S
I |
Symbol/Exchange
Company Name
Industry Group |
PRICE |
CHANGE
(%Change) |
Day High |
Volume
(% DAV)
(% 50 day avg vol) |
52 Wk Hi
% From Hi |
Featured
Date |
Price
Featured |
Pivot Featured |
|
Max Buy |
NOW
-
NYSE
Servicenow Inc
Computer Sftwr-Enterprse
|
$550.26
|
-20.47
-3.59% |
$566.03
|
1,036,992
75.89% of 50 DAV
50 DAV is 1,366,500
|
$598.37
-8.04%
|
8/20/2020
|
$453.34
|
PP = $454.79
|
|
MB = $477.53
|
Most Recent Note - 2/17/2021 5:34:27 PM
G - Holding its ground stubbornly, it closed today only -2.9% off its all-time high, and volume totals have been cooling. Relative Strength rating has slumped to 67, well below the 80+ minimum guideline for buy candidates. A new pivot point was not cited due to fundamental concerns noted as its impressive rally has continued. Gapped up on 1/28/21 promptly rebounding above its 50 DMA line ($547). Fundamental concerns remain after it reported Dec '20 quarterly earnings +22% on +31% sales revenues versus the year ago period, its 2nd consecutive comparison below the +25% minimum guideline (C criteria) of the fact-based investment system.
>>> FEATURED STOCK ARTICLE : Hit New Highs With Latest Gains Backed by Light Volume - 2/5/2021 |
View all notes |
Set NEW NOTE alert |
Company Profile |
SEC
News |
Chart |
Request a new note
C
A
S
I |
SMPL
-
NASDAQ
Simply Good Foods Co
Food-Confectionery
|
$28.34
|
+0.22
0.78% |
$28.70
|
742,128
65.77% of 50 DAV
50 DAV is 1,128,300
|
$32.03
-11.52%
|
12/28/2020
|
$30.40
|
PP = $31.44
|
|
MB = $33.01
|
Most Recent Note - 2/19/2021 5:32:39 PM
G - Pulled back today for a 5th consecutive loss and violated its 50 DMA line ($28.35) raising concerns. Its Relative Strength Rating is 59, well below the 80+ minimum guideline. Its prior low ($26.78) defines the next important near term support to watch.
>>> FEATURED STOCK ARTICLE : Pulling Back Quietly After Rebounding Near All-Time High - 2/17/2021 |
View all notes |
Set NEW NOTE alert |
Company Profile |
SEC
News |
Chart |
Request a new note
C
A
S
I |
ALRM
-
NASDAQ
Alarm.com Holdings Inc
Security/Sfty
|
$94.67
|
-4.62
-4.65% |
$98.69
|
280,210
62.13% of 50 DAV
50 DAV is 451,000
|
$108.67
-12.88%
|
2/9/2021
|
$71.88
|
PP = $108.67
|
|
MB = $114.10
|
Most Recent Note - 2/22/2021 6:20:15 PM
G - Color code is changed to green after quietly slumping to a close below its 50 DMA line ($97.21) raising concerns. Due to report Dec '20 quarterly results on 2/25/21.
>>> FEATURED STOCK ARTICLE : Perched Near Prior High After Finding Support at 10 WMA - 2/11/2021 |
View all notes |
Set NEW NOTE alert |
Company Profile |
SEC
News |
Chart |
Request a new note
C
A
S
I |
TEAM
-
NASDAQ
Atlassian Corp Plc Cl A
Comp Sftwr-Spec Enterprs
|
$241.01
|
-17.40
-6.73% |
$254.49
|
1,424,594
102.05% of 50 DAV
50 DAV is 1,396,000
|
$262.40
-8.15%
|
10/12/2020
|
$193.77
|
PP = $199.60
|
|
MB = $209.58
|
Most Recent Note - 2/22/2021 6:31:49 PM
G - Abruptly retreated from its all-time high with today's big loss undercutting the prior high ($250). Its 50 DMA line ($237.65) and recent low ($208.62 on 1/27/21) define important near-term support to watch. Its current Relative Strength Rating is 65, below the +80 minimum guideline for buy candidates. Fundamental concerns remain after earnings rose +0% on +23% sales revenues for the Dec '20 quarter versus the year ago period, its 2nd comparison below the +25% minimum earnings guideline (C criteria).
>>> FEATURED STOCK ARTICLE : Quietly Touched a New High Despite Fundamental Concerns Noted - 2/8/2021 |
View all notes |
Set NEW NOTE alert |
Company Profile |
SEC
News |
Chart |
Request a new note
C
A
S
I |
SHOP
-
NYSE
Shopify Inc Cl A
Computer Sftwr-Enterprse
|
$1,381.30
|
-53.71
-3.74% |
$1,414.80
|
1,372,689
103.29% of 50 DAV
50 DAV is 1,329,000
|
$1,499.75
-7.90%
|
2/2/2021
|
$1,218.72
|
PP = $1,285.28
|
|
MB = $1,349.54
|
Most Recent Note - 2/19/2021 5:29:45 PM
G - Posted a big gain on average volume today. Prior high ($1,285 on 12/22/20) defines important support to watch above its 50 DMA line ($1,209). Reported Dec '20 quarterly earnings +267% on +94% sales revenues versus the year ago period.
>>> FEATURED STOCK ARTICLE : Perched Within Striking Distance of New Pivot Point - 2/3/2021 |
View all notes |
Set NEW NOTE alert |
Company Profile |
SEC
News |
Chart |
Request a new note
C
A
S
I |
Symbol/Exchange
Company Name
Industry Group |
PRICE |
CHANGE
(%Change) |
Day High |
Volume
(% DAV)
(% 50 day avg vol) |
52 Wk Hi
% From Hi |
Featured
Date |
Price
Featured |
Pivot Featured |
|
Max Buy |
YETI
-
NYSE
Yeti Holdings Inc
Leisure-Products
|
$71.67
|
-3.32
-4.43% |
$75.88
|
2,102,236
140.52% of 50 DAV
50 DAV is 1,496,000
|
$80.89
-11.40%
|
2/19/2021
|
$74.99
|
PP = $80.99
|
|
MB = $85.04
|
Most Recent Note - 2/22/2021 6:34:56 PM
Y - There was a "negative reversal" today, slumping to a close near its 50 DMA line ($71.55). More damaging losses would raise concerns. New pivot point cited was based on its 1/14/21 high plus 10 cents after a flat base. Subsequent gains above the pivot point backed by at least 40% above average volume may trigger a new (or add-on) technical buy signal. Reported Dec '20 quarterly earnings +72% on +26% sales revenues versus the year ago period. Prior low ($64.80) on 2/01/21) defines important near term support where a violation may trigger a more worrisome technical sell signal.
>>> FEATURED STOCK ARTICLE : Rebounded Just Above 50-Day Moving Average Line - 2/18/2021 |
View all notes |
Set NEW NOTE alert |
Company Profile |
SEC
News |
Chart |
Request a new note
C
A
S
I |
BJ
-
NYSE
BJs Wholesale Club Hldgs
Retail-DiscountandVariety
|
$43.13
|
-1.53
-3.43% |
$44.98
|
1,939,455
86.20% of 50 DAV
50 DAV is 2,249,900
|
$50.18
-14.05%
|
1/28/2021
|
$44.74
|
PP = $47.56
|
|
MB = $49.94
|
Most Recent Note - 2/17/2021 5:30:07 PM
G - Volume totals have been cooling while stubbornly holding its ground. Color code is changed to green as its Relative Strength rating has slumped to 63, well below the 80+ minimum for buy candidates. The prior low and 50 DMA line define important near term support in the $40 area.
>>> FEATURED STOCK ARTICLE : Pulled Back After Breakout Capped 7-Day Winning Streak - 1/28/2021 |
View all notes |
Set NEW NOTE alert |
Company Profile |
SEC
News |
Chart |
Request a new note
C
A
S
I |
DOCU
-
NASDAQ
Docusign Inc
Computer Sftwr-Enterprse
|
$243.51
|
-21.65
-8.16% |
$259.58
|
4,592,406
158.09% of 50 DAV
50 DAV is 2,905,000
|
$290.23
-16.10%
|
1/12/2021
|
$253.50
|
PP = $256.10
|
|
MB = $268.91
|
Most Recent Note - 2/22/2021 6:27:02 PM
Y - Suffered a big volume-driven loss today testing the 50 DMA line ($242.65) again. More damaging losses would raise greater concerns. Faces little resistance due to overhead supply. Fundamentals remain strong.
>>> FEATURED STOCK ARTICLE : Consolidating Back Above 50-Day Moving Average Near Prior High - 2/9/2021 |
View all notes |
Set NEW NOTE alert |
Company Profile |
SEC
News |
Chart |
Request a new note
C
A
S
I |
XPEL
-
NASDAQ
Xpel Inc
Auto/Truck-Tires andamp; Misc
|
$56.59
|
+1.67
3.04% |
$59.99
|
500,013
194.56% of 50 DAV
50 DAV is 257,000
|
$60.77
-6.88%
|
2/22/2021
|
$59.00
|
PP = $60.87
|
|
MB = $63.91
|
Most Recent Note - 2/22/2021 1:24:33 PM
Y - Color code is changed to yellow with pivot point cited based on its 1/14/21 high plus 10 cents. A gain and strong close above its pivot point backed by at least +40% above average volume may trigger a technical buy signal. Keep in mind it is a riskier late-stage base, however, no resistance remains due to overhead supply as its challenging its all-time high after finding prompt support at its 50 DMA line ($52.86) during prior consolidations. This Auto/Truck - Replacement Parts firm reported Sep '20 quarterly earnings +50% on +29% sales revenues versus the year ago period. Three of the past 4 quarterly comparisons were above the +25% minimum earnings guideline (C criteria). Annual earnings history has been strong after a downturn in FY '17.
There are no Featured Stock Updates™ available for this stock at this time. You may request one by clicking the Request a New Note link below |
View all notes |
Set NEW NOTE alert |
Company Profile |
SEC
News |
Chart |
Request a new note
C
A
S
I |
DT
-
NYSE
Dynatrace Inc
Computer Sftwr-Enterprse
|
$50.49
|
-2.39
-4.52% |
$53.20
|
2,567,980
103.63% of 50 DAV
50 DAV is 2,478,000
|
$56.77
-11.06%
|
2/4/2021
|
$51.39
|
PP = $48.95
|
|
MB = $51.40
|
Most Recent Note - 2/22/2021 6:28:43 PM
G - Pulled back further with average volume today. Its relative Strength Rating has slumped to 71, below the 80+ minimum guideline for buy candidates. Prior highs in the $48 area define initial support to watch above its 50 DMA line ($45.31). Fundamentals remain strong after it reported Dec '20 earnings +70% on +28% sales revenues versus the year ago period.
>>> FEATURED STOCK ARTICLE : Breakout Action Returns Dynatrace to Featured Stocks List - 2/4/2021 |
View all notes |
Set NEW NOTE alert |
Company Profile |
SEC
News |
Chart |
Request a new note
C
A
S
I |
Symbol/Exchange
Company Name
Industry Group |
PRICE |
CHANGE
(%Change) |
Day High |
Volume
(% DAV)
(% 50 day avg vol) |
52 Wk Hi
% From Hi |
Featured
Date |
Price
Featured |
Pivot Featured |
|
Max Buy |
MRBK
-
NASDAQ
Meridian Corp
Banks-Northeast
|
$25.00
|
-0.10
-0.40% |
$26.94
|
81,799
327.20% of 50 DAV
50 DAV is 25,000
|
$26.00
-3.85%
|
2/22/2021
|
$25.58
|
PP = $26.10
|
|
MB = $27.41
|
Most Recent Note - 2/22/2021 6:17:58 PM
Y - There was a "negative reversal" and weak close after highlighted in yellow with pivot point cited based on its 12/18/21 high plus 10 cents in the earlier mid-day report. Subsequent gains and a strong close above its pivot point backed by at least +40% above average volume may trigger a technical buy signal. It tallied an impressive spurt of volume-driven gains. The past 3 quarterly comparisons through Dec '20 had earnings increases well above the +25% minimum guideline (C criteria). Annual earnings growth has been good since it Nov '17 IPO at $17. See the latest FSU analysis for more details and a new annotated graph.
>>> FEATURED STOCK ARTICLE : Negative Reversal When Poised to Convincingly Breakout - 2/22/2021 |
View all notes |
Set NEW NOTE alert |
Company Profile |
SEC
News |
Chart |
Request a new note
C
A
S
I |
QTWO
-
NYSE
Q2 Holdings Inc
Computer Sftwr-Financial
|
$135.35
|
-2.15
-1.56% |
$136.84
|
568,018
115.45% of 50 DAV
50 DAV is 492,000
|
$148.56
-8.89%
|
11/12/2020
|
$105.14
|
PP = $106.54
|
|
MB = $111.87
|
Most Recent Note - 2/19/2021 5:28:16 PM
G - Halted its slide today after suffering a big volume-driven loss on the prior session. Weak action came after it reported Dec '20 quarterly earnings -95% on +26% sales revenues versus the year ago period, below the +25% minimum earnings guideline (C criteria), raising fundamental concerns. Volume and volatility often increase near earnings news. Extended from any sound base, its 50 DMA line ($130) defines important near term support to watch above the prior low ($126.52 on 2/01/21). See the latest FSU analysis for more details and a new annotated graph.
>>> FEATURED STOCK ARTICLE : Pullback on Heavy Volume Followed Weak Quarterly Earnings Report - 2/19/2021 |
View all notes |
Set NEW NOTE alert |
Company Profile |
SEC
News |
Chart |
Request a new note
C
A
S
I |
AXON
-
NASDAQ
Axon Enterprise Inc
Security/Sfty
|
$170.00
|
-7.00
-3.95% |
$180.00
|
495,580
71.10% of 50 DAV
50 DAV is 697,000
|
$212.37
-19.95%
|
12/22/2020
|
$127.84
|
PP = $130.51
|
|
MB = $137.04
|
Most Recent Note - 2/22/2021 6:25:17 PM
G - Extended from any sound base, consolidating well above support at its 50 DMA line ($150). Fundamentals remain strong. Formerly traded under the ticker symbol AAXN where prior notes and detailed analysis may be reviewed.
>>> FEATURED STOCK ARTICLE : Extended From Prior Base Following Streak fo Volume-Driven Gains - 2/2/2021 |
View all notes |
Set NEW NOTE alert |
Company Profile |
SEC
News |
Chart |
Request a new note
C
A
S
I |
|
|
|
THESE ARE NOT BUY RECOMMENDATIONS!
Comments contained in the body of this report are technical
opinions only. The material herein has been obtained
from sources believed to be reliable and accurate, however,
its accuracy and completeness cannot be guaranteed.
This site is not an investment advisor, hence it does
not endorse or recommend any securities or other investments.
Any recommendation contained in this report may not
be suitable for all investors and it is not to be deemed
an offer or solicitation on our part with respect to
the purchase or sale of any securities. All trademarks,
service marks and trade names appearing in this report
are the property of their respective owners, and are
likewise used for identification purposes only.
This report is a service available
only to active Paid Premium Members.
You may opt-out of receiving report notifications
at any time. Questions or comments may be submitted
by writing to Premium Membership Services 665 S.E. 10 Street, Suite 201 Deerfield Beach, FL 33441-5634 or by calling 1-800-965-8307
or 954-785-1121.
|
|
|