You are not logged in.
This means you
CAN ONLY VIEW reports that were published prior to Tuesday, April 8, 2025.
You
MUST UPGRADE YOUR MEMBERSHIP if you want to see any current reports.
AFTER MARKET UPDATE - TUESDAY, FEBRUARY 23RD, 2021
Previous After Market Report Next After Market Report >>>
|
|
|
|
DOW |
+15.66 |
31,537.35 |
+0.05% |
|
Volume |
1,263,125,033 |
+9% |
|
Volume |
7,475,984,800 |
+16% |
|
NASDAQ |
-63.72 |
13,469.32 |
-0.47% |
|
Advancers |
1,201 |
38% |
|
Advancers |
1,141 |
30% |
|
S&P 500 |
+4.87 |
3,881.37 |
+0.13% |
|
Decliners |
1,956 |
62% |
|
Decliners |
2,667 |
70% |
|
Russell 2000 |
-19.76 |
2,231.31 |
-0.88% |
|
52 Wk Highs |
205 |
|
|
52 Wk Highs |
224 |
|
|
S&P 600 |
-7.98 |
1,288.53 |
-0.62% |
|
52 Wk Lows |
43 |
|
|
52 Wk Lows |
79 |
|
|
 |
Breadth Negative as Major Indices Rebounded From Early Losses
Kenneth J. Gruneisen - Passed the CAN SLIM® Master's Exam
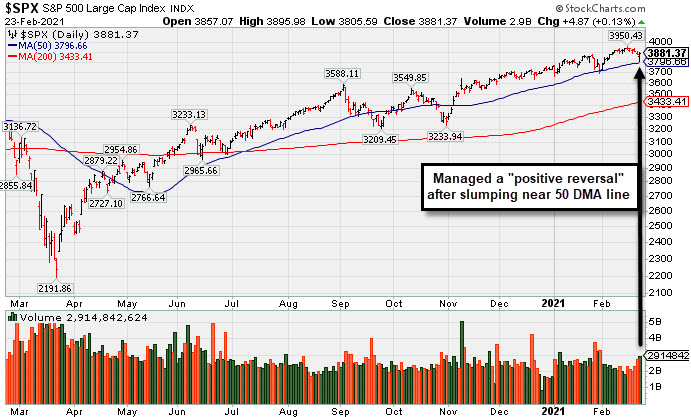
The Dow reversed a 360 point drop to end 15 points higher. The S&P 500 rose 0.1%, snapping a five session losing streak. The Nasdaq Composite slid 0.5% to cap its sixth consecutive daily decline. However, the tech-heavy benchmark rebounded above its 50-day moving average after briefly falling below the closely-watched technical level for the first time since early November. The volume totals were higher than the prior session on the NYSE and on the Nasdaq exchange. Breadth was negative as decliners led advancers by a 3-2 margin on the NYSE and by 5-2 on the Nasdaq exchange. There were 55 high-ranked companies from the Leaders List that hit new 52-week highs and were listed on the BreakOuts Page, versus the total of 88 on the prior session. New 52-week highs totals contracted yet still easily outnumbered new 52-week lows totals on both exchanges. The major indices are in a confirmed uptrend (M criteria) with healthy leadership provided by many stocks hitting new highs. Investors are reminded to always make buying and selling decisions based based on the strict criteria and rules of the fact-based investment system. PICTURED: The S&P 500 Index managed a "positive reversal" after slumping near its 50-day moving average (DMA) line.
U.S stocks fluctuated on Tuesday, paring early session losses as investors digested dovish comments from Federal Reserve Chair Jerome Powell. The U.S. central bank chief reiterated the Fed’s accommodative monetary stance in order to support the U.S. economic recovery that is still “uneven and far from complete.” Powell also noted that inflation remains “soft,” helping ease concerns that a faster-than-anticipated economic rebound could result in price pressures. Treasuries stabilized from the morning’s declines, with the yield on the 10-year note holding steady at 1.36%. On the data front, the Conference Board's closely watched gauge of consumer confidence improved more than expected in February. Separately, an update from S&P CoreLogic Case Shiller showed its measure of national home prices jumped 10.4% year-over-year in December, the largest gain in seven years.
Seven of 11 S&P 500 sectors ended in positive territory. The Energy group paced the gains, as WTI crude rose 0.6% to $62.08/barrel on the NYMEX. Growth-oriented sectors lagged, with Information Technology losing 0.3%. In earnings, with Home Depot (HD -3.12%) gapped down and undercut its 200 DMA line despite a top and bottom line beat and a better-than-expected jump in same-store sales during the fourth quarter. |
 Kenneth J. Gruneisen started out as a licensed stockbroker in August 1987, a couple of months prior to the historic stock market crash that took the Dow Jones Industrial Average down -22.6% in a single day. He has published daily fact-based fundamental and technical analysis on high-ranked stocks online for two decades. Through FACTBASEDINVESTING.COM, Kenneth provides educational articles, news, market commentary, and other information regarding proven investment systems that work in good times and bad.
Comments contained in the body of this report are technical opinions only and are not necessarily those of Gruneisen Growth Corp. The material herein has been obtained from sources believed to be reliable and accurate, however, its accuracy and completeness cannot be guaranteed. Our firm, employees, and customers may effect transactions, including transactions contrary to any recommendation herein, or have positions in the securities mentioned herein or options with respect thereto. Any recommendation contained in this report may not be suitable for all investors and it is not to be deemed an offer or solicitation on our part with respect to the purchase or sale of any securities. |
|
 |
Bank Index and Integrated Oil Index Posted Gains
Kenneth J. Gruneisen - Passed the CAN SLIM® Master's Exam
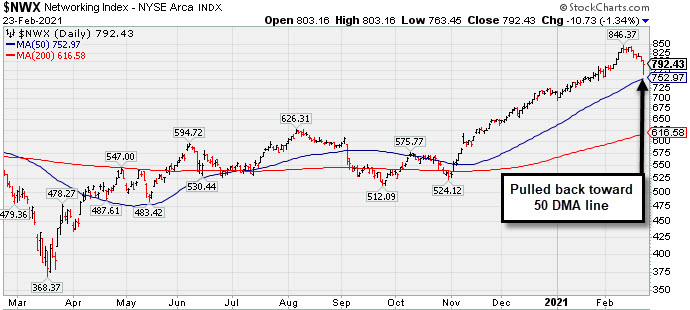
The Bank Index ($BKX +0.89%) was a positive influence but the Broker/Dealer Index ($XBD -0.21%) and Retail Index ($RLX -0.37%) both edged lower. The Semiconductor Index ($SOX -0.56%) and Biotech Index ($BTK -0.53%) edged lower while the Networking Index ($NWX -1.34%) led the tech sector's modest retreat. The Gold & Silver Index ($XAU -1.94%) and Oil Services Index ($OSX -0.95%) both lost ground while the Integrated Oil Index ($XOI +2.35%) posted a solid gain.
PICTURED: The Networking Index ($NWX -1.34%) slumped from a new record high and traded near its 50-day moving average (DMA) line before rebounding from Tuesday's low.
| Oil Services |
$OSX |
53.54 |
-0.51 |
-0.95% |
+20.77% |
| Integrated Oil |
$XOI |
1,002.10 |
+23.00 |
+2.35% |
+26.45% |
| Semiconductor |
$SOX |
3,084.77 |
-17.24 |
-0.56% |
+10.35% |
| Networking |
$NWX |
792.43 |
-10.73 |
-1.34% |
+10.50% |
| Broker/Dealer |
$XBD |
439.47 |
-0.91 |
-0.21% |
+16.38% |
| Retail |
$RLX |
3,592.84 |
-13.33 |
-0.37% |
+0.83% |
| Gold & Silver |
$XAU |
140.90 |
-2.78 |
-1.94% |
-2.28% |
| Bank |
$BKX |
116.55 |
+1.03 |
+0.89% |
+19.04% |
| Biotech |
$BTK |
5,909.03 |
-31.56 |
-0.53% |
+2.96% |
|
|
|
 |
Damaging Loss Indicative of Distributional Pressure
Kenneth J. Gruneisen - Passed the CAN SLIM® Master's Exam
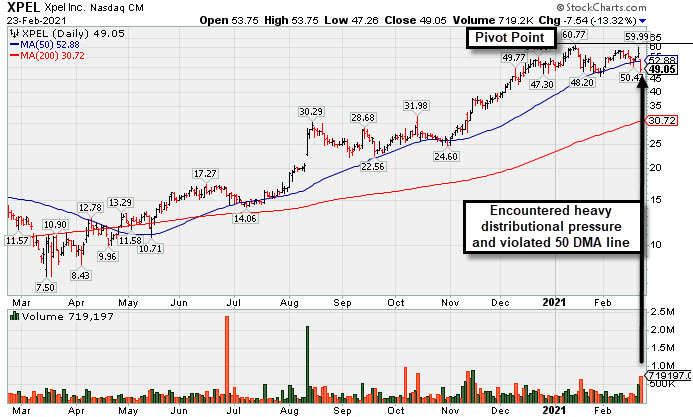
Xpel Inc (XPEL -$7.54 or -13.32% to $49.05) suffered a big loss today with volume +172% above average, action clearly indicative of distributional pressure. It violated its 50-day moving average (DMA) line triggering a technical sell signal. XPEL was highlighted in yellow with pivot point cited based on its 1/14/21 high plus 10 cents in the prior mid-day report (read here) while noted - "A gain and strong close above its pivot point backed by at least +40% above average volume may trigger a technical buy signal. Keep in mind it is a riskier late-stage base, however, no resistance remains due to overhead supply as its challenging its all-time high after finding prompt support at its 50 DMA line ($52.86) during prior consolidations."
This Auto/Truck - Replacement Parts firm reported Sep '20 quarterly earnings +50% on +29% sales revenues versus the year ago period. Three of the past 4 quarterly comparisons were above the +25% minimum earnings guideline (C criteria). Annual earnings history has been strong after a downturn in FY '17.
The number of top-rated funds owning its shares rose from 45 in Mar '20 to 168 in Dec '20, a reassuring sign concerning the I criteria. Its current Up/Down Volume Ratio of 1.4 is an unbiased indication its shares have been under accumulation over the past 50 days. Its small supply of only 27.6 million shares outstanding (S criteria) can contribute to greater volatility in the event of institutional buying or selling. |
|
|
Color Codes Explained :
Y - Better candidates highlighted by our
staff of experts.
G - Previously featured
in past reports as yellow but may no longer be buyable under the
guidelines.
***Last / Change / Volume data in this table is the closing quote data***
Symbol/Exchange
Company Name
Industry Group |
PRICE |
CHANGE
(%Change) |
Day High |
Volume
(% DAV)
(% 50 day avg vol) |
52 Wk Hi
% From Hi |
Featured
Date |
Price
Featured |
Pivot Featured |
|
Max Buy |
 CRL
-
NYSE
CRL
-
NYSE
Charles River Labs Intl
DRUGS - Biotechnology
|
$282.98
|
-0.61
-0.22% |
$284.83
|
376,413
116.18% of 50 DAV
50 DAV is 324,000
|
$303.79
-6.85%
|
12/17/2020
|
$247.06
|
PP = $257.98
|
|
MB = $270.88
|
 Most Recent Note - 2/23/2021 6:24:42 PM
G - Posted a 4th consecutive loss today with near average volume. Slumping since it reported Dec '20 quarterly earnings +19% on +14% sales revenues versus the year ago period, below the +25% minimum earnings guideline (C criteria).
>>> FEATURED STOCK ARTICLE : Testing Important Support on Pullback - 1/29/2021 |
View all notes |
Set NEW NOTE alert |
Company Profile |
SEC
News |
Chart |
Request a new note
C
A
S
I |
AMRC
-
NYSE
Ameresco Inc Cl A
ENERGY - Alternative
|
$60.23
|
-1.89
-3.04% |
$60.38
|
639,645
140.58% of 50 DAV
50 DAV is 455,000
|
$70.26
-14.28%
|
12/15/2020
|
$46.72
|
PP = $47.10
|
|
MB = $49.46
|
Most Recent Note - 2/23/2021 6:23:08 PM
G - Finished near the session high today after gapping down and briefly undercutting its 50-day moving average (DMA) line ($57.13) which has been noted as important near-term support to watch.
>>> FEATURED STOCK ARTICLE : Rebounding After Retreat From Record High - 2/1/2021 |
View all notes |
Set NEW NOTE alert |
Company Profile |
SEC
News |
Chart |
Request a new note
C
A
S
I |
TREX
-
NYSE
Trex Company Inc
MATERIALS and CONSTRUCTION - General Building Materials
|
$91.16
|
-9.03
-9.01% |
$96.74
|
2,246,945
320.99% of 50 DAV
50 DAV is 700,000
|
$107.64
-15.31%
|
6/26/2020
|
$54.53
|
PP = $66.47
|
|
MB = $69.79
|
Most Recent Note - 2/23/2021 6:14:12 PM
Suffered a big volume-driven loss today violating its 50 DMA line ($92) and prior low triggering technical sell signals. Recently reported Dec '20 quarterly earnings +19% on +39% versus the year ago period, its 2nd quarterly comparison below the +25% minimum guideline (C criteria) raising more fundamental concerns. It will be dropped from the Featured Stocks list tonight due to fundamental and technical deterioration.
>>> FEATURED STOCK ARTICLE : Wedged to New Highs With Earnings Report Due Soon - 2/16/2021 |
View all notes |
Set NEW NOTE alert |
Company Profile |
SEC
News |
Chart |
Request a new note
C
A
S
I |
CLFD
-
NASDAQ
Clearfield Inc
TELECOMMUNICATIONS - Cables / Satalite Equipment
|
$33.38
|
-1.47
-4.22% |
$33.90
|
268,403
173.16% of 50 DAV
50 DAV is 155,000
|
$38.75
-13.86%
|
1/20/2021
|
$31.38
|
PP = $28.42
|
|
MB = $29.84
|
Most Recent Note - 2/23/2021 6:15:44 PM
G - Gapped down today for a damaging volume-driven loss raising concerns. It is very extended from any sound base. Its 50 DMA line ($29.71) and prior highs in the $28 area define important near-term support to watch. Reported Dec '20 quarterly earnings +475% on +40% sales revenues versus the year ago period, continuing its strong earning track record.
>>> FEATURED STOCK ARTICLE : Perched Near Record High With Earnings Report Due Soon - 1/27/2021 |
View all notes |
Set NEW NOTE alert |
Company Profile |
SEC
News |
Chart |
Request a new note
C
A
S
I |
NOW
-
NYSE
Servicenow Inc
Computer Sftwr-Enterprse
|
$551.75
|
+1.49
0.27% |
$553.80
|
1,570,249
116.32% of 50 DAV
50 DAV is 1,349,900
|
$598.37
-7.79%
|
8/20/2020
|
$453.34
|
PP = $454.79
|
|
MB = $477.53
|
Most Recent Note - 2/23/2021 6:27:09 PM
G - Managed a "positive reversal" today after slumping well below its 50 DMA line ($549) raising concerns. Relative Strength rating has slumped to 64, well below the 80+ minimum guideline for buy candidates. A new pivot point was not cited due to fundamental concerns noted after it reported Dec '20 quarterly earnings +22% on +31% sales revenues versus the year ago period, its 2nd consecutive comparison below the +25% minimum guideline (C criteria) of the fact-based investment system.
>>> FEATURED STOCK ARTICLE : Hit New Highs With Latest Gains Backed by Light Volume - 2/5/2021 |
View all notes |
Set NEW NOTE alert |
Company Profile |
SEC
News |
Chart |
Request a new note
C
A
S
I |
Symbol/Exchange
Company Name
Industry Group |
PRICE |
CHANGE
(%Change) |
Day High |
Volume
(% DAV)
(% 50 day avg vol) |
52 Wk Hi
% From Hi |
Featured
Date |
Price
Featured |
Pivot Featured |
|
Max Buy |
SMPL
-
NASDAQ
Simply Good Foods Co
Food-Confectionery
|
$28.38
|
+0.04
0.14% |
$28.58
|
613,065
53.97% of 50 DAV
50 DAV is 1,136,000
|
$32.03
-11.40%
|
12/28/2020
|
$30.40
|
PP = $31.44
|
|
MB = $33.01
|
Most Recent Note - 2/19/2021 5:32:39 PM
G - Pulled back today for a 5th consecutive loss and violated its 50 DMA line ($28.35) raising concerns. Its Relative Strength Rating is 59, well below the 80+ minimum guideline. Its prior low ($26.78) defines the next important near term support to watch.
>>> FEATURED STOCK ARTICLE : Pulling Back Quietly After Rebounding Near All-Time High - 2/17/2021 |
View all notes |
Set NEW NOTE alert |
Company Profile |
SEC
News |
Chart |
Request a new note
C
A
S
I |
ALRM
-
NASDAQ
Alarm.com Holdings Inc
Security/Sfty
|
$92.90
|
-1.77
-1.87% |
$94.23
|
424,737
94.39% of 50 DAV
50 DAV is 450,000
|
$108.67
-14.51%
|
2/9/2021
|
$71.88
|
PP = $108.67
|
|
MB = $114.10
|
Most Recent Note - 2/22/2021 6:20:15 PM
G - Color code is changed to green after quietly slumping to a close below its 50 DMA line ($97.21) raising concerns. Due to report Dec '20 quarterly results on 2/25/21.
>>> FEATURED STOCK ARTICLE : Perched Near Prior High After Finding Support at 10 WMA - 2/11/2021 |
View all notes |
Set NEW NOTE alert |
Company Profile |
SEC
News |
Chart |
Request a new note
C
A
S
I |
TEAM
-
NASDAQ
Atlassian Corp Plc
Comp Sftwr-Spec Enterprs
|
$241.46
|
+0.45
0.19% |
$242.36
|
2,617,562
186.54% of 50 DAV
50 DAV is 1,403,200
|
$262.40
-7.98%
|
10/12/2020
|
$193.77
|
PP = $199.60
|
|
MB = $209.58
|
Most Recent Note - 2/23/2021 1:24:48 PM
G - Abruptly retreating from its all-time high with today's 2nd consecutive big loss on higher volume while undercutting 50 DMA line ($237.89). The recent low ($208.62 on 1/27/21) defines the next important near-term support to watch. Its current Relative Strength Rating is 65, below the +80 minimum guideline for buy candidates. Fundamental concerns remain after earnings rose +0% on +23% sales revenues for the Dec '20 quarter versus the year ago period, its 2nd comparison below the +25% minimum earnings guideline (C criteria).
>>> FEATURED STOCK ARTICLE : Quietly Touched a New High Despite Fundamental Concerns Noted - 2/8/2021 |
View all notes |
Set NEW NOTE alert |
Company Profile |
SEC
News |
Chart |
Request a new note
C
A
S
I |
SHOP
-
NYSE
Shopify Inc Cl A
Computer Sftwr-Enterprse
|
$1,300.24
|
-81.06
-5.87% |
$1,322.14
|
3,443,344
257.93% of 50 DAV
50 DAV is 1,335,000
|
$1,499.75
-13.30%
|
2/2/2021
|
$1,218.72
|
PP = $1,285.28
|
|
MB = $1,349.54
|
Most Recent Note - 2/23/2021 1:19:02 PM
G - Gapped down today and undercut the prior high ($1,285 on 12/22/20) raising concerns, yet it found prompt support near its 50 DMA line ($1,219). Reported Dec '20 quarterly earnings +267% on +94% sales revenues versus the year ago period.
>>> FEATURED STOCK ARTICLE : Perched Within Striking Distance of New Pivot Point - 2/3/2021 |
View all notes |
Set NEW NOTE alert |
Company Profile |
SEC
News |
Chart |
Request a new note
C
A
S
I |
YETI
-
NYSE
Yeti Holdings Inc
Leisure-Products
|
$73.41
|
+1.74
2.43% |
$73.54
|
1,590,315
105.67% of 50 DAV
50 DAV is 1,505,000
|
$80.89
-9.25%
|
2/19/2021
|
$74.99
|
PP = $80.99
|
|
MB = $85.04
|
Most Recent Note - 2/22/2021 6:34:56 PM
Y - There was a "negative reversal" today, slumping to a close near its 50 DMA line ($71.55). More damaging losses would raise concerns. New pivot point cited was based on its 1/14/21 high plus 10 cents after a flat base. Subsequent gains above the pivot point backed by at least 40% above average volume may trigger a new (or add-on) technical buy signal. Reported Dec '20 quarterly earnings +72% on +26% sales revenues versus the year ago period. Prior low ($64.80) on 2/01/21) defines important near term support where a violation may trigger a more worrisome technical sell signal.
>>> FEATURED STOCK ARTICLE : Rebounded Just Above 50-Day Moving Average Line - 2/18/2021 |
View all notes |
Set NEW NOTE alert |
Company Profile |
SEC
News |
Chart |
Request a new note
C
A
S
I |
Symbol/Exchange
Company Name
Industry Group |
PRICE |
CHANGE
(%Change) |
Day High |
Volume
(% DAV)
(% 50 day avg vol) |
52 Wk Hi
% From Hi |
Featured
Date |
Price
Featured |
Pivot Featured |
|
Max Buy |
BJ
-
NYSE
BJs Wholesale Club Hldgs
Retail-DiscountandVariety
|
$41.84
|
-1.29
-2.99% |
$42.67
|
2,030,155
90.02% of 50 DAV
50 DAV is 2,255,200
|
$50.18
-16.62%
|
1/28/2021
|
$44.74
|
PP = $47.56
|
|
MB = $49.94
|
Most Recent Note - 2/23/2021 6:17:56 PM
Suffered a 3rd consecutive loss with near average volume. Its Relative Strength rating has slumped to 54, well below the 80+ minimum for buy candidates. The prior low and 50 DMA line define important near term support in the $40 area. It will be dropped from the Featured Stocks list tonight.
>>> FEATURED STOCK ARTICLE : Pulled Back After Breakout Capped 7-Day Winning Streak - 1/28/2021 |
View all notes |
Set NEW NOTE alert |
Company Profile |
SEC
News |
Chart |
Request a new note
C
A
S
I |
DOCU
-
NASDAQ
Docusign Inc
Computer Sftwr-Enterprse
|
$243.60
|
+0.09
0.04% |
$245.20
|
4,455,028
153.36% of 50 DAV
50 DAV is 2,905,000
|
$290.23
-16.07%
|
1/12/2021
|
$253.50
|
PP = $256.10
|
|
MB = $268.91
|
Most Recent Note - 2/22/2021 6:27:02 PM
Y - Suffered a big volume-driven loss today testing the 50 DMA line ($242.65) again. More damaging losses would raise greater concerns. Faces little resistance due to overhead supply. Fundamentals remain strong.
>>> FEATURED STOCK ARTICLE : Consolidating Back Above 50-Day Moving Average Near Prior High - 2/9/2021 |
View all notes |
Set NEW NOTE alert |
Company Profile |
SEC
News |
Chart |
Request a new note
C
A
S
I |
XPEL
-
NASDAQ
Xpel Inc
Auto/Truck-Tires andamp; Misc
|
$49.05
|
-7.54
-13.32% |
$53.75
|
719,195
273.46% of 50 DAV
50 DAV is 263,000
|
$60.77
-19.29%
|
2/22/2021
|
$59.00
|
PP = $60.87
|
|
MB = $63.91
|
Most Recent Note - 2/23/2021 6:11:02 PM
G - Color code is changed to green after it suffered a damaging volume-driven loss today violating its 50 DMA line and triggering a technical sell signal. Pivot point cited was based on its 1/14/21 high plus 10 cents when noted in the prior mid-day report - "A gain and strong close above its pivot point backed by at least +40% above average volume may trigger a technical buy signal. Keep in mind it is a riskier late-stage base, however, no resistance remains due to overhead supply as its challenging its all-time high after finding prompt support at its 50 DMA line ($52.86) during prior consolidations. This Auto/Truck - Replacement Parts firm reported Sep '20 quarterly earnings +50% on +29% sales revenues versus the year ago period. Three of the past 4 quarterly comparisons were above the +25% minimum earnings guideline (C criteria). Annual earnings history has been strong after a downturn in FY '17." See the latest FSU analysis for more details and and a new annotated graph.
>>> FEATURED STOCK ARTICLE : Damaging Loss Indicative of Distributional Pressure - 2/23/2021 |
View all notes |
Set NEW NOTE alert |
Company Profile |
SEC
News |
Chart |
Request a new note
C
A
S
I |
DT
-
NYSE
Dynatrace Inc
Computer Sftwr-Enterprse
|
$50.63
|
+0.14
0.28% |
$51.16
|
2,738,990
109.60% of 50 DAV
50 DAV is 2,499,000
|
$56.77
-10.82%
|
2/4/2021
|
$51.39
|
PP = $48.95
|
|
MB = $51.40
|
Most Recent Note - 2/22/2021 6:28:43 PM
G - Pulled back further with average volume today. Its relative Strength Rating has slumped to 71, below the 80+ minimum guideline for buy candidates. Prior highs in the $48 area define initial support to watch above its 50 DMA line ($45.31). Fundamentals remain strong after it reported Dec '20 earnings +70% on +28% sales revenues versus the year ago period.
>>> FEATURED STOCK ARTICLE : Breakout Action Returns Dynatrace to Featured Stocks List - 2/4/2021 |
View all notes |
Set NEW NOTE alert |
Company Profile |
SEC
News |
Chart |
Request a new note
C
A
S
I |
MRBK
-
NASDAQ
Meridian Corp
Banks-Northeast
|
$25.20
|
+0.20
0.80% |
$25.87
|
57,434
220.90% of 50 DAV
50 DAV is 26,000
|
$26.94
-6.46%
|
2/22/2021
|
$25.58
|
PP = $26.10
|
|
MB = $27.41
|
Most Recent Note - 2/22/2021 6:17:58 PM
Y - There was a "negative reversal" and weak close after highlighted in yellow with pivot point cited based on its 12/18/21 high plus 10 cents in the earlier mid-day report. Subsequent gains and a strong close above its pivot point backed by at least +40% above average volume may trigger a technical buy signal. It tallied an impressive spurt of volume-driven gains. The past 3 quarterly comparisons through Dec '20 had earnings increases well above the +25% minimum guideline (C criteria). Annual earnings growth has been good since it Nov '17 IPO at $17. See the latest FSU analysis for more details and a new annotated graph.
>>> FEATURED STOCK ARTICLE : Negative Reversal When Poised to Convincingly Breakout - 2/22/2021 |
View all notes |
Set NEW NOTE alert |
Company Profile |
SEC
News |
Chart |
Request a new note
C
A
S
I |
Symbol/Exchange
Company Name
Industry Group |
PRICE |
CHANGE
(%Change) |
Day High |
Volume
(% DAV)
(% 50 day avg vol) |
52 Wk Hi
% From Hi |
Featured
Date |
Price
Featured |
Pivot Featured |
|
Max Buy |
QTWO
-
NYSE
Q2 Holdings Inc
Computer Sftwr-Financial
|
$129.90
|
-5.45
-4.03% |
$132.03
|
640,779
130.21% of 50 DAV
50 DAV is 492,100
|
$148.56
-12.56%
|
11/12/2020
|
$105.14
|
PP = $106.54
|
|
MB = $111.87
|
Most Recent Note - 2/23/2021 6:21:02 PM
Violated its 50 DMA line today while gapping down and suffering a big volume-driven loss, triggering a technical sell signal. Weak action came after it reported Dec '20 quarterly earnings -95% on +26% sales revenues versus the year ago period, below the +25% minimum earnings guideline (C criteria), raising fundamental concerns. Volume and volatility often increase near earnings news. The prior low ($126.52 on 2/01/21) defines important near term support. It will be dropped from the Featured Stocks list tonight.
>>> FEATURED STOCK ARTICLE : Pullback on Heavy Volume Followed Weak Quarterly Earnings Report - 2/19/2021 |
View all notes |
Set NEW NOTE alert |
Company Profile |
SEC
News |
Chart |
Request a new note
C
A
S
I |
AXON
-
NASDAQ
Axon Enterprise Inc
Security/Sfty
|
$169.14
|
-0.86
-0.51% |
$170.68
|
659,401
94.47% of 50 DAV
50 DAV is 698,000
|
$212.37
-20.36%
|
12/22/2020
|
$127.84
|
PP = $130.51
|
|
MB = $137.04
|
Most Recent Note - 2/22/2021 6:25:17 PM
G - Extended from any sound base, consolidating well above support at its 50 DMA line ($150). Fundamentals remain strong. Formerly traded under the ticker symbol AAXN where prior notes and detailed analysis may be reviewed.
>>> FEATURED STOCK ARTICLE : Extended From Prior Base Following Streak fo Volume-Driven Gains - 2/2/2021 |
View all notes |
Set NEW NOTE alert |
Company Profile |
SEC
News |
Chart |
Request a new note
C
A
S
I |
|
|
|
THESE ARE NOT BUY RECOMMENDATIONS!
Comments contained in the body of this report are technical
opinions only. The material herein has been obtained
from sources believed to be reliable and accurate, however,
its accuracy and completeness cannot be guaranteed.
This site is not an investment advisor, hence it does
not endorse or recommend any securities or other investments.
Any recommendation contained in this report may not
be suitable for all investors and it is not to be deemed
an offer or solicitation on our part with respect to
the purchase or sale of any securities. All trademarks,
service marks and trade names appearing in this report
are the property of their respective owners, and are
likewise used for identification purposes only.
This report is a service available
only to active Paid Premium Members.
You may opt-out of receiving report notifications
at any time. Questions or comments may be submitted
by writing to Premium Membership Services 665 S.E. 10 Street, Suite 201 Deerfield Beach, FL 33441-5634 or by calling 1-800-965-8307
or 954-785-1121.
|
|
|