***Last / Change / Volume data in this table is the closing quote data***
Symbol/Exchange
Company Name
Industry Group |
PRICE |
CHANGE
(%Change) |
Day High |
Volume
(% DAV)
(% 50 day avg vol) |
52 Wk Hi
% From Hi |
Featured
Date |
Price
Featured |
Pivot Featured |
|
Max Buy |
 SIVB
-
NASDAQ
SIVB
-
NASDAQ
S V B Financial Group
BANKING - Regional - Pacific Banks
|
$649.96
|
+7.81
1.22% |
$653.54
|
538,359
138.75% of 50 DAV
50 DAV is 388,000
|
$643.17
1.06%
|
8/6/2021
|
$589.70
|
PP = $608.94
|
|
MB = $639.39
|
Most Recent Note - 9/23/2021 5:21:34 PM
G - Color code is changed to green after rallying above its "max buy" level for a new all-time high. Its 50 DMA line ($574.52) defies important near-term support to watch. Completed a new Public Offering on 8/11/21.
>>> FEATURED STOCK ARTICLE : Consolidating Near Prior Highs Facing Little Resistance - 8/9/2021 |
View all notes |
Set NEW NOTE alert |
Company Profile |
SEC
News |
Chart |
Request a new note
C
A
S
I |
BLDR
-
NYSE
Builders Firstsource Inc
Bldg-Constr Prds/Misc
|
$54.16
|
-0.10
-0.18% |
$54.55
|
1,310,835
59.13% of 50 DAV
50 DAV is 2,217,000
|
$55.17
-1.83%
|
8/12/2021
|
$52.38
|
PP = $54.09
|
|
MB = $56.79
|
Most Recent Note - 9/21/2021 6:02:15 PM
Y - Posted a small gain today with light volume, still hovering near its all-time high. Subsequent gains above the pivot point backed by at least +40% above average volume may clinch a proper technical buy signal. Fundamentals remain strong.
>>> FEATURED STOCK ARTICLE : Rebounding Near Prior High After Another Strong Quarter - 8/12/2021 |
View all notes |
Set NEW NOTE alert |
Company Profile |
SEC
News |
Chart |
Request a new note
C
A
S
I |
SNPS
-
NASDAQ
Synopsys Inc
COMPUTER SOFTWARE and SERVICES - Technical and System Software
|
$321.94
|
-0.94
-0.29% |
$322.59
|
369,509
54.16% of 50 DAV
50 DAV is 682,200
|
$340.66
-5.50%
|
8/18/2021
|
$293.22
|
PP = $301.01
|
|
MB = $316.06
|
 Most Recent Note - 9/24/2021 5:11:44 PM
G - Volume totals are cooling since halting its slide. Extended from the previously noted base. Its 50 DMA line ($308.44) defines important support above the prior high in the $300 area define important near-term support.
>>> FEATURED STOCK ARTICLE : Latest Earnings Report Missed the +25% Minimum Guideline - 8/18/2021 |
View all notes |
Set NEW NOTE alert |
Company Profile |
SEC
News |
Chart |
Request a new note
C
A
S
I |
CROX
-
NASDAQ
Crocs Inc
CONSUMER NON-DURABLES - Textile - Apparel Footwear
|
$156.30
|
-6.70
-4.11% |
$160.99
|
1,776,628
126.54% of 50 DAV
50 DAV is 1,404,000
|
$163.18
-4.22%
|
6/14/2021
|
$112.64
|
PP = $110.01
|
|
MB = $115.51
|
Most Recent Note - 9/24/2021 12:13:17 PM
G - Perched near its all-time high today after 3 consecutive gains backed by lighter volume. It did not form any recent base of sufficient length. Important near-term support to watch is its 50 DMA line ($140.64) and prior low ($132.60).
>>> FEATURED STOCK ARTICLE : Wedging Higher and Very Extended From Any Sound Base - 8/16/2021 |
View all notes |
Set NEW NOTE alert |
Company Profile |
SEC
News |
Chart |
Request a new note
C
A
S
I |
DECK
-
NYSE
Deckers Outdoor Corp
Apparel-Clothing Mfg
|
$388.75
|
-38.25
-8.96% |
$417.32
|
1,063,166
323.15% of 50 DAV
50 DAV is 329,000
|
$451.49
-13.90%
|
9/16/2021
|
$444.81
|
PP = $444.58
|
|
MB = $466.81
|
Most Recent Note - 9/24/2021 12:13:34 PM
G - Color code was changed to green after gapping down today and violating its 50 DMA line ($418.75) triggering a technical sell signal with a big volume-driven loss. It failed to produce the gain above the pivot point backed by at least +40% above average volume necessary to trigger a technical buy signal.
>>> FEATURED STOCK ARTICLE : Touched New High But Closed Below Pivot Point - 9/16/2021 |
View all notes |
Set NEW NOTE alert |
Company Profile |
SEC
News |
Chart |
Request a new note
C
A
S
I |
Symbol/Exchange
Company Name
Industry Group |
PRICE |
CHANGE
(%Change) |
Day High |
Volume
(% DAV)
(% 50 day avg vol) |
52 Wk Hi
% From Hi |
Featured
Date |
Price
Featured |
Pivot Featured |
|
Max Buy |
KFRC
-
NASDAQ
Kforce Inc
Comml Svcs-Staffing
|
$62.23
|
+0.34
0.55% |
$63.07
|
109,167
95.76% of 50 DAV
50 DAV is 114,000
|
$64.38
-3.34%
|
9/10/2021
|
$59.53
|
PP = $64.48
|
|
MB = $67.70
|
Most Recent Note - 9/23/2021 12:11:21 PM
Y - Rebounding above its 50 DMA line with today's gain and its color code is changed to yellow. Highlighted in yellow with pivot point cited based on its 6/02/21 high plus 10 cents in the 9/10/21 mid-day report. Subsequent gains above its pivot point backed by at least +40% above average volume are needed to trigger a technical buy signal. Reported earnings +113% on +18% sales revenues for the Jun '21 quarter versus the year ago period, its 4th quarterly earnings increase above the +25% minimum earnings guideline (C criteria). Annual earnings (A criteria) growth has been steady.
>>> FEATURED STOCK ARTICLE : Staffing Firm Still Faces Some Overhead Supply - 9/13/2021 |
View all notes |
Set NEW NOTE alert |
Company Profile |
SEC
News |
Chart |
Request a new note
C
A
S
I |
CRL
-
NYSE
Charles River Labs Intl
DRUGS - Biotechnology
|
$458.30
|
+3.26
0.72% |
$460.21
|
287,957
92.59% of 50 DAV
50 DAV is 311,000
|
$458.27
0.01%
|
6/9/2021
|
$345.91
|
PP = $349.23
|
|
MB = $366.69
|
Most Recent Note - 9/21/2021 6:06:59 PM
G - Posted a gain today while still churning higher volume in recent weeks and remaining perched near its all-time high, extended from any sound base. Its 50 DMA line ($417.57) defines near-term support to watch on pullbacks. Fundamentals remain strong.
>>> FEATURED STOCK ARTICLE : Wedging Higher With Gains Lacking Volume Conviction - 8/24/2021 |
View all notes |
Set NEW NOTE alert |
Company Profile |
SEC
News |
Chart |
Request a new note
C
A
S
I |
REGN
-
NASDAQ
Regeneron Pharmaceutical
DRUGS - Biotechnology
|
$638.90
|
-7.61
-1.18% |
$644.31
|
651,954
88.46% of 50 DAV
50 DAV is 737,000
|
$686.62
-6.95%
|
8/20/2021
|
$669.82
|
PP = $664.74
|
|
MB = $697.98
|
Most Recent Note - 9/24/2021 11:14:46 AM
Y - Slumping toward its 50 DMA line ($630) which defines important near-term support. Subsequent gains above a stock's pivot point must be backed by at least +40% above average volume to trigger a proper technical buy signal.
>>> FEATURED STOCK ARTICLE : Regeneron Featured Hitting a New High - 8/20/2021 |
View all notes |
Set NEW NOTE alert |
Company Profile |
SEC
News |
Chart |
Request a new note
C
A
S
I |
GNRC
-
NYSE
Generac Hldgs Inc
Electrical-Power/Equipmt
|
$444.61
|
-9.41
-2.07% |
$456.96
|
533,840
76.37% of 50 DAV
50 DAV is 699,000
|
$466.92
-4.78%
|
8/30/2021
|
$449.36
|
PP = $457.10
|
|
MB = $479.96
|
Most Recent Note - 9/22/2021 5:21:09 PM
Y - Color code is changed to yellow after rebounding above its 50 DMA line ($427.68) with today's gain. Subsequent gains and a strong close above the pivot point backed by at least +40% above average volume may clinch a convincing new (or add-on) technical buy signal. Fundamentals remain strong.
>>> FEATURED STOCK ARTICLE : Rebound Above 50-Day Moving Average Helps Outlook - 8/23/2021 |
View all notes |
Set NEW NOTE alert |
Company Profile |
SEC
News |
Chart |
Request a new note
C
A
S
I |
CAMT
-
NASDAQ
Camtek Ltd
ELECTRONICS - Scientific and Technical Instrum
|
$44.21
|
-0.90
-2.00% |
$45.04
|
179,159
105.39% of 50 DAV
50 DAV is 170,000
|
$46.01
-3.91%
|
8/4/2021
|
$39.67
|
PP = $40.57
|
|
MB = $42.60
|
Most Recent Note - 9/23/2021 5:19:34 PM
G - Gapped up today for a big volume-driven gain and its color code is changed to green after hitting a new high above its "max buy" level. Its 50 DMA line ($38.67) and prior low ($34.68 on 8/17/21) define important near-term support to watch. Fundamentals remain strong.
>>> FEATURED STOCK ARTICLE : Recent 50-Day Moving Average Violation Again Raised Concerns - 8/17/2021 |
View all notes |
Set NEW NOTE alert |
Company Profile |
SEC
News |
Chart |
Request a new note
C
A
S
I |
Symbol/Exchange
Company Name
Industry Group |
PRICE |
CHANGE
(%Change) |
Day High |
Volume
(% DAV)
(% 50 day avg vol) |
52 Wk Hi
% From Hi |
Featured
Date |
Price
Featured |
Pivot Featured |
|
Max Buy |
PKI
-
NYSE
Perkinelmer Inc
ELECTRONICS - Scientific and Technical Instrum
|
$182.88
|
-3.20
-1.72% |
$185.68
|
528,665
71.34% of 50 DAV
50 DAV is 741,000
|
$192.00
-4.75%
|
8/18/2021
|
$181.07
|
PP = $188.50
|
|
MB = $197.93
|
Most Recent Note - 9/23/2021 12:22:53 PM
Y - Posting a 3rd consecutive gain and today it touched a new all-time high. Following a noted "3-weeks tight" base its color code was changed to yellow with new pivot point cited based on its 8/05/21 high plus 10 cents. Its 50 DMA line ($180) defines important near-term support to watch. Fundamentals remain strong.
>>> FEATURED STOCK ARTICLE : Stalled But Holding Ground After Recent "3 Weeks Tight" - 9/17/2021 |
View all notes |
Set NEW NOTE alert |
Company Profile |
SEC
News |
Chart |
Request a new note
C
A
S
I |
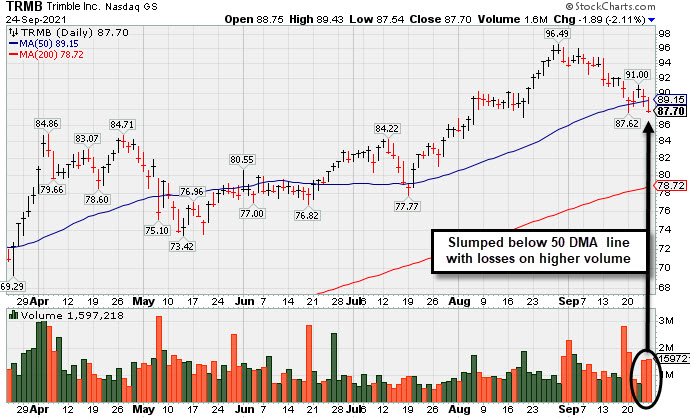
TRMB
-
NASDAQ
Trimble Inc
ELECTRONICS - Scientific and Technical Instrum
|
$87.70
|
-1.89
-2.11% |
$89.43
|
1,597,218
147.34% of 50 DAV
50 DAV is 1,084,000
|
$96.49
-9.11%
|
8/5/2021
|
$88.83
|
PP = $84.97
|
|
MB = $89.22
|
Most Recent Note - 9/24/2021 5:16:55 PM
G - Violated its 50 DMA line ($89.15) with volume-driven losses raising concerns and triggering a technical sell signal. Only a prompt rebound above the 50 DMA line would help its outlook improve. The next near-term support is prior highs in the $84 area. Fundamentals remain strong. See the latest FSU analysis for more details and a new annotated graph.
>>> FEATURED STOCK ARTICLE : Violation of 50-Day Moving Average Has Raised Concerns - 9/24/2021 |
View all notes |
Set NEW NOTE alert |
Company Profile |
SEC
News |
Chart |
Request a new note
C
A
S
I |
UMC
-
NYSE
United Microelectrnc Adr
ELECTRONICS - Semiconductor - Integrated Cir
|
$11.99
|
+0.12
1.01% |
$12.11
|
4,034,895
52.72% of 50 DAV
50 DAV is 7,654,000
|
$12.62
-4.99%
|
8/5/2021
|
$11.62
|
PP = $11.38
|
|
MB = $11.95
|
Most Recent Note - 9/21/2021 6:11:13 PM
Y - Color code is changed to yellow while quietly consolidating below its "max buy" level. Prior highs in the $11.25 area define initial support to watch above its 50 DMA line ($10.78).
>>> FEATURED STOCK ARTICLE : Taiwan-Based Semiconductor Firm's Breakout Highlighted This Week - 8/6/2021 |
View all notes |
Set NEW NOTE alert |
Company Profile |
SEC
News |
Chart |
Request a new note
C
A
S
I |
ASML
-
NASDAQ
A S M L Holding N.V. NY
ELECTRONICS - Semiconductor Equipment and Mate
|
$868.82
|
-10.96
-1.25% |
$873.36
|
507,023
72.23% of 50 DAV
50 DAV is 702,000
|
$895.93
-3.03%
|
5/25/2021
|
$669.59
|
PP = $675.75
|
|
MB = $709.54
|
Most Recent Note - 9/21/2021 12:19:03 PM
G - Pulled back with 3 consecutive volume-driven losses, retreating from its all-time high. It is extended from any sound base and its 50 DMA line ($795) defines important near-term support to watch.
>>> FEATURED STOCK ARTICLE : Semi Equipment Firm Extended From Any Sound Base - 8/11/2021 |
View all notes |
Set NEW NOTE alert |
Company Profile |
SEC
News |
Chart |
Request a new note
C
A
S
I |
BRKS
-
NASDAQ
Brooks Automation
ELECTRONICS - Semiconductor Equipment and Mate
|
$108.74
|
+0.58
0.54% |
$109.64
|
808,860
131.52% of 50 DAV
50 DAV is 615,000
|
$108.72
0.02%
|
9/20/2021
|
$101.21
|
PP = $108.82
|
|
MB = $114.26
|
Most Recent Note - 9/23/2021 5:23:03 PM
Y - Challenged to 52-week high with today's 6th consecutive gain. Pivot point cited was based on its 4/27/21 high plus 10 cents. Subsequent gains above the pivot point backed by at least 40% above average volume may trigger a technical buy signal.
>>> FEATURED STOCK ARTICLE : Rallying Near High After Brief Consolidation Below 200 DMA Line - 9/20/2021 |
View all notes |
Set NEW NOTE alert |
Company Profile |
SEC
News |
Chart |
Request a new note
C
A
S
I |
Symbol/Exchange
Company Name
Industry Group |
PRICE |
CHANGE
(%Change) |
Day High |
Volume
(% DAV)
(% 50 day avg vol) |
52 Wk Hi
% From Hi |
Featured
Date |
Price
Featured |
Pivot Featured |
|
Max Buy |
ENTG
-
NASDAQ
Entegris Inc
ELECTRONICS - Semiconductor Equipment and Mate
|
$132.46
|
-2.37
-1.76% |
$133.61
|
609,656
94.81% of 50 DAV
50 DAV is 643,000
|
$135.99
-2.60%
|
8/4/2021
|
$125.33
|
PP = $126.51
|
|
MB = $132.84
|
Most Recent Note - 9/23/2021 5:10:34 PM
G - Hit another new high and rose further above its "max buy" level with today's volume-driven gain. The 50 DMA line ($120) defines initial support to watch above recent lows in the $109 area. See the latest FSU analysis for more details and a new annotated graph.
>>> FEATURED STOCK ARTICLE : Hit New High and Rose Above its Max Buy Level - 9/23/2021 |
View all notes |
Set NEW NOTE alert |
Company Profile |
SEC
News |
Chart |
Request a new note
C
A
S
I |
AMRC
-
NYSE
Ameresco Inc Cl A
ENERGY - Alternative
|
$62.49
|
-0.51
-0.81% |
$63.42
|
233,788
85.32% of 50 DAV
50 DAV is 274,000
|
$75.88
-17.65%
|
9/2/2021
|
$70.97
|
PP = $70.33
|
|
MB = $73.85
|
Most Recent Note - 9/20/2021 5:32:24 PM
G - Color code is changed to green after today's volume-driven loss decisively violated its 50 DMA line ($66.80) raising concerns.
>>> FEATURED STOCK ARTICLE : Volume +55% Above Average Behind Gain for a New High - 9/2/2021 |
View all notes |
Set NEW NOTE alert |
Company Profile |
SEC
News |
Chart |
Request a new note
C
A
S
I |
CPRT
-
NASDAQ
Copart Inc
SPECIALTY RETAIL - Auto Dealerships
|
$147.81
|
+1.96
1.34% |
$148.05
|
723,513
75.60% of 50 DAV
50 DAV is 957,000
|
$152.75
-3.23%
|
9/15/2021
|
$146.44
|
PP = $149.17
|
|
MB = $156.63
|
Most Recent Note - 9/24/2021 5:13:30 PM
Y - Found prompt support this week after briefly undercutting its 50 DMA line ($144). Reported earnings +51% on +42% sales revenues for the Jul '21 quarter versus the year ago period, its 3rd consecutive quarterly comparison above the +25% minimum guideline. Sequential comparisons show impressive acceleration in its sales revenues growth rate.
>>> FEATURED STOCK ARTICLE : Volume-Driven Gain Challenging High - 9/15/2021 |
View all notes |
Set NEW NOTE alert |
Company Profile |
SEC
News |
Chart |
Request a new note
C
A
S
I |
CLFD
-
NASDAQ
Clearfield Inc
TELECOMMUNICATIONS - Cables / Satalite Equipment
|
$45.78
|
+0.19
0.42% |
$46.28
|
53,089
56.48% of 50 DAV
50 DAV is 94,000
|
$46.93
-2.45%
|
7/23/2021
|
$40.23
|
PP = $43.74
|
|
MB = $45.93
|
Most Recent Note - 9/21/2021 6:04:55 PM
Y - Still consolidating below its "max buy" level and staying above its 50 DMA line ($42.27) which defines important near-term support to watch on pullbacks. Fundamentals remain strong.
>>> FEATURED STOCK ARTICLE : Quietly Consolidating Near All-Time High - 9/14/2021 |
View all notes |
Set NEW NOTE alert |
Company Profile |
SEC
News |
Chart |
Request a new note
C
A
S
I |
POOL
-
NASDAQ
Pool Corp
WHOLESALE - Basic Materials Wholesale
|
$465.49
|
-0.88
-0.19% |
$466.70
|
153,924
69.34% of 50 DAV
50 DAV is 222,000
|
$500.85
-7.06%
|
8/19/2021
|
$484.37
|
PP = $495.32
|
|
MB = $520.09
|
Most Recent Note - 9/20/2021 5:37:00 PM
G - Color code is changed to green after slumping well below its 50 DMA line ($478) with recent damaging losses raising concerns. After forming an advanced "3-weeks tight" base, it did not yet produce the subsequent gains above the pivot point backed by at least +40% above average volume needed to clinch a proper new (or add-on) technical buy signal.
>>> FEATURED STOCK ARTICLE : Touched New High With a Gain on Light Volume - 9/8/2021 |
View all notes |
Set NEW NOTE alert |
Company Profile |
SEC
News |
Chart |
Request a new note
C
A
S
I |
Symbol/Exchange
Company Name
Industry Group |
PRICE |
CHANGE
(%Change) |
Day High |
Volume
(% DAV)
(% 50 day avg vol) |
52 Wk Hi
% From Hi |
Featured
Date |
Price
Featured |
Pivot Featured |
|
Max Buy |
SMPL
-
NASDAQ
Simply Good Foods Co
Food-Confectionery
|
$35.01
|
-0.72
-2.02% |
$35.73
|
299,533
87.48% of 50 DAV
50 DAV is 342,400
|
$38.50
-9.06%
|
12/28/2020
|
$30.40
|
PP = $31.44
|
|
MB = $33.01
|
Most Recent Note - 9/24/2021 11:16:37 AM
G - Sputtering near its 50 DMA line ($35.81). Recent low ($33.55 on 9/20/21) defines important support where more damaging losses would raise greater concerns. Fundamentals remain strong.
>>> FEATURED STOCK ARTICLE : Still Lingering Below 50-Day Moving Average Line - 8/30/2021 |
View all notes |
Set NEW NOTE alert |
Company Profile |
SEC
News |
Chart |
Request a new note
C
A
S
I |
WDAY
-
NYSE
Workday Inc Cl A
Computer Sftwr-Enterprse
|
$268.43
|
-1.64
-0.61% |
$270.22
|
1,055,892
63.50% of 50 DAV
50 DAV is 1,662,900
|
$282.77
-5.07%
|
9/7/2021
|
$275.69
|
PP = $282.87
|
|
MB = $297.01
|
Most Recent Note - 9/21/2021 6:13:28 PM
Y - Trading higher volume recently while still consolidating in a tight range within striking distance of its 52-week high. Subsequent gains above the pivot point backed by at least +40% above average volume may trigger a technical buy signal. Fundamentals remain strong.
>>> FEATURED STOCK ARTICLE : Gap Up and Recent Gains Challenge All-Time High - 9/7/2021 |
View all notes |
Set NEW NOTE alert |
Company Profile |
SEC
News |
Chart |
Request a new note
C
A
S
I |
CTLT
-
NYSE
Catalent Inc
DRUGS - Biotechnology
|
$141.34
|
+0.32
0.23% |
$141.71
|
613,792
71.70% of 50 DAV
50 DAV is 856,000
|
$142.64
-0.91%
|
8/25/2021
|
$128.72
|
PP = $127.78
|
|
MB = $134.17
|
Most Recent Note - 9/23/2021 5:13:53 PM
G - Challenged its all-time high with today's gain on light volume. It is extended from the previously noted base. Prior highs in the $124-127 area define initial support to watch along with its 50 DMA line ($126). Fundamentals remain strong.
>>> FEATURED STOCK ARTICLE : Strong Gain Triggered Technical Buy Signal - 8/25/2021 |
View all notes |
Set NEW NOTE alert |
Company Profile |
SEC
News |
Chart |
Request a new note
C
A
S
I |
SQ
-
NYSE
Square Inc Cl A
Finance-CrdtCard/PmtPr
|
$262.50
|
-4.22
-1.58% |
$264.97
|
6,831,611
89.41% of 50 DAV
50 DAV is 7,641,000
|
$289.23
-9.24%
|
8/2/2021
|
$273.78
|
PP = $283.29
|
|
MB = $297.45
|
Most Recent Note - 9/22/2021 5:09:55 PM
Y - Rebounded above its 50 DMA line ($259.93) with today's gain helping its outlook improve and its color code is changed to yellow. Halted its slide at its 200 DMA line after damaging volume-driven losses triggered a technical sell signal. See the latest FSU analysis for more details and a new annotated graph.
>>> FEATURED STOCK ARTICLE : Found Support at 200-Day and Climbed Above 50-Day Moving Average - 9/22/2021 |
View all notes |
Set NEW NOTE alert |
Company Profile |
SEC
News |
Chart |
Request a new note
C
A
S
I |
BLD
-
NYSE
Topbuild Corp
Bldg-Constr Prds/Misc
|
$219.24
|
-0.57
-0.26% |
$221.89
|
164,874
62.64% of 50 DAV
50 DAV is 263,200
|
$235.50
-6.90%
|
9/9/2021
|
$227.02
|
PP = $229.89
|
|
MB = $241.38
|
Most Recent Note - 9/20/2021 5:38:35 PM
Y - Pulled back today with light volume. Still perched within striking distance of its 52-week high. Highlighted in yellow in the 9/09/21 mid-day report with pivot point cited based on its 8/12 /21 high after a cup-with-handle base. A gain and strong close above the pivot point backed by at least +40% above average volume may trigger a technical buy signal. Little resistance remains while rallying near its all-time high. Fundamentals are strong.
>>> FEATURED STOCK ARTICLE : Close in Lower Half of Range Indicates Distributional Pressure - 9/9/2021 |
View all notes |
Set NEW NOTE alert |
Company Profile |
SEC
News |
Chart |
Request a new note
C
A
S
I |
Symbol/Exchange
Company Name
Industry Group |
PRICE |
CHANGE
(%Change) |
Day High |
Volume
(% DAV)
(% 50 day avg vol) |
52 Wk Hi
% From Hi |
Featured
Date |
Price
Featured |
Pivot Featured |
|
Max Buy |
SHOP
-
NYSE
Shopify Inc Cl A
Computer Sftwr-Enterprse
|
$1,444.00
|
-32.60
-2.21% |
$1,475.95
|
861,849
86.71% of 50 DAV
50 DAV is 994,000
|
$1,650.00
-12.48%
|
7/2/2021
|
$1,468.00
|
PP = $1,552.23
|
|
MB = $1,629.84
|
Most Recent Note - 9/22/2021 5:15:36 PM
G - Posted a gain with light volume. A rebound above its 50 DMA line ($1,510) is needed for its outlook to improve. Halted its slide after a dip below the prior low ($1437.50 on 8/20/21) raising concerns. Fundamentals remain strong.
>>> FEATURED STOCK ARTICLE : Volume Cools While Consolidating Above 50-Day Moving Average - 8/31/2021 |
View all notes |
Set NEW NOTE alert |
Company Profile |
SEC
News |
Chart |
Request a new note
C
A
S
I |
MEDP
-
NASDAQ
Medpace Holdings Inc
Medical-Research Eqp/Svc
|
$198.21
|
+2.97
1.52% |
$199.04
|
162,606
94.54% of 50 DAV
50 DAV is 172,000
|
$198.03
0.09%
|
9/10/2021
|
$196.32
|
PP = $196.22
|
|
MB = $206.03
|
Most Recent Note - 9/23/2021 5:25:20 PM
Y - Rebounded near its 52-week high with today's 3rd consecutive gain backed by light volume. Found prompt support near its 50 DMA line ($181.74). Highlighted in yellow with pivot point cited based on its 4/26/21 high plus 10 cents in the 9/10/21 mid-day report. Subsequent gains and strong close above the pivot point backed by at least +40% above average volume may trigger a technical buy signal.
>>> FEATURED STOCK ARTICLE : Negative Reversal Indicative of Distributional Pressure - 9/10/2021 |
View all notes |
Set NEW NOTE alert |
Company Profile |
SEC
News |
Chart |
Request a new note
C
A
S
I |
YETI
-
NYSE
Yeti Holdings Inc
Leisure-Products
|
$95.97
|
-2.92
-2.95% |
$97.41
|
1,171,276
157.22% of 50 DAV
50 DAV is 745,000
|
$105.62
-9.14%
|
5/13/2021
|
$84.20
|
PP = $90.65
|
|
MB = $95.18
|
Most Recent Note - 9/24/2021 12:24:16 PM
G - Gapped down today slumping back below its 50 DMA line ($98.42) and testing support near the recent low ($94.15). There was a noted "negative reversal" after hitting a new all-time high on 8/06/21. Fundamentals remain strong.
>>> FEATURED STOCK ARTICLE : Important Test of 50-Day Moving Average Line - 8/19/2021 |
View all notes |
Set NEW NOTE alert |
Company Profile |
SEC
News |
Chart |
Request a new note
C
A
S
I |
JEF
-
NYSE
Jefferies Financial Grp
Finance-Invest Bnk/Bkrs
|
$37.29
|
+0.03
0.08% |
$37.51
|
1,646,341
104.86% of 50 DAV
50 DAV is 1,570,000
|
$37.85
-1.48%
|
6/28/2021
|
$31.81
|
PP = $34.42
|
|
MB = $36.14
|
Most Recent Note - 9/23/2021 5:17:18 PM
G - Challenging its all-time high after finding support near prior highs in the $34-35 range and above its 50 DMA line ($35.16).
>>> FEATURED STOCK ARTICLE : Quiet Gains for New High Closes - 8/10/2021 |
View all notes |
Set NEW NOTE alert |
Company Profile |
SEC
News |
Chart |
Request a new note
C
A
S
I |
DBX
-
NASDAQ
Dropbox Inc Cl A
Computer Sftwr-Database
|
$31.54
|
+0.27
0.86% |
$31.55
|
1,944,760
52.14% of 50 DAV
50 DAV is 3,730,000
|
$33.00
-4.42%
|
9/3/2021
|
$32.45
|
PP = $33.00
|
|
MB = $34.65
|
Most Recent Note - 9/23/2021 5:15:09 PM
Y - Color code is changed to yellow after quietly rising back above its 50 DMA line ($31.20). More damaging losses below the prior low ($30.02) would raise greater concerns. Highlighted in yellow in the 9/03/21 mid-day report while noted - "A valid "secondary buy point" exists up to +5% above the latest high, as it found support at the 10 WMA following an earlier breakout."
>>> FEATURED STOCK ARTICLE : Volume Higher on 6th Consecutive Gain for Dropbox - 9/3/2021 |
View all notes |
Set NEW NOTE alert |
Company Profile |
SEC
News |
Chart |
Request a new note
C
A
S
I |
Symbol/Exchange
Company Name
Industry Group |
PRICE |
CHANGE
(%Change) |
Day High |
Volume
(% DAV)
(% 50 day avg vol) |
52 Wk Hi
% From Hi |
Featured
Date |
Price
Featured |
Pivot Featured |
|
Max Buy |
CLAR
-
NASDAQ
Clarus Corporation
Leisure-Products
|
$27.53
|
+0.24
0.88% |
$27.72
|
77,835
50.22% of 50 DAV
50 DAV is 155,000
|
$32.36
-14.93%
|
5/12/2021
|
$21.40
|
PP = $19.73
|
|
MB = $20.72
|
Most Recent Note - 9/22/2021 5:16:34 PM
G - Still sputtering below its 50 DMA line ($27.77) and a rebound above the 50 DMA line is needed for its outlook to improve. Fundamentals remain strong.
>>> FEATURED STOCK ARTICLE : Fundamentals Strong and Finding Support at 50-Day Moving Average - 9/1/2021 |
View all notes |
Set NEW NOTE alert |
Company Profile |
SEC
News |
Chart |
Request a new note
C
A
S
I |
AVTR
-
NYSE
Avantor Inc
Medical-Research Eqp/Svc
|
$44.01
|
+0.21
0.48% |
$44.06
|
2,146,346
60.16% of 50 DAV
50 DAV is 3,568,000
|
$44.37
-0.81%
|
6/10/2021
|
$32.94
|
PP = $34.09
|
|
MB = $35.79
|
Most Recent Note - 9/21/2021 6:01:12 PM
G - Completed a Secondary Offering on 9/13/21 while perched at its all-time high, very extended from any sound base. Its 50 DMA line ($39.07) defines near-term support to watch on pullbacks.
>>> FEATURED STOCK ARTICLE : Steady Progress Made Since Featured - 8/27/2021 |
View all notes |
Set NEW NOTE alert |
Company Profile |
SEC
News |
Chart |
Request a new note
C
A
S
I |
MIME
-
NASDAQ
Mimecast Limited
Computer Sftwr-Security
|
$66.60
|
-0.03
-0.05% |
$66.93
|
407,523
39.68% of 50 DAV
50 DAV is 1,027,000
|
$71.45
-6.79%
|
8/2/2021
|
$56.12
|
PP = $59.58
|
|
MB = $62.56
|
Most Recent Note - 9/21/2021 5:58:37 PM
G - Halted its slide today after pulling back from its all-time high with volume-driven loss. Disciplined investors avoid buying stocks more than +5% above their pivot point or prior high. Its 50 DMA line ($61.55) and prior highs in the $59 area define initial support to watch on pullbacks. Fundamentals remain strong. See the latest FSU analysis for more details and a new annotated graph.
>>> FEATURED STOCK ARTICLE : Consolidating After Getting Extended from Previous Base Noted - 9/21/2021 |
View all notes |
Set NEW NOTE alert |
Company Profile |
SEC
News |
Chart |
Request a new note
C
A
S
I |