You are not logged in.
This means you
CAN ONLY VIEW reports that were published prior to Thursday, March 20, 2025.
You
MUST UPGRADE YOUR MEMBERSHIP if you want to see any current reports.
AFTER MARKET UPDATE - MONDAY, APRIL 19TH, 2021
Previous After Market Report Next After Market Report >>>
|
|
|
|
DOW |
-123.04 |
34,077.63 |
-0.36% |
|
Volume |
856,198,079 |
-26% |
|
Volume |
4,350,748,000 |
-1% |
|
NASDAQ |
-139.47 |
13,912.87 |
-0.99% |
|
Advancers |
1,081 |
33% |
|
Advancers |
1,209 |
29% |
|
S&P 500 |
-22.21 |
4,163.26 |
-0.53% |
|
Decliners |
2,164 |
67% |
|
Decliners |
2,942 |
71% |
|
Russell 2000 |
-30.67 |
2,232.00 |
-1.36% |
|
52 Wk Highs |
236 |
|
|
52 Wk Highs |
144 |
|
|
S&P 600 |
-14.55 |
1,333.40 |
-1.08% |
|
52 Wk Lows |
32 |
|
|
52 Wk Lows |
104 |
|
|
 |
Breadth Negative and Leadership Thinned as Major Indices Fell
Kenneth J. Gruneisen - Passed the CAN SLIM® Master's Exam
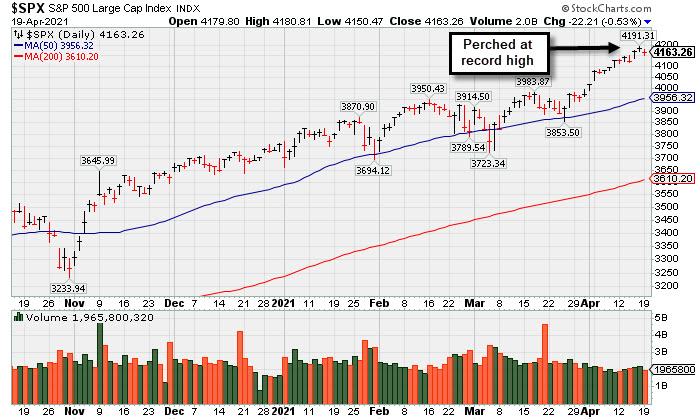
The S&P 500 declined 0.5%, coming off its fourth straight weekly advance that had been its longest such stretch of gains since August. The Dow fell 123 points, ending a three-day winning streak. Both benchmarks saw their worst session in almost four weeks. The Nasdaq Composite shed 1%, while the small-cap Russell 2000 slumped 1.6%. The volume totals were lighter than the prior session on the NYSE and on the Nasdaq exchange. Breadth was negative as decliners led advancers by a 2-1 margin on the NYSE and 7-3 on the Nasdaq exchange. There were 55 high-ranked companies from the Leaders List that hit new 52-week highs and were listed on the BreakOuts Page, versus the total of 79 on the prior session. New 52-week highs totals contracted yet still outnumbered increasing new 52-week lows on the NYSE on the Nasdaq exchange. The major indices (M criteria) are in a confirmed uptrend. Investors are reminded to always make buying and selling decisions on case-by-case basis under the strict criteria and rules of the fact-based investment system.
PICTURED: The S&P 500 Index is perched at its record high.
U.S. stocks drifted from record levels on Monday as investors reassessed the recent run-up in equities. Ten of 11 S&P 500 sectors closed in negative territory, with Consumer Discretionary lagging the most. Tesla (TSLA -3.40%) after one of its apparently driverless electric vehicles was involved in a fatal crash. In earnings, Coca-Cola (KO +0.60%) inched higher after topping analyst profit and sales estimates and noting that March demand had climbed back to pre-pandemic levels. In other corporate news, Peloton (PTON -7.28%) fell following a federal safety agency warning concerning the company's treadmill. Elsewhere, shares of Johnson & Johnson (JNJ +0.28%) edged higher amid expectations that the use of its COVID-19 vaccine could resume as soon as Friday, perhaps with some restrictions. The CDC had recommended pausing inoculation last week on reports of rare but severe blot clotting in some patients.
Treasuries were little changed, with the yield on the 10-year note up one basis point to 1.60%. In FOREX trading, a gauge of the U.S. dollar dropped 0.5% to a one-month low, helping provide a tailwind to oil prices. WTI crude added 0.5% to $63.44/barrel following its first sizeable weekly advance in the last six weeks (+ 6.4%). |
 Kenneth J. Gruneisen started out as a licensed stockbroker in August 1987, a couple of months prior to the historic stock market crash that took the Dow Jones Industrial Average down -22.6% in a single day. He has published daily fact-based fundamental and technical analysis on high-ranked stocks online for two decades. Through FACTBASEDINVESTING.COM, Kenneth provides educational articles, news, market commentary, and other information regarding proven investment systems that work in good times and bad.
Comments contained in the body of this report are technical opinions only and are not necessarily those of Gruneisen Growth Corp. The material herein has been obtained from sources believed to be reliable and accurate, however, its accuracy and completeness cannot be guaranteed. Our firm, employees, and customers may effect transactions, including transactions contrary to any recommendation herein, or have positions in the securities mentioned herein or options with respect thereto. Any recommendation contained in this report may not be suitable for all investors and it is not to be deemed an offer or solicitation on our part with respect to the purchase or sale of any securities. |
|
 |
Tech Sector and Retail Index Led Group Decliners
Kenneth J. Gruneisen - Passed the CAN SLIM® Master's Exam
The Retail Index ($RLX -0.77%) suffered a modest loss and the Broker/Dealer Index ($XBD -0.11%) and Bank Index ($BKX -0.38%) both weighed slightly on the major indices. The Semiconductor Index ($SOX -2.52%) outpaced the Networking Index ($NWX -1.10%) and Biotech Index ($BTK -0.80%) to the downside as the tech sector slumped. The Gold & Silver Index ($XAU -1.06%) also lost ground and the Oil Services Index ($OSX -0.15%) and Integrated Oil Index ($XOI -0.10%) both were little changed. PICTURED: The Gold & Silver Index ($XAU -1.06%) is now consolidating above its 50-day and 200-day moving average (DMA) lines.
| Oil Services |
$OSX |
51.83 |
-0.08 |
-0.15% |
+16.92% |
| Integrated Oil |
$XOI |
1,000.17 |
-1.04 |
-0.10% |
+26.21% |
| Semiconductor |
$SOX |
3,171.00 |
-82.08 |
-2.52% |
+13.43% |
| Networking |
$NWX |
805.31 |
-8.92 |
-1.10% |
+12.30% |
| Broker/Dealer |
$XBD |
462.09 |
-0.49 |
-0.11% |
+22.38% |
| Retail |
$RLX |
3,929.73 |
-30.47 |
-0.77% |
+10.28% |
| Gold & Silver |
$XAU |
147.57 |
-1.58 |
-1.06% |
+2.35% |
| Bank |
$BKX |
122.55 |
-0.47 |
-0.38% |
+25.16% |
| Biotech |
$BTK |
5,505.41 |
-44.33 |
-0.80% |
-4.07% |
|
|
|
 |
Steady Streak of Gains Into New High Territory
Kenneth J. Gruneisen - Passed the CAN SLIM® Master's Exam
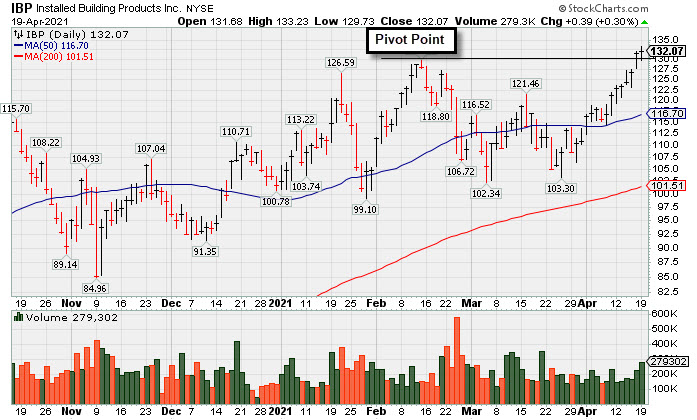
Installed Building Products (IBP +$0.39 or +0.30% to $132.07) was highlighted in yellow with new pivot point cited based on its 2/12/21 high plus 10 cents in the mid-day report (read here ). It is perched at its all-time high after 8 consecutive small gains lacking great volume conviction. Subsequent gains and strong close above its pivot point backed by at least +40% above average volume may trigger a proper technical buy signal.
IBP currently has an Earnings Per Share Rating of 97. It reported earnings +34% on +10% sales revenues for the Dec '20 quarter versus the year-ago period. Three of the past 4 consecutive quarterly comparisons were above the +25% minimum earnings guideline (C criteria). Its annual earnings (A criteria) history has been strong.
Its current Up/Down Volume Ratio of 1.8 is an unbiased neutral indication with regard to accumulation/distribution over the past 50 days. The high-ranked Building - Maintenance & Service firm has seen the number of top-rated funds owning its shares rose from 226 in Mar '16 to 399 in Dec '20, a reassuring sign concerning the I criteria. Its small supply of only 29.6 million shares outstanding (S criteria) can contribute to greater price volatility in the event of institutional buying or selling. It currently has a Timeliness Rating of B and a Sponsorship Rating of C.
IBP was dropped from the Featured Stocks list and went through some choppy consolidations since last shown in this FSU section on 1/25/18 with an annotated graph under the headline, "Quietly Consolidating Near 50-Day Moving Average Line". IBP had traded up as much as +77.3% since first highlighted in the 2/27/17 mid-day report in yellow with pivot point cited based on its 12/08/16 high plus 10 cents (read here).
|
|
|
Color Codes Explained :
Y - Better candidates highlighted by our
staff of experts.
G - Previously featured
in past reports as yellow but may no longer be buyable under the
guidelines.
***Last / Change / Volume data in this table is the closing quote data***
Symbol/Exchange
Company Name
Industry Group |
PRICE |
CHANGE
(%Change) |
Day High |
Volume
(% DAV)
(% 50 day avg vol) |
52 Wk Hi
% From Hi |
Featured
Date |
Price
Featured |
Pivot Featured |
|
Max Buy |
 FBC
-
NYSE
FBC
-
NYSE
Flagstar Bancorp Inc
BANKING - Savings and Loans
|
$44.18
|
+0.37
0.84% |
$44.19
|
566,555
1,573.76% of 50 DAV
50 DAV is 36,000
|
$51.58
-14.35%
|
3/4/2021
|
$47.26
|
PP = $48.02
|
|
MB = $50.42
|
 Most Recent Note - 4/19/2021 2:39:50 PM
G - Still hovering below its 50 DMA line ($45.63) which has acted as resistance in recent weeks. A rebound above the 50 DMA line is needed for its outlook to improve. Near-term support to watch is prior lows. Relative Strength Rating is 72, below the 80+ minimum guideline.
>>> FEATURED STOCK ARTICLE : 50-Day Moving Average Line Acted as Resistance - 4/13/2021 |
View all notes |
Set NEW NOTE alert |
Company Profile |
SEC
News |
Chart |
Request a new note
C
A
S
I |
CRL
-
NYSE
Charles River Labs Intl
DRUGS - Biotechnology
|
$324.59
|
+1.21
0.37% |
$324.96
|
346,353
107.90% of 50 DAV
50 DAV is 321,000
|
$323.89
0.22%
|
12/17/2020
|
$247.06
|
PP = $257.98
|
|
MB = $270.88
|
Most Recent Note - 4/15/2021 5:42:10 PM
G - Posted another solid gain today for a new all-time high. Its 50 DMA line ($287) acted as support throughout its ongoing ascent. Its Relative Strength Rating is 81, above the 80+ minimum guideline for buy candidates. Dec '20 quarterly earnings rose +19% on +14% sales revenues versus the year ago period, below the +25% minimum earnings guideline (C criteria), raising fundamental concerns.
>>> FEATURED STOCK ARTICLE : Perched at Record High After Rally From 50-Day Moving Average - 4/9/2021 |
View all notes |
Set NEW NOTE alert |
Company Profile |
SEC
News |
Chart |
Request a new note
C
A
S
I |
BRKS
-
NASDAQ
Brooks Automation
ELECTRONICS - Semiconductor Equipment and Mate
|
$97.97
|
-4.36
-4.26% |
$104.40
|
1,078,969
154.58% of 50 DAV
50 DAV is 698,000
|
$103.09
-4.97%
|
4/5/2021
|
$99.31
|
PP = $91.88
|
|
MB = $96.47
|
Most Recent Note - 4/19/2021 5:13:59 PM
G - There was a "negative reversal" today after hitting a new all-time high. Prior highs in the $91 area define initial support to watch above its 50 DMA line ($86.50).
>>> FEATURED STOCK ARTICLE : High Ranked Semiconductor Equipment Firm Powered Higher - 4/7/2021 |
View all notes |
Set NEW NOTE alert |
Company Profile |
SEC
News |
Chart |
Request a new note
C
A
S
I |
ENTG
-
NASDAQ
Entegris Inc
ELECTRONICS - Semiconductor Equipment and Mate
|
$113.15
|
-4.23
-3.60% |
$117.02
|
1,014,397
106.78% of 50 DAV
50 DAV is 950,000
|
$126.41
-10.49%
|
4/1/2021
|
$118.42
|
PP = $110.37
|
|
MB = $115.89
|
Most Recent Note - 4/19/2021 2:37:35 PM
Y - Color code is changed to yellow while pulling back below its "max buy" level and undercutting the prior high $114. Prior high in the $110 area defines the next near-term support to watch above its 50 DMA line ($106.87).
>>> FEATURED STOCK ARTICLE : Strong Breakout Action With +67% Above Average Volume - 4/1/2021 |
View all notes |
Set NEW NOTE alert |
Company Profile |
SEC
News |
Chart |
Request a new note
C
A
S
I |
OPY
-
NYSE
Oppenheimer Holdings Inc
FINANCIAL SERVICES - Investment Brokerage - Regiona
|
$45.19
|
+0.53
1.19% |
$45.44
|
155,318
127.31% of 50 DAV
50 DAV is 122,000
|
$45.22
-0.07%
|
2/25/2021
|
$38.95
|
PP = $38.11
|
|
MB = $40.02
|
Most Recent Note - 4/19/2021 2:29:43 PM
G - Inching to new all-time highs with today's 7th consecutive small gain, extended from any sound base. Its 50 DMA line ($40.41) and prior low define near-term support to watch on pullbacks.
>>> FEATURED STOCK ARTICLE : Oppenheimer Consolidating Near Max Buy Level - 3/31/2021 |
View all notes |
Set NEW NOTE alert |
Company Profile |
SEC
News |
Chart |
Request a new note
C
A
S
I |
Symbol/Exchange
Company Name
Industry Group |
PRICE |
CHANGE
(%Change) |
Day High |
Volume
(% DAV)
(% 50 day avg vol) |
52 Wk Hi
% From Hi |
Featured
Date |
Price
Featured |
Pivot Featured |
|
Max Buy |
EDUC
-
NASDAQ
Educational Development
WHOLESALE - Basic Materials Wholesale
|
$17.35
|
-0.13
-0.74% |
$17.97
|
20,973
69.91% of 50 DAV
50 DAV is 30,000
|
$20.00
-13.25%
|
3/10/2021
|
$17.89
|
PP = $20.10
|
|
MB = $21.11
|
Most Recent Note - 4/16/2021 5:33:49 PM
Y - Still consolidating above its 50 DMA line ($16.90) which defines important near-term support. Met stubborn resistance in the $19-20 area. Subsequent gains above the pivot point backed by at least +40% above average volume are needed to trigger a proper technical buy signal. See the latest FSU analysis for more details and a new annotated graph.
>>> FEATURED STOCK ARTICLE : Finding Support During Consolidation Above 50-Day Moving Average - 4/16/2021 |
View all notes |
Set NEW NOTE alert |
Company Profile |
SEC
News |
Chart |
Request a new note
C
A
S
I |
SMPL
-
NASDAQ
Simply Good Foods Co
Food-Confectionery
|
$33.21
|
-0.21
-0.63% |
$33.34
|
290,599
41.19% of 50 DAV
50 DAV is 705,500
|
$35.25
-5.79%
|
12/28/2020
|
$30.40
|
PP = $31.44
|
|
MB = $33.01
|
Most Recent Note - 4/19/2021 5:10:46 PM
G - Still showing resilience and perched within striking distance of its 52-week and all-time high with volume totals cooling. Reported Feb '21 quarterly earnings +9% on +2% sales revenues versus the year ago period, below the +25% minimum earnings guideline (C criteria), raising fundamental concerns. Found prompt support near its 50 DMA line ($30.82) but its current Relative Strength Rating is 76, below the 80+ minimum guideline for buy candidates.
>>> FEATURED STOCK ARTICLE : Perched Near High But Fundamental Concerns Were Raised - 4/14/2021 |
View all notes |
Set NEW NOTE alert |
Company Profile |
SEC
News |
Chart |
Request a new note
C
A
S
I |
IBP
-
NYSE
Installed Building Prod
DIVERSIFIED SERVICES - Business/Management Services
|
$132.07
|
+0.39
0.30% |
$133.23
|
279,472
133.08% of 50 DAV
50 DAV is 210,000
|
$132.19
-0.09%
|
4/19/2021
|
$131.15
|
PP = $130.21
|
|
MB = $136.72
|
Most Recent Note - 4/19/2021 6:08:30 PM
Y - Highlighted in yellow in the earlier mid-day report with new pivot point cited based on its 2/12/21 high plus 10 cents. Hit a new all-time high with today's 8th consecutive small gains. A solid gain and strong close above its pivot point backed by at least +40%v above average volume is needed to trigger a proper technical buy signal. Reported earnings +34% on +10% sales revenues for the Dec '20 quarter versus the year-ago period. Three of the past 4 consecutive quarterly comparisons were above the +25% minimum earnings guideline (C criteria). Annual earnings (A criteria) history has been strong. See the latest FSU analysis for more details and a new annotated graph.
>>> FEATURED STOCK ARTICLE : Steady Streak of Gains Into New High Territory - 4/19/2021 |
View all notes |
Set NEW NOTE alert |
Company Profile |
SEC
News |
Chart |
Request a new note
C
A
S
I |
QRVO
-
NASDAQ
Qorvo Inc
ELECTRONICS - Semiconductor - Integrated Cir
|
$188.44
|
-3.83
-1.99% |
$193.16
|
673,322
49.84% of 50 DAV
50 DAV is 1,351,000
|
$199.94
-5.75%
|
4/1/2021
|
$190.48
|
PP = $191.92
|
|
MB = $201.52
|
Most Recent Note - 4/19/2021 2:33:35 PM
Y - Undercutting the prior high ($191) with today's loss. Stalled after recently wedging up to new highs from a noted 9-week base. Prior highs in the $185 area define near-term support to watch above its 50 DMA line ($179).
>>> FEATURED STOCK ARTICLE : Hit Another New High With Even Less Volume Conviction - 4/5/2021 |
View all notes |
Set NEW NOTE alert |
Company Profile |
SEC
News |
Chart |
Request a new note
C
A
S
I |
YETI
-
NYSE
Yeti Holdings Inc
Leisure-Products
|
$85.15
|
-1.66
-1.91% |
$87.40
|
1,629,088
117.37% of 50 DAV
50 DAV is 1,388,000
|
$87.72
-2.93%
|
4/6/2021
|
$76.95
|
PP = $79.42
|
|
MB = $83.39
|
Most Recent Note - 4/16/2021 5:37:53 PM
G - Color code is changed to green after hitting another new all-time high and rallying above its "max" buy level, getting extended from the latest base. Prior highs in the $80 area define initial support to watch on pullbacks.
>>> FEATURED STOCK ARTICLE : YETI Perched Within Striking Distance of High - 4/7/2021 |
View all notes |
Set NEW NOTE alert |
Company Profile |
SEC
News |
Chart |
Request a new note
C
A
S
I |
Symbol/Exchange
Company Name
Industry Group |
PRICE |
CHANGE
(%Change) |
Day High |
Volume
(% DAV)
(% 50 day avg vol) |
52 Wk Hi
% From Hi |
Featured
Date |
Price
Featured |
Pivot Featured |
|
Max Buy |
DT
-
NYSE
Dynatrace Inc
Computer Sftwr-Enterprse
|
$52.29
|
-0.82
-1.54% |
$53.56
|
1,213,051
53.71% of 50 DAV
50 DAV is 2,258,700
|
$56.94
-8.17%
|
2/4/2021
|
$51.39
|
PP = $48.95
|
|
MB = $51.40
|
Most Recent Note - 4/16/2021 5:40:17 PM
G - Volume totals have been cooling while consolidating near its 52-week high. Recent lows in the $45 area define important near-term support to watch on pullbacks. Its Relative Strength Rating is 75 is still below the 80+ minimum guideline for buy candidates. Fundamentals remain strong after it reported Dec '20 earnings +70% on +28% sales revenues versus the year ago period.
>>> FEATURED STOCK ARTICLE : Gap Up Rebounding Further Above 50-Day Moving Average - 4/8/2021 |
View all notes |
Set NEW NOTE alert |
Company Profile |
SEC
News |
Chart |
Request a new note
C
A
S
I |
MRBK
-
NASDAQ
Meridian Corp
Banks-Northeast
|
$25.53
|
-0.31
-1.20% |
$26.30
|
16,808
45.43% of 50 DAV
50 DAV is 37,000
|
$27.96
-8.69%
|
2/22/2021
|
$25.58
|
PP = $26.10
|
|
MB = $27.41
|
Most Recent Note - 4/16/2021 1:09:23 PM
Y - Encountering distributional pressure in recent weeks yet still consolidating above its 50 DMA line ($25.23) and prior low ($24.13 on 3/25/21). Damaging losses leading to violations may trigger technical sell signals. Its Relative Strength Rating is 83, above the 80+ minimum guideline.
>>> FEATURED STOCK ARTICLE : Encountering Distributional Pressure - 4/12/2021 |
View all notes |
Set NEW NOTE alert |
Company Profile |
SEC
News |
Chart |
Request a new note
C
A
S
I |
|
|
|
THESE ARE NOT BUY RECOMMENDATIONS!
Comments contained in the body of this report are technical
opinions only. The material herein has been obtained
from sources believed to be reliable and accurate, however,
its accuracy and completeness cannot be guaranteed.
This site is not an investment advisor, hence it does
not endorse or recommend any securities or other investments.
Any recommendation contained in this report may not
be suitable for all investors and it is not to be deemed
an offer or solicitation on our part with respect to
the purchase or sale of any securities. All trademarks,
service marks and trade names appearing in this report
are the property of their respective owners, and are
likewise used for identification purposes only.
This report is a service available
only to active Paid Premium Members.
You may opt-out of receiving report notifications
at any time. Questions or comments may be submitted
by writing to Premium Membership Services 665 S.E. 10 Street, Suite 201 Deerfield Beach, FL 33441-5634 or by calling 1-800-965-8307
or 954-785-1121.
|
|
|