You are not logged in.
This means you
CAN ONLY VIEW reports that were published prior to Tuesday, March 25, 2025.
You
MUST UPGRADE YOUR MEMBERSHIP if you want to see any current reports.
AFTER MARKET UPDATE - WEDNESDAY, FEBRUARY 21ST, 2024
Previous After Market Report Next After Market Report >>>
|
|
|
|
DOW |
+48.44 |
38,612.24 |
+0.13% |
|
Volume |
902,799,976 |
-8% |
|
Volume |
4,909,366,900 |
-14% |
|
NASDAQ |
-49.91 |
15,580.87 |
-0.32% |
|
Advancers |
1,379 |
50% |
|
Advancers |
1,532 |
36% |
|
S&P 500 |
+6.29 |
4,981.80 |
+0.13% |
|
Decliners |
1,362 |
50% |
|
Decliners |
2,703 |
64% |
|
Russell 2000 |
-9.40 |
1,994.74 |
-0.47% |
|
52 Wk Highs |
94 |
|
|
52 Wk Highs |
59 |
|
|
S&P 600 |
-3.60 |
1,287.81 |
-0.28% |
|
52 Wk Lows |
31 |
|
|
52 Wk Lows |
111 |
|
|
 |
Major Indices were Mixed as Leadership Thinned
Kenneth J. Gruneisen - Passed the CAN SLIM® Master's Exam
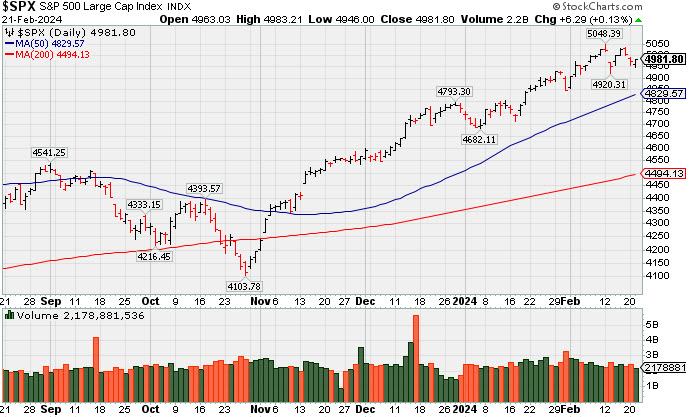
The S&P 500 and Dow Jones Industrial Average each eked out a 0.1% gain while the Nasdaq Composite and Russell 2000 declined 0.3% and 0.5%, respectively. Volume was reported lighter than the prior session total on the NYSE and on the Nasdaq exchange. Decliners and advancers were evenly matched on the NYSE while decliners led advancers by a 5-3 margin on the Nasdaq exchange. There were 36 high-ranked companies from the Leaders List that hit new 52-week highs and were listed on the BreakOuts Page, versus the total of 42 on the prior session. New 52-week highs totals contracted yet still outnumbered new 52-week lows totals on the NYSE but new lows outnumbered new highs on the Nasdaq exchange. The major indices are in a confirmed uptrend (M criteria). New buying efforts should be only made in stocks fitting all key criteria of the fact-based investment system.
PICTURED: The S&P 500 Index is consolidating well above its 50-day moving average line.
A sharp loss in Palo Alto Networks (PANW -28.44%) came after it reported disappointing guidance. NVIDIA (NVDA -2.85%) sputtered in front of its earnings report. The S&P 500 information technology sector was alone in negative territory at the close, down -0.8%. The energy sector logged the largest gain, climbing +1.9%, as natural gas futures jumped +12.1% to $1.76/mmbtu.
The minutes for the January 30-31 FOMC meeting were scripted largely as expected. Fed Chair Powell effectively "wrote them" for the market when he conducted his press conference following that January meeting.
|
 Kenneth J. Gruneisen started out as a licensed stockbroker in August 1987, a couple of months prior to the historic stock market crash that took the Dow Jones Industrial Average down -22.6% in a single day. He has published daily fact-based fundamental and technical analysis on high-ranked stocks online for two decades. Through FACTBASEDINVESTING.COM, Kenneth provides educational articles, news, market commentary, and other information regarding proven investment systems that work in good times and bad.
Comments contained in the body of this report are technical opinions only and are not necessarily those of Gruneisen Growth Corp. The material herein has been obtained from sources believed to be reliable and accurate, however, its accuracy and completeness cannot be guaranteed. Our firm, employees, and customers may effect transactions, including transactions contrary to any recommendation herein, or have positions in the securities mentioned herein or options with respect thereto. Any recommendation contained in this report may not be suitable for all investors and it is not to be deemed an offer or solicitation on our part with respect to the purchase or sale of any securities. |
|
 |
Retail and Energy-Linked Groups Rose
Kenneth J. Gruneisen - Passed the CAN SLIM® Master's Exam
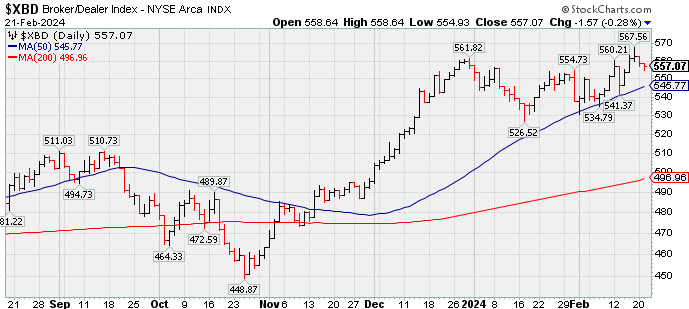
The Broker/Dealer Index ($XBD -0.28%) edged lower and the Bank Index ($BKX +0.07%) finished flat. The Retail Index ($RLX +0.77%) posted a small gain. The Gold & Silver Index ($XAU -0.74%) lost ground while the Oil Services Index ($OSX +1.14%) and Integrated Oil Index ($XOI +1.70%) both posted gains. The tech sector had a negative bias as the Networking Index ($NWX -3.01%) led the retreat and the Semiconductor Index ($SOX -0.24%) edged lower while the Biotech Index ($BTK +0.18%) eked out a small gain.
![]() PICTURED: The Broker/Dealer Index ($XBD -0.28%) is consolidating above its 50-day moving average (DMA) line.
| Oil Services |
$OSX |
81.10 |
+0.91 |
+1.14% |
-3.31% |
| Integrated Oil |
$XOI |
1,934.91 |
+32.25 |
+1.70% |
+3.89% |
| Semiconductor |
$SOX |
4,446.36 |
-10.51 |
-0.24% |
+6.49% |
| Networking |
$NWX |
800.10 |
-24.81 |
-3.01% |
-3.93% |
| Broker/Dealer |
$XBD |
557.07 |
-1.57 |
-0.28% |
-0.04% |
| Retail |
$RLX |
4,215.56 |
+32.07 |
+0.77% |
+8.40% |
| Gold & Silver |
$XAU |
107.04 |
-0.79 |
-0.74% |
-14.84% |
| Bank |
$BKX |
95.12 |
+0.06 |
+0.07% |
-0.94% |
| Biotech |
$BTK |
5,107.85 |
+9.27 |
+0.18% |
-5.74% |
|
|
|
 |
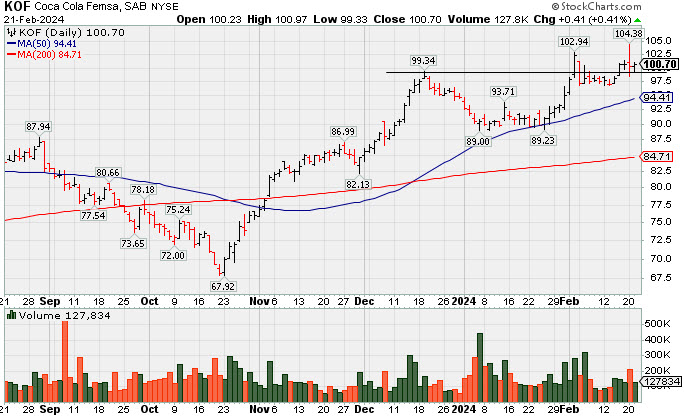
Perched at High With Earnings News Due
Kenneth J. Gruneisen - Passed the CAN SLIM® Master's Exam
Coca Cola Femsa Sab Ads (KOF +$0.41 or +0.41% to $100.70) held its ground today following a "negative reversal" on the prior session after hitting a new all-time high. The recent low in the $97 area defines initial support above its 50-day moving average (DMA) line ($94.41). It is due to report Dec '23 quarterly results on 2/22/24. Volume and volatility often increase near earnings news.
Its Relative Strength Rating is currently 84, above the 80+ minimum guideline for buy candidates. KOF was highlighted in yellow in the 1/12/24 mid-day report (read here) because a valid secondary buy point exists up to +5% above the recent high since finding support at its 10-week moving average (WMA) line after an earlier breakout.
KOF has a 95 Earnings Per Share Rating. It reported Sep '23 quarterly earnings +42% on +27% sales revenues versus the year-ago period, and 3 of the 4 latest quarterly comparisons were above the +25% minimum guideline (C criteria). KOF was last shown in great detail on 1/12/24 with an annotated graph under the headline "Secondary Buy Point Noted After Finding Support". Annal earnings had a downturn in FY '20 like many companies during the pandemic.
It hails from the Beverages - Non-Alcoholic group which is currently ranked 83rd on the 197 Industry Groups list. There are 857.1 million shares in the public float (S criteria). The number of top-rated funds owning its shares rose from 120 in Mar '22 to 168 in Dec '23, a reassuring sign concerning the I criteria. Its current Up/Down Volume Ratio of 1.7 is an unbiased indication its shares have been under accumulation over the past 50 days.
Symbol/Exchange
Company Name
Industry Group | PRICE | CHANGE
(%Change) | Day High | Volume
(% DAV)
(% 50 day avg vol) | 52 Wk Hi
% From Hi | Featured
Date | Price
Featured | Pivot Featured | | Max Buy |  ANET - NYSE ANET - NYSE
Arista Networks
Computer-Networking | $254.49 | -5.12
-1.97% | $258.80 | 2,534,836
118.39% of 50 DAV
50 DAV is 2,141,000 | $292.66
-13.04%
| 10/31/2023 | $188.84 | PP = $198.80 | | MB = $208.74 | Most Recent Note - 2/20/2024 7:05:15 PM
G - Gapped down today. Still extended from any sound base. Its 50 DMA line ($250.82) defines important near-term support to watch on pullbacks.
>>> FEATURED STOCK ARTICLE : Pulled Back From All Time High With Gap Down on Prior Session - 2/1/2024 | View all notes | Set NEW NOTE alert | Company Profile | SEC News | Chart | Request a new note C A S I | NVO - NYSE
Novo Nordisk ADR
Medical-Ethical Drugs | $120.93 | -0.52
-0.43% | $120.99 | 4,107,948
89.28% of 50 DAV
50 DAV is 4,601,000 | $124.76
-3.07%
| 11/2/2023 | $100.97 | PP = $104.10 | | MB = $109.31 | Most Recent Note - 2/16/2024 1:04:42 PM
G - extended from any sound base and hitting yet another new all-time high with today''s gain. Its 50 DMA line ($107.53) defines important near-term support to watch on pullbacks.
>>> FEATURED STOCK ARTICLE : Extended From Any Sound Base After Volume-Driven Gains - 2/8/2024 | View all notes | Set NEW NOTE alert | Company Profile | SEC News | Chart | Request a new note C A S I | AXON - NASDAQ
Axon Enterprise
Security/Sfty | $263.85 | -3.85
-1.44% | $268.19 | 394,653
106.95% of 50 DAV
50 DAV is 369,000 | $274.78
-3.98%
| 11/8/2023 | $127.84 | PP = $223.30 | | MB = $234.47 | Most Recent Note - 2/20/2024 7:06:12 PM
G - Hovering near its all-time high. Prior highs in the $260-262 area define initial support to watch above its 50-day moving average (DMA) line ($254.91).
>>> FEATURED STOCK ARTICLE : Reversal at All-Time High After 7 Consecutive Gains - 2/12/2024 | View all notes | Set NEW NOTE alert | Company Profile | SEC News | Chart | Request a new note C A S I | TDG - NYSE
TransDigm Group
Aerospace/Defense | $1,164.35 | +5.34
0.46% | $1,165.08 | 173,620
81.51% of 50 DAV
50 DAV is 213,000 | $1,165.00
-0.06%
| 12/12/2023 | $1,000.39 | PP = $1,013.18 | | MB = $1,063.84 |  Most Recent Note - 2/21/2024 4:44:38 PM Most Recent Note - 2/21/2024 4:44:38 PM
G - Inched higher with below-average volume for a best-ever close today. Its 50 DMA line ($1,053) defines near-term support to watch above prior highs in the $1,013-1,015 area.
>>> FEATURED STOCK ARTICLE : Transdigm Perched Near All-Time High - 2/14/2024 | View all notes | Set NEW NOTE alert | Company Profile | SEC News | Chart | Request a new note C A S I | PANW - NASDAQ
Palo Alto Networks
Computer Sftwr-Security | $261.97 | -104.12
-28.44% | $275.98 | 43,466,890
1,211.45% of 50 DAV
50 DAV is 3,588,000 | $380.84
-31.21%
| 1/10/2024 | $313.65 | PP = $318.00 | | MB = $333.90 | Most Recent Note - 2/21/2024 4:42:19 PM
Gapped down today for a considerable volume-driven loss, abruptly retreating from its all-time high, violating its 50 DMA line ($325) and the prior high ($318) triggering technical sell signals. It may find support at its 200 DMA line ($260). It will be dropped from the Featured Stocks list tonight.
>>> FEATURED STOCK ARTICLE : Paused After 6 Gains to a New All-Time High - 1/17/2024 | View all notes | Set NEW NOTE alert | Company Profile | SEC News | Chart | Request a new note C A S I | Symbol/Exchange
Company Name
Industry Group | PRICE | CHANGE
(%Change) | Day High | Volume
(% DAV)
(% 50 day avg vol) | 52 Wk Hi
% From Hi | Featured
Date | Price
Featured | Pivot Featured | | Max Buy | TBBK - NASDAQ
The Bancorp
Banks-Northeast | $43.60 | +0.02
0.05% | $43.83 | 282,793
60.17% of 50 DAV
50 DAV is 470,000 | $47.11
-7.45%
| 1/22/2024 | $40.87 | PP = $42.56 | | MB = $44.69 | Most Recent Note - 2/16/2024 1:06:20 PM
Y - Consolidating well above prior highs in the $42 area and its 50 DMA liner which define near-term support to watch. Fundamentals remain strong.
>>> FEATURED STOCK ARTICLE : Volume-Driven Breakout Triggered Buy Signal After Earnings Report - 1/26/2024 | View all notes | Set NEW NOTE alert | Company Profile | SEC News | Chart | Request a new note C A S I | LULU - NASDAQ
lululemon athletica
Retail-Apparel/Shoes/Acc | $443.46 | -1.14
-0.26% | $448.41 | 791,027
53.85% of 50 DAV
50 DAV is 1,469,000 | $516.39
-14.12%
| 12/8/2023 | $490.61 | PP = $485.93 | | MB = $510.23 | Most Recent Note - 2/15/2024 9:00:12 PM
G - Volume was below average today while it is still lingering below its 50 DMA line ($482) which may act as resistance. A rebound above the 50 DMA line is needed to help its outlook improve.
>>> FEATURED STOCK ARTICLE : Violation of 50-Day Moving Average Hurt Outlook - 2/2/2024 | View all notes | Set NEW NOTE alert | Company Profile | SEC News | Chart | Request a new note C A S I | CRWD - NASDAQ
CrowdStrike Holdings
Computer Sftwr-Security | $292.36 | -31.35
-9.68% | $294.60 | 8,703,601
286.30% of 50 DAV
50 DAV is 3,040,000 | $338.45
-13.62%
| 1/2/2024 | $246.42 | PP = $261.91 | | MB = $275.01 | Most Recent Note - 2/21/2024 12:11:55 PM
G - Gapped down today with a damaging volume-driven loss testing its 50 DMA line ($282.50). Fundamentals remain strong.
>>> FEATURED STOCK ARTICLE : Volume Totals Cooking While Stubbornly Perched at All-Time High - 2/6/2024 | View all notes | Set NEW NOTE alert | Company Profile | SEC News | Chart | Request a new note C A S I | ELF - NYSE
e.l.f. Beauty
Cosmetics/Personal Care | $172.33 | +0.96
0.56% | $176.27 | 725,346
49.24% of 50 DAV
50 DAV is 1,473,000 | $179.58
-4.04%
| 1/2/2024 | $138.23 | PP = $153.63 | | MB = $161.31 | Most Recent Note - 2/15/2024 8:53:48 PM
G - Posted a gain today with near average volume for a best-ever close. Reported Dec '23 quarterly earnings +54% on +85% sales revenues versus the year-ago period, continuing its strong earnings track record. Its 50 DMA line ($152) defines important near-term support to watch.
>>> FEATURED STOCK ARTICLE : Peched at All-Time High With Earnings News Due - 2/5/2024 | View all notes | Set NEW NOTE alert | Company Profile | SEC News | Chart | Request a new note C A S I | KOF - NYSE
Coca-Cola Femsa ADR
Beverages-Non-Alcoholic | $100.70 | +0.41
0.41% | $100.97 | 127,834
80.91% of 50 DAV
50 DAV is 158,000 | $104.38
-3.53%
| 1/12/2024 | $93.38 | PP = $99.34 | | MB = $104.31 | Most Recent Note - 2/21/2024 5:20:45 PM
Y - Held its ground today following a "negative reversal" at its all-time high on the prior session. Due to report Dec ''23 quarterly results on 2/22/24. Volume and volatility often increase near earnings news. Its 50 DMA line ($94.41) defines important near-term support to watch on pullbacks. See the latest FSU analysis for more details and a new annotated graph.
>>> FEATURED STOCK ARTICLE : Perched at High With Earnings News Due - 2/21/2024 | View all notes | Set NEW NOTE alert | Company Profile | SEC News | Chart | Request a new note C A S I | Symbol/Exchange
Company Name
Industry Group | PRICE | CHANGE
(%Change) | Day High | Volume
(% DAV)
(% 50 day avg vol) | 52 Wk Hi
% From Hi | Featured
Date | Price
Featured | Pivot Featured | | Max Buy | PCAR - NASDAQ
Paccar
Trucks and Parts-Hvy Duty | $108.67 | +1.26
1.17% | $108.71 | 1,467,489
64.28% of 50 DAV
50 DAV is 2,283,000 | $108.67
0.00%
| 1/23/2024 | $100.35 | PP = $98.57 | | MB = $103.50 | Most Recent Note - 2/20/2024 7:10:03 PM
G - Hovering near its all-time high, extended from any sound base. Reported Dec '23 quarterly earnings +53% on +11% sales revenues versus the year-ago period, its 9th quarterly comparison with better than the +25% minimum earnings guideline (C criteria). There was a downturn in FY' 20 annual earnings (A criteria) like many companies during the pandemic.
>>> FEATURED STOCK ARTICLE : Volume-Driven Breakout for Paccar - 1/23/2024 | View all notes | Set NEW NOTE alert | Company Profile | SEC News | Chart | Request a new note C A S I | HUBB - NYSE
Hubbell
Electrical-Power/Equipmt | $354.15 | -1.20
-0.34% | $355.26 | 349,012
89.72% of 50 DAV
50 DAV is 389,000 | $364.76
-2.91%
| 1/30/2024 | $343.26 | PP = $336.83 | | MB = $353.67 | Most Recent Note - 2/15/2024 8:55:24 PM
G - Volume totals have been cooling while hovering near its all-time high, extended from the previously noted base. Prior high ($340) defines initial support to watch on pullbacks.
>>> FEATURED STOCK ARTICLE : Volume Heavy Behind Breakout Gain for Hubbell - 1/30/2024 | View all notes | Set NEW NOTE alert | Company Profile | SEC News | Chart | Request a new note C A S I | MANH - NASDAQ
Manhattan Associates
Computer Sftwr-Enterprse | $241.58 | -1.30
-0.54% | $241.90 | 298,505
73.16% of 50 DAV
50 DAV is 408,000 | $258.91
-6.69%
| 1/31/2024 | $240.57 | PP = $230.71 | | MB = $242.25 | Most Recent Note - 2/20/2024 7:07:52 PM
G - Pulling back from its all-time high with light volume behind today''s 3rd consecutive loss. Prior highs in the $230 area define near-term support to watch on pullbacks.
>>> FEATURED STOCK ARTICLE : Big Volume Behind Breakout Gain - 1/31/2024 | View all notes | Set NEW NOTE alert | Company Profile | SEC News | Chart | Request a new note C A S I | TENB - NASDAQ
Tenable Holdings
Computer Sftwr-Security | $46.65 | -3.39
-6.77% | $47.43 | 2,014,361
200.63% of 50 DAV
50 DAV is 1,004,000 | $53.50
-12.80%
| 2/7/2024 | $49.50 | PP = $49.87 | | MB = $52.36 | Most Recent Note - 2/21/2024 12:52:23 PM
G - Gapped down today and violated its 50 DMA line with a volume-driven loss triggering a technical sell signal and its color code is changed to green. A prompt rebound above the 50 DMA line ($46.67) is needed for its outlook to improve. Fundamentals remain strong.
>>> FEATURED STOCK ARTICLE : Gap Up Gain Followed Latest Earnings Report - 2/7/2024 | View all notes | Set NEW NOTE alert | Company Profile | SEC News | Chart | Request a new note C A S I | USLM - NASDAQ
U.S. Lime & Minerals
Bldg-Cement/Concrt/Ag | $245.11 | -4.92
-1.97% | $247.98 | 7,968
44.27% of 50 DAV
50 DAV is 18,000 | $266.88
-8.16%
| 2/9/2024 | $254.68 | PP = $265.09 | | MB = $278.34 | Most Recent Note - 2/20/2024 7:04:04 PM
Y - Retreating from its all-time high with today''s loss on average volume. Finished strong and managed a best-ever close after highlighted in yellow in the 2/09/24 mid-day report with pivot point cited based on its 1/24/24 high plus 10 cents. Subsequent gains and a close above the pivot point backed by at least +40% above average volume may trigger a conviciing new technical buy signal. Through Dec '23 its quarterly and annual earnings (C and A criteria) history has been strong, a good match with the fact-based investment system's guidelines. Thinly traded firm has only 5.7 million shares outstanding (S criteria), which can contribute to greater price volatility in the event of institutional buying or selling.
>>> FEATURED STOCK ARTICLE : Strong Finish for Thinly Traded U.S Lime & Minerals - 2/9/2024 | View all notes | Set NEW NOTE alert | Company Profile | SEC News | Chart | Request a new note C A S I | Symbol/Exchange
Company Name
Industry Group | PRICE | CHANGE
(%Change) | Day High | Volume
(% DAV)
(% 50 day avg vol) | 52 Wk Hi
% From Hi | Featured
Date | Price
Featured | Pivot Featured | | Max Buy |
|
|
|
Color Codes Explained :
Y - Better candidates highlighted by our
staff of experts.
G - Previously featured
in past reports as yellow but may no longer be buyable under the
guidelines.
***Last / Change / Volume data in this table is the closing quote data***
Symbol/Exchange
Company Name
Industry Group |
PRICE |
CHANGE
(%Change) |
Day High |
Volume
(% DAV)
(% 50 day avg vol) |
52 Wk Hi
% From Hi |
Featured
Date |
Price
Featured |
Pivot Featured |
|
Max Buy |
 ANET
-
NYSE
ANET
-
NYSE
Arista Networks
Computer-Networking
|
$259.61
|
-2.14
-0.82% |
$260.41
|
2,715,769
127.68% of 50 DAV
50 DAV is 2,127,000
|
$292.66
-11.29%
|
10/31/2023
|
$188.84
|
PP = $198.80
|
|
MB = $208.74
|
 Most Recent Note - 2/20/2024 7:05:15 PM
G - Gapped down today. Still extended from any sound base. Its 50 DMA line ($250.82) defines important near-term support to watch on pullbacks.
>>> FEATURED STOCK ARTICLE : Pulled Back From All Time High With Gap Down on Prior Session - 2/1/2024 |
View all notes |
Set NEW NOTE alert |
Company Profile |
SEC
News |
Chart |
Request a new note
C
A
S
I |
NVO
-
NYSE
Novo Nordisk ADR
Medical-Ethical Drugs
|
$121.45
|
-2.56
-2.06% |
$124.76
|
5,066,294
111.08% of 50 DAV
50 DAV is 4,561,000
|
$124.64
-2.56%
|
11/2/2023
|
$100.97
|
PP = $104.10
|
|
MB = $109.31
|
Most Recent Note - 2/16/2024 1:04:42 PM
G - extended from any sound base and hitting yet another new all-time high with today's gain. Its 50 DMA line ($107.53) defines important near-term support to watch on pullbacks.
>>> FEATURED STOCK ARTICLE : Extended From Any Sound Base After Volume-Driven Gains - 2/8/2024 |
View all notes |
Set NEW NOTE alert |
Company Profile |
SEC
News |
Chart |
Request a new note
C
A
S
I |
AXON
-
NASDAQ
Axon Enterprise
Security/Sfty
|
$267.70
|
-2.10
-0.78% |
$269.16
|
296,082
80.24% of 50 DAV
50 DAV is 369,000
|
$274.78
-2.58%
|
11/8/2023
|
$127.84
|
PP = $223.30
|
|
MB = $234.47
|
Most Recent Note - 2/20/2024 7:06:12 PM
G - Hovering near its all-time high. Prior highs in the $260-262 area define initial support to watch above its 50-day moving average (DMA) line ($254.91).
>>> FEATURED STOCK ARTICLE : Reversal at All-Time High After 7 Consecutive Gains - 2/12/2024 |
View all notes |
Set NEW NOTE alert |
Company Profile |
SEC
News |
Chart |
Request a new note
C
A
S
I |
TDG
-
NYSE
TransDigm Group
Aerospace/Defense
|
$1,159.01
|
+12.62
1.10% |
$1,163.48
|
226,974
107.57% of 50 DAV
50 DAV is 211,000
|
$1,165.00
-0.51%
|
12/12/2023
|
$1,000.39
|
PP = $1,013.18
|
|
MB = $1,063.84
|
Most Recent Note - 2/14/2024 8:17:51 PM
G - Managed a best-ever close today perched near its all-time high. Its 50 DMA line ($1,038) defines near-term support to watch above prior highs in the $1,013-1,015 area. See the latest FSU analysis for more details and a new annotated graph.
>>> FEATURED STOCK ARTICLE : Transdigm Perched Near All-Time High - 2/14/2024 |
View all notes |
Set NEW NOTE alert |
Company Profile |
SEC
News |
Chart |
Request a new note
C
A
S
I |
PANW
-
NASDAQ
Palo Alto Networks
Computer Sftwr-Security
|
$366.09
|
-0.32
-0.09% |
$369.29
|
9,612,063
279.42% of 50 DAV
50 DAV is 3,440,000
|
$380.84
-3.87%
|
1/10/2024
|
$313.65
|
PP = $318.00
|
|
MB = $333.90
|
Most Recent Note - 2/20/2024 7:09:28 PM
G - Volume was above average behind today's small loss, retreating from its all-time high. Very extended from any sound base. Its 50 DMA line ($325.69) and prior high ($318) define important support to watch.
>>> FEATURED STOCK ARTICLE : Paused After 6 Gains to a New All-Time High - 1/17/2024 |
View all notes |
Set NEW NOTE alert |
Company Profile |
SEC
News |
Chart |
Request a new note
C
A
S
I |
Symbol/Exchange
Company Name
Industry Group |
PRICE |
CHANGE
(%Change) |
Day High |
Volume
(% DAV)
(% 50 day avg vol) |
52 Wk Hi
% From Hi |
Featured
Date |
Price
Featured |
Pivot Featured |
|
Max Buy |
TBBK
-
NASDAQ
The Bancorp
Banks-Northeast
|
$43.58
|
-0.47
-1.07% |
$44.40
|
273,477
57.33% of 50 DAV
50 DAV is 477,000
|
$47.11
-7.49%
|
1/22/2024
|
$40.87
|
PP = $42.56
|
|
MB = $44.69
|
Most Recent Note - 2/16/2024 1:06:20 PM
Y - Consolidating well above prior highs in the $42 area and its 50 DMA liner which define near-term support to watch. Fundamentals remain strong.
>>> FEATURED STOCK ARTICLE : Volume-Driven Breakout Triggered Buy Signal After Earnings Report - 1/26/2024 |
View all notes |
Set NEW NOTE alert |
Company Profile |
SEC
News |
Chart |
Request a new note
C
A
S
I |
LULU
-
NASDAQ
lululemon athletica
Retail-Apparel/Shoes/Acc
|
$444.60
|
-5.00
-1.11% |
$449.60
|
1,184,803
80.43% of 50 DAV
50 DAV is 1,473,000
|
$516.39
-13.90%
|
12/8/2023
|
$490.61
|
PP = $485.93
|
|
MB = $510.23
|
Most Recent Note - 2/15/2024 9:00:12 PM
G - Volume was below average today while it is still lingering below its 50 DMA line ($482) which may act as resistance. A rebound above the 50 DMA line is needed to help its outlook improve.
>>> FEATURED STOCK ARTICLE : Violation of 50-Day Moving Average Hurt Outlook - 2/2/2024 |
View all notes |
Set NEW NOTE alert |
Company Profile |
SEC
News |
Chart |
Request a new note
C
A
S
I |
CRWD
-
NASDAQ
CrowdStrike Holdings
Computer Sftwr-Security
|
$323.71
|
-5.53
-1.68% |
$327.00
|
4,056,105
133.73% of 50 DAV
50 DAV is 3,033,000
|
$338.45
-4.36%
|
1/2/2024
|
$246.42
|
PP = $261.91
|
|
MB = $275.01
|
Most Recent Note - 2/20/2024 7:07:05 PM
G - Pulled back from its all-time high with today's 3rd consecutive loss. Its 50 DMA line ($281.50) defines near-term support to watch. Fundamentals remain strong.
>>> FEATURED STOCK ARTICLE : Volume Totals Cooking While Stubbornly Perched at All-Time High - 2/6/2024 |
View all notes |
Set NEW NOTE alert |
Company Profile |
SEC
News |
Chart |
Request a new note
C
A
S
I |
ELF
-
NYSE
e.l.f. Beauty
Cosmetics/Personal Care
|
$171.37
|
-2.61
-1.50% |
$175.13
|
957,486
65.05% of 50 DAV
50 DAV is 1,472,000
|
$179.58
-4.57%
|
1/2/2024
|
$138.23
|
PP = $153.63
|
|
MB = $161.31
|
Most Recent Note - 2/15/2024 8:53:48 PM
G - Posted a gain today with near average volume for a best-ever close. Reported Dec '23 quarterly earnings +54% on +85% sales revenues versus the year-ago period, continuing its strong earnings track record. Its 50 DMA line ($152) defines important near-term support to watch.
>>> FEATURED STOCK ARTICLE : Peched at All-Time High With Earnings News Due - 2/5/2024 |
View all notes |
Set NEW NOTE alert |
Company Profile |
SEC
News |
Chart |
Request a new note
C
A
S
I |
KOF
-
NYSE
Coca-Cola Femsa ADR
Beverages-Non-Alcoholic
|
$100.29
|
-0.46
-0.46% |
$104.38
|
210,605
135.87% of 50 DAV
50 DAV is 155,000
|
$102.94
-2.57%
|
1/12/2024
|
$93.38
|
PP = $99.34
|
|
MB = $104.31
|
Most Recent Note - 2/15/2024 8:58:13 PM
Y - Posted a 2nd consecutive gain with average volume for its second-best ever close. Its 50 DMA line ($93.66) defines important near-term support to watch on pullbacks. A valid secondary buy point was noted up to +5% above the 12/19/23 high since finding support at its 10 WMA line after an earlier breakout. Its Relative Strength Rating is currently 84, above the 80+ minimum guideline for buy candidates.
>>> FEATURED STOCK ARTICLE : Secondary Buy Point Noted After Finding Support - 1/12/2024 |
View all notes |
Set NEW NOTE alert |
Company Profile |
SEC
News |
Chart |
Request a new note
C
A
S
I |
Symbol/Exchange
Company Name
Industry Group |
PRICE |
CHANGE
(%Change) |
Day High |
Volume
(% DAV)
(% 50 day avg vol) |
52 Wk Hi
% From Hi |
Featured
Date |
Price
Featured |
Pivot Featured |
|
Max Buy |
PCAR
-
NASDAQ
Paccar
Trucks and Parts-Hvy Duty
|
$107.41
|
-0.36
-0.33% |
$108.29
|
2,322,889
101.79% of 50 DAV
50 DAV is 2,282,000
|
$108.67
-1.16%
|
1/23/2024
|
$100.35
|
PP = $98.57
|
|
MB = $103.50
|
Most Recent Note - 2/20/2024 7:10:03 PM
G - Hovering near its all-time high, extended from any sound base. Reported Dec '23 quarterly earnings +53% on +11% sales revenues versus the year-ago period, its 9th quarterly comparison with better than the +25% minimum earnings guideline (C criteria). There was a downturn in FY' 20 annual earnings (A criteria) like many companies during the pandemic.
>>> FEATURED STOCK ARTICLE : Volume-Driven Breakout for Paccar - 1/23/2024 |
View all notes |
Set NEW NOTE alert |
Company Profile |
SEC
News |
Chart |
Request a new note
C
A
S
I |
HUBB
-
NYSE
Hubbell
Electrical-Power/Equipmt
|
$355.35
|
-3.53
-0.98% |
$358.43
|
341,304
87.96% of 50 DAV
50 DAV is 388,000
|
$364.76
-2.58%
|
1/30/2024
|
$343.26
|
PP = $336.83
|
|
MB = $353.67
|
Most Recent Note - 2/15/2024 8:55:24 PM
G - Volume totals have been cooling while hovering near its all-time high, extended from the previously noted base. Prior high ($340) defines initial support to watch on pullbacks.
>>> FEATURED STOCK ARTICLE : Volume Heavy Behind Breakout Gain for Hubbell - 1/30/2024 |
View all notes |
Set NEW NOTE alert |
Company Profile |
SEC
News |
Chart |
Request a new note
C
A
S
I |
MANH
-
NASDAQ
Manhattan Associates
Computer Sftwr-Enterprse
|
$242.88
|
-0.93
-0.38% |
$244.08
|
251,889
61.14% of 50 DAV
50 DAV is 412,000
|
$258.91
-6.19%
|
1/31/2024
|
$240.57
|
PP = $230.71
|
|
MB = $242.25
|
Most Recent Note - 2/20/2024 7:07:52 PM
G - Pulling back from its all-time high with light volume behind today's 3rd consecutive loss. Prior highs in the $230 area define near-term support to watch on pullbacks.
>>> FEATURED STOCK ARTICLE : Big Volume Behind Breakout Gain - 1/31/2024 |
View all notes |
Set NEW NOTE alert |
Company Profile |
SEC
News |
Chart |
Request a new note
C
A
S
I |
TENB
-
NASDAQ
Tenable Holdings
Computer Sftwr-Security
|
$50.04
|
-1.01
-1.98% |
$50.58
|
860,844
86.17% of 50 DAV
50 DAV is 999,000
|
$53.50
-6.47%
|
2/7/2024
|
$49.50
|
PP = $49.87
|
|
MB = $52.36
|
Most Recent Note - 2/16/2024 1:08:29 PM
Y - Volume-totals have been cooling while hovering near its all-time high yet below its "max buy" level. Bullish action came after it reported earnings for the Dec '23 quarter +108% on +16% sales revenues versus the year-ago period. Prior highs in the $49 area define initial support to watch on pullbacks. Fundamentals remain strong.
>>> FEATURED STOCK ARTICLE : Gap Up Gain Followed Latest Earnings Report - 2/7/2024 |
View all notes |
Set NEW NOTE alert |
Company Profile |
SEC
News |
Chart |
Request a new note
C
A
S
I |
USLM
-
NASDAQ
U.S. Lime & Minerals
Bldg-Cement/Concrt/Ag
|
$250.03
|
-6.63
-2.58% |
$256.99
|
20,042
111.34% of 50 DAV
50 DAV is 18,000
|
$266.88
-6.31%
|
2/9/2024
|
$254.68
|
PP = $265.09
|
|
MB = $278.34
|
Most Recent Note - 2/20/2024 7:04:04 PM
Y - Retreating from its all-time high with today's loss on average volume. Finished strong and managed a best-ever close after highlighted in yellow in the 2/09/24 mid-day report with pivot point cited based on its 1/24/24 high plus 10 cents. Subsequent gains and a close above the pivot point backed by at least +40% above average volume may trigger a conviciing new technical buy signal. Through Dec '23 its quarterly and annual earnings (C and A criteria) history has been strong, a good match with the fact-based investment system's guidelines. Thinly traded firm has only 5.7 million shares outstanding (S criteria), which can contribute to greater price volatility in the event of institutional buying or selling.
>>> FEATURED STOCK ARTICLE : Strong Finish for Thinly Traded U.S Lime & Minerals - 2/9/2024 |
View all notes |
Set NEW NOTE alert |
Company Profile |
SEC
News |
Chart |
Request a new note
C
A
S
I |
Symbol/Exchange
Company Name
Industry Group |
PRICE |
CHANGE
(%Change) |
Day High |
Volume
(% DAV)
(% 50 day avg vol) |
52 Wk Hi
% From Hi |
Featured
Date |
Price
Featured |
Pivot Featured |
|
Max Buy |
|
|
|
THESE ARE NOT BUY RECOMMENDATIONS!
Comments contained in the body of this report are technical
opinions only. The material herein has been obtained
from sources believed to be reliable and accurate, however,
its accuracy and completeness cannot be guaranteed.
This site is not an investment advisor, hence it does
not endorse or recommend any securities or other investments.
Any recommendation contained in this report may not
be suitable for all investors and it is not to be deemed
an offer or solicitation on our part with respect to
the purchase or sale of any securities. All trademarks,
service marks and trade names appearing in this report
are the property of their respective owners, and are
likewise used for identification purposes only.
This report is a service available
only to active Paid Premium Members.
You may opt-out of receiving report notifications
at any time. Questions or comments may be submitted
by writing to Premium Membership Services 665 S.E. 10 Street, Suite 201 Deerfield Beach, FL 33441-5634 or by calling 1-800-965-8307
or 954-785-1121.
|
|
|