You are not logged in.
This means you
CAN ONLY VIEW reports that were published prior to Saturday, March 22, 2025.
You
MUST UPGRADE YOUR MEMBERSHIP if you want to see any current reports.
AFTER MARKET UPDATE - FRIDAY, FEBRUARY 9TH, 2024
Previous After Market Report Next After Market Report >>>
|
|
|
|
DOW |
-54.64 |
38,671.69 |
-0.14% |
|
Volume |
897,510,039 |
-5% |
|
Volume |
5,851,992,500 |
+1% |
|
NASDAQ |
+196.95 |
15,990.66 |
+1.25% |
|
Advancers |
1,833 |
67% |
|
Advancers |
2,922 |
69% |
|
S&P 500 |
+28.70 |
5,026.61 |
+0.57% |
|
Decliners |
911 |
33% |
|
Decliners |
1,327 |
31% |
|
Russell 2000 |
+30.29 |
2,009.99 |
+1.53% |
|
52 Wk Highs |
174 |
|
|
52 Wk Highs |
299 |
|
|
S&P 600 |
+14.38 |
1,288.34 |
+1.13% |
|
52 Wk Lows |
16 |
|
|
52 Wk Lows |
87 |
|
|
 |
Leadership Expands as Major Indices Post 14th Gain in 15 Week Span
Kenneth J. Gruneisen - Passed the CAN SLIM® Master's Exam
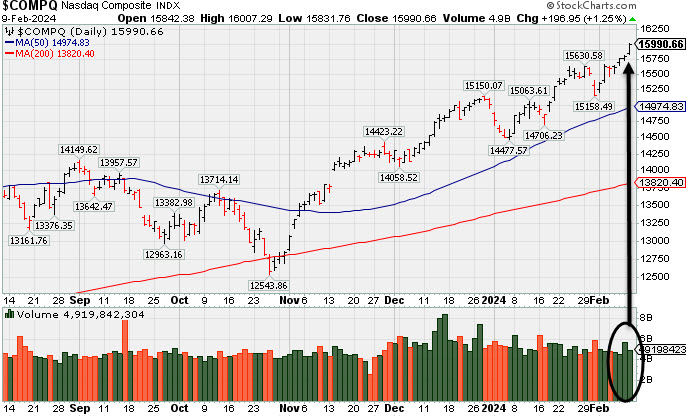
The S&P 500 rose +0.57% on Friday and closed above 5,000 for the first time. The Nasdaq Composite climbed +1.3% and the Russell 2000 rose +1.5% gain. Meanwhile, the Dow Jones Industrial Average ended a slight bit (-0.14%) lower. Volume was reported mixed, lighter than the prior session total on the NYSE and higher on the Nasdaq exchange. Advancers led decliners by a 2-1 margin on the NYSE and by more than a 2-1 margin on the Nasdaq exchange. Leadership improved as there were 128 high-ranked companies from the Leaders List that hit new 52-week highs and were listed on the BreakOuts Page, versus the total of 99 on the prior session. New 52-week highs totals expanded and outnumbered shrinking new 52-week lows totals on the NYSE and on the Nasdaq exchange. The major indices are in a confirmed uptrend (M criteria). New buying efforts should be only made in stocks fitting all key criteria of the fact-based investment system.
PICTURED: The Nasdaq Composite Index posted a 4th consecutive gain and finished just -1.4% off its November 2021 all-time high. All 3 major indices have posted gains in 14 of the past 15 weeks.
New geopolitical worries rose after The Wall Street Journal reported that Venezuela deployed its military to Guyana's border a day after indicating that a "forceful" response would be warranted if Exxon Mobil (XOM -2.12%) proceeds with plans to drill in a disputed region offshore Guyana. Natural gas prices ($1.85, -0.07, -3.7%) sank as prices were down -11% for the week.
Eight of the 11 S&P 500 sectors closed higher, led by the information technology (+1.5%), consumer discretionary (+1.0%), and communication services (+0.7%) sectors. The energy sector (-1.6%) saw the largest decline. The consumer staples sector fell -0.9% partly because PepsiCo (PEP -3.55%) fell after reporting earnings.
The 2-yr note yield settled at 4.50% and the 10-yr note yield settled at 4.19%. Monday markes the release of the January Treasury Budget (prior -$129.0 bln) at 2:00 ET. There still has not been any concerted selling interest despite countless reports that the market is overbought in the short-term.
|
 Kenneth J. Gruneisen started out as a licensed stockbroker in August 1987, a couple of months prior to the historic stock market crash that took the Dow Jones Industrial Average down -22.6% in a single day. He has published daily fact-based fundamental and technical analysis on high-ranked stocks online for two decades. Through FACTBASEDINVESTING.COM, Kenneth provides educational articles, news, market commentary, and other information regarding proven investment systems that work in good times and bad.
Comments contained in the body of this report are technical opinions only and are not necessarily those of Gruneisen Growth Corp. The material herein has been obtained from sources believed to be reliable and accurate, however, its accuracy and completeness cannot be guaranteed. Our firm, employees, and customers may effect transactions, including transactions contrary to any recommendation herein, or have positions in the securities mentioned herein or options with respect thereto. Any recommendation contained in this report may not be suitable for all investors and it is not to be deemed an offer or solicitation on our part with respect to the purchase or sale of any securities. |
|
 |
Retail, Broker/Dealer, and Semiconductor Indexes Led Gainers
Kenneth J. Gruneisen - Passed the CAN SLIM® Master's Exam
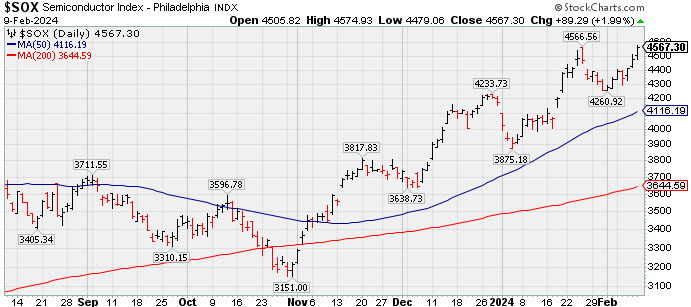
The Retail Index ($RLX +1.78%) and Broker/Dealer Index ($XBD +1.42%) both posted solid gains while the Bank Index ($BKX +0.24%) also edged higher. The tech sector was led by the Semiconductor Index ($SOX +1.99%) and the Networking Index ($NWX +0.54%) edged higher while the Biotech Index ($BTK -0.10%) finished slightl in the red. Commodity-linked groups had a negative bias as the Gold & Silver Index ($XAU -1.08%), Oil Services Index ($OSX -0.98%), and the Integrated Oil Index ($XOI -0.99%) suffered unanimous losses.
![]() PICTURED: The Semiconductor Index ($SOX +1.99%) posted 3rd consecutive solid gain and hit a new all-time high.
| Oil Services |
$OSX |
78.85 |
-0.78 |
-0.98% |
-6.00% |
| Integrated Oil |
$XOI |
1,875.25 |
-18.81 |
-0.99% |
+0.69% |
| Semiconductor |
$SOX |
4,567.30 |
+89.29 |
+1.99% |
+9.38% |
| Networking |
$NWX |
832.72 |
+5.30 |
+0.64% |
-0.01% |
| Broker/Dealer |
$XBD |
551.50 |
+7.73 |
+1.42% |
-1.04% |
| Retail |
$RLX |
4,295.24 |
+74.97 |
+1.78% |
+10.45% |
| Gold & Silver |
$XAU |
109.32 |
-1.19 |
-1.08% |
-13.02% |
| Bank |
$BKX |
93.63 |
+0.23 |
+0.24% |
-2.49% |
| Biotech |
$BTK |
5,084.12 |
-4.99 |
-0.10% |
-6.18% |
|
|
|
 |
Strong Finish for Thinly Traded U.S Lime & Minerals
Kenneth J. Gruneisen - Passed the CAN SLIM® Master's Exam
U.S. Lime & Minerals (USLM +$5.84 or +2.30% to $259.99) finished strong for a best-ever close after it was highlighted in yellow in the earlier mid-day report (read here) with pivot point cited based on its 1/24/24 high plus 10 cents. It hovered in a tight range perched near its 52-week high, and appeared to be forming an advanced "3 weeks tight" base. However, its strong finish on Friday led to a +4% weekly gain. A proper "3-weeks tight" base has 3 closes with less than a 2% weekly gain or loss for the last 2 weeks. Subsequent gains above the pivot point backed by at least +40% above average volume may still help trigger a convincing technical buy signal.
It has a highest possible earnings Per Share Rating of 99. It reported Dec '23 quarterly earnings +57% on +13% sales revenues versus the year ago period. Its prior quarterly and annual earnings (C and A criteria) history has been strong, a good match with the fact-based investment system's guidelines.
The thinly traded firm has only 5.7 million shares outstanding (S criteria), which can contribute to greater price volatility in the event of institutional buying or selling. The number of top-rated funds owning its shares rose from 192 in Mar '23 to 217 in Dec '23, a reassuring sign concerning the I criteria. Its current Up/Down Volume Ratio of 1.3 is an unbiased indication its shares have been under accumulation over the past 50 days. |
|
|
Color Codes Explained :
Y - Better candidates highlighted by our
staff of experts.
G - Previously featured
in past reports as yellow but may no longer be buyable under the
guidelines.
***Last / Change / Volume data in this table is the closing quote data***
Symbol/Exchange
Company Name
Industry Group |
PRICE |
CHANGE
(%Change) |
Day High |
Volume
(% DAV)
(% 50 day avg vol) |
52 Wk Hi
% From Hi |
Featured
Date |
Price
Featured |
Pivot Featured |
|
Max Buy |
 ANET
-
NYSE
ANET
-
NYSE
Arista Networks
Computer-Networking
|
$282.45
|
+6.56
2.38% |
$284.82
|
3,135,877
177.67% of 50 DAV
50 DAV is 1,765,000
|
$278.88
1.28%
|
10/31/2023
|
$188.84
|
PP = $198.80
|
|
MB = $208.74
|
 Most Recent Note - 2/9/2024 12:09:01 PM
G - Posting a 3rd consecutive volume-driven gain today hitting yet another new all-time high, extended from any sound base. Its 50 DMA line ($244.57) defines important near-term support to watch on pullbacks.
>>> FEATURED STOCK ARTICLE : Pulled Back From All Time High With Gap Down on Prior Session - 2/1/2024 |
View all notes |
Set NEW NOTE alert |
Company Profile |
SEC
News |
Chart |
Request a new note
C
A
S
I |
NVO
-
NYSE
Novo Nordisk ADR
Medical-Ethical Drugs
|
$121.20
|
+2.81
2.37% |
$121.65
|
5,291,049
121.41% of 50 DAV
50 DAV is 4,358,000
|
$119.67
1.28%
|
11/2/2023
|
$100.97
|
PP = $104.10
|
|
MB = $109.31
|
Most Recent Note - 2/9/2024 6:09:56 PM
G - Gapped up and posted a gain with +21% above average volume for yet another new all-time high. Its 50 DMA line ($105.43) and recent low ($103.38 on 1/23/24) define important near-term support to watch on pullbacks. See the latest FSU analysis for more details and an annotated graph.
>>> FEATURED STOCK ARTICLE : Extended From Any Sound Base After Volume-Driven Gains - 2/8/2024 |
View all notes |
Set NEW NOTE alert |
Company Profile |
SEC
News |
Chart |
Request a new note
C
A
S
I |
AXON
-
NASDAQ
Axon Enterprise
Security/Sfty
|
$271.00
|
+2.00
0.74% |
$271.39
|
247,464
63.45% of 50 DAV
50 DAV is 390,000
|
$270.95
0.02%
|
11/8/2023
|
$127.84
|
PP = $223.30
|
|
MB = $234.47
|
Most Recent Note - 2/7/2024 7:04:14 PM
G - Posted a 5th consecutive gain today backed by above-average volume for a new all-time high. Recently found support above its 50-day moving average (DMA) line ($248.72).
>>> FEATURED STOCK ARTICLE : Consolidating Well Above Near-Term Support - 1/9/2024 |
View all notes |
Set NEW NOTE alert |
Company Profile |
SEC
News |
Chart |
Request a new note
C
A
S
I |
TDG
-
NYSE
TransDigm Group
Aerospace/Defense
|
$1,119.89
|
-8.68
-0.77% |
$1,139.98
|
283,116
137.43% of 50 DAV
50 DAV is 206,000
|
$1,155.24
-3.06%
|
12/12/2023
|
$1,000.39
|
PP = $1,013.18
|
|
MB = $1,063.84
|
Most Recent Note - 2/8/2024 1:00:40 PM
G - Extended from any sound base today's 8th consecutive gain with above-average volume has it hitting yet another new all-time high. Its 50 DMA line ($1,025) defines near-term support to watch above prior highs in the $1,013-1,015 area.
>>> FEATURED STOCK ARTICLE : Inching to New Highs With 6th Consecutive Gain - 1/11/2024 |
View all notes |
Set NEW NOTE alert |
Company Profile |
SEC
News |
Chart |
Request a new note
C
A
S
I |
PANW
-
NASDAQ
Palo Alto Networks
Computer Sftwr-Security
|
$376.90
|
+9.88
2.69% |
$380.84
|
3,491,482
94.11% of 50 DAV
50 DAV is 3,710,000
|
$371.72
1.39%
|
1/10/2024
|
$313.65
|
PP = $318.00
|
|
MB = $333.90
|
Most Recent Note - 2/9/2024 6:02:34 PM
G - Volume was near average behind today's 3rd consecutive gain for a new all-time high, getting very extended from any sound base. Prior high ($318) and its 50 DMA line ($316.46) define important support to watch on pullbacks.
>>> FEATURED STOCK ARTICLE : Paused After 6 Gains to a New All-Time High - 1/17/2024 |
View all notes |
Set NEW NOTE alert |
Company Profile |
SEC
News |
Chart |
Request a new note
C
A
S
I |
Symbol/Exchange
Company Name
Industry Group |
PRICE |
CHANGE
(%Change) |
Day High |
Volume
(% DAV)
(% 50 day avg vol) |
52 Wk Hi
% From Hi |
Featured
Date |
Price
Featured |
Pivot Featured |
|
Max Buy |
URI
-
NYSE
United Rentals
Comml Svcs-Leasing
|
$650.35
|
+3.35
0.52% |
$653.08
|
361,504
50.84% of 50 DAV
50 DAV is 711,000
|
$658.86
-1.29%
|
1/24/2024
|
$576.90
|
PP = $585.60
|
|
MB = $614.88
|
Most Recent Note - 2/6/2024 6:14:10 PM
G - Volume totals cooling while stubbornly holding its ground near its all-time high. Prior high ($585.50) defines initial support to watch. Reported Dec '23 quarterly earnings +16% on +13% sales revenues versus the year-ago period, below the +25% minimum earnings guideline (C criteria) raising fundamental concerns.
>>> FEATURED STOCK ARTICLE : Negative Reversal After New High for United Rentals - 1/24/2024 |
View all notes |
Set NEW NOTE alert |
Company Profile |
SEC
News |
Chart |
Request a new note
C
A
S
I |
TBBK
-
NASDAQ
The Bancorp
Banks-Northeast
|
$43.89
|
+1.26
2.96% |
$44.15
|
516,903
106.14% of 50 DAV
50 DAV is 487,000
|
$47.11
-6.84%
|
1/22/2024
|
$40.87
|
PP = $42.56
|
|
MB = $44.69
|
Most Recent Note - 2/9/2024 6:06:20 PM
Y - Posted a big gain with average volume and closed near the session high. Found support when testing prior highs in the $42 area and its color code was changed to yellow while trading below its "max buy". Fundamentals remain strong.
>>> FEATURED STOCK ARTICLE : Volume-Driven Breakout Triggered Buy Signal After Earnings Report - 1/26/2024 |
View all notes |
Set NEW NOTE alert |
Company Profile |
SEC
News |
Chart |
Request a new note
C
A
S
I |
LULU
-
NASDAQ
lululemon athletica
Retail-Apparel/Shoes/Acc
|
$470.24
|
-2.74
-0.58% |
$471.26
|
1,348,707
85.15% of 50 DAV
50 DAV is 1,584,000
|
$516.39
-8.94%
|
12/8/2023
|
$490.61
|
PP = $485.93
|
|
MB = $510.23
|
Most Recent Note - 2/8/2024 6:31:48 PM
G - Posted a solid gain today with average volume, rebounding toward its 50 DMA line ($481) which may act as resistance. A rebound above the 50 DMA line is needed to help its outlook improve.
>>> FEATURED STOCK ARTICLE : Violation of 50-Day Moving Average Hurt Outlook - 2/2/2024 |
View all notes |
Set NEW NOTE alert |
Company Profile |
SEC
News |
Chart |
Request a new note
C
A
S
I |
CRWD
-
NASDAQ
CrowdStrike Holdings
Computer Sftwr-Security
|
$329.52
|
+6.48
2.01% |
$336.99
|
3,835,967
112.92% of 50 DAV
50 DAV is 3,397,000
|
$323.93
1.73%
|
1/2/2024
|
$246.42
|
PP = $261.91
|
|
MB = $275.01
|
Most Recent Note - 2/9/2024 6:08:17 PM
G - Volume was +14% above average behind today's 3rd consecutive gain for another new all-time high. Its 50 DMA line ($270.69) defines near-term support to watch on pullbacks. Fundamentals remain strong.
>>> FEATURED STOCK ARTICLE : Volume Totals Cooking While Stubbornly Perched at All-Time High - 2/6/2024 |
View all notes |
Set NEW NOTE alert |
Company Profile |
SEC
News |
Chart |
Request a new note
C
A
S
I |
ELF
-
NYSE
e.l.f. Beauty
Cosmetics/Personal Care
|
$174.52
|
+2.98
1.74% |
$175.74
|
1,513,148
102.52% of 50 DAV
50 DAV is 1,476,000
|
$174.65
-0.07%
|
1/2/2024
|
$138.23
|
PP = $153.63
|
|
MB = $161.31
|
Most Recent Note - 2/8/2024 6:30:19 PM
G - Perched near its all-time high today after another big volume-driven gain. Reported Dec '23 quarterly earnings +54% on +85% sales revenues versus the year-ago period, continuing its strong earnings track record. Volume and volatility often increase near earnings news. Its 50 DMA line ($147) defines important near-term support to watch.
>>> FEATURED STOCK ARTICLE : Peched at All-Time High With Earnings News Due - 2/5/2024 |
View all notes |
Set NEW NOTE alert |
Company Profile |
SEC
News |
Chart |
Request a new note
C
A
S
I |
Symbol/Exchange
Company Name
Industry Group |
PRICE |
CHANGE
(%Change) |
Day High |
Volume
(% DAV)
(% 50 day avg vol) |
52 Wk Hi
% From Hi |
Featured
Date |
Price
Featured |
Pivot Featured |
|
Max Buy |
KOF
-
NYSE
Coca-Cola Femsa ADR
Beverages-Non-Alcoholic
|
$97.61
|
-0.11
-0.11% |
$98.37
|
73,492
47.11% of 50 DAV
50 DAV is 156,000
|
$102.94
-5.18%
|
1/12/2024
|
$93.38
|
PP = $99.34
|
|
MB = $104.31
|
Most Recent Note - 2/8/2024 6:40:59 PM
Y - Holding its ground with volume totals cooling after abruptly reversing from its high this week and undercutting its prior high raising concerns. Its 50 DMA line ($92.34) recently acted as support. A valid secondary buy point was noted up to +5% above the 12/19/23 high since finding support at its 10 WMA line after an earlier breakout. Its Relative Strength Rating is currently 82, above the 80+ minimum guideline for buy candidates.
>>> FEATURED STOCK ARTICLE : Secondary Buy Point Noted After Finding Support - 1/12/2024 |
View all notes |
Set NEW NOTE alert |
Company Profile |
SEC
News |
Chart |
Request a new note
C
A
S
I |
PCAR
-
NASDAQ
Paccar
Trucks and Parts-Hvy Duty
|
$106.01
|
+0.40
0.38% |
$106.08
|
1,474,646
62.80% of 50 DAV
50 DAV is 2,348,000
|
$106.23
-0.21%
|
1/23/2024
|
$100.35
|
PP = $98.57
|
|
MB = $103.50
|
Most Recent Note - 2/6/2024 6:05:11 PM
G - Hit a new all-time high with today's 4th consecutive gain and its color code is changed to green after wedging above its "max buy" level. Reported Dec '23 quarterly earnings +53% on +11% sales revenues versus the year-ago period, its 9th quarterly comparison with better than the +25% minimum earnings guideline (C criteria). There was a downturn in FY' 20 annual earnings (A criteria) like many companies during the pandemic.
>>> FEATURED STOCK ARTICLE : Volume-Driven Breakout for Paccar - 1/23/2024 |
View all notes |
Set NEW NOTE alert |
Company Profile |
SEC
News |
Chart |
Request a new note
C
A
S
I |
HUBB
-
NYSE
Hubbell
Electrical-Power/Equipmt
|
$363.01
|
+4.80
1.34% |
$363.36
|
304,431
77.66% of 50 DAV
50 DAV is 392,000
|
$359.04
1.11%
|
1/30/2024
|
$343.26
|
PP = $336.83
|
|
MB = $353.67
|
Most Recent Note - 2/8/2024 6:38:20 PM
G - Hit yet another new all-time high with today's gain backed by below-average volume, wedging above its "max buy" level, and its color code is changed to green. Prior high ($340) defines initial support to watch on pullbacks.
>>> FEATURED STOCK ARTICLE : Volume Heavy Behind Breakout Gain for Hubbell - 1/30/2024 |
View all notes |
Set NEW NOTE alert |
Company Profile |
SEC
News |
Chart |
Request a new note
C
A
S
I |
MANH
-
NASDAQ
Manhattan Associates
Computer Sftwr-Enterprse
|
$250.50
|
+3.48
1.41% |
$250.92
|
313,728
71.96% of 50 DAV
50 DAV is 436,000
|
$258.91
-3.25%
|
1/31/2024
|
$240.57
|
PP = $230.71
|
|
MB = $242.25
|
Most Recent Note - 2/6/2024 6:17:29 PM
G - Color code is changed to green while stubbornly holding its ground above its "max buy" level near its all-time high with volume totals cooling. Prior highs in the $230 area define near-term support to watch on pullbacks.
>>> FEATURED STOCK ARTICLE : Big Volume Behind Breakout Gain - 1/31/2024 |
View all notes |
Set NEW NOTE alert |
Company Profile |
SEC
News |
Chart |
Request a new note
C
A
S
I |
TENB
-
NASDAQ
Tenable Holdings
Computer Sftwr-Security
|
$51.89
|
+1.17
2.31% |
$52.15
|
1,891,018
191.40% of 50 DAV
50 DAV is 988,000
|
$53.50
-3.01%
|
2/7/2024
|
$49.50
|
PP = $49.87
|
|
MB = $52.36
|
Most Recent Note - 2/9/2024 6:12:18 PM
Y - Posted a 4th consecutive volume-driven gain today for a new high close approaching its "max buy" level. Bullish action this week came after it reported earnings for the Dec '23 quarter +108% on +16% sales revenues versus the year-ago period. Prior highs in the $49 area define initial support to watch on pullbacks. Prior quarterly and annual earnings history is a good match with the fact-based investment system's fundamental guidelines.
>>> FEATURED STOCK ARTICLE : Gap Up Gain Followed Latest Earnings Report - 2/7/2024 |
View all notes |
Set NEW NOTE alert |
Company Profile |
SEC
News |
Chart |
Request a new note
C
A
S
I |
Symbol/Exchange
Company Name
Industry Group |
PRICE |
CHANGE
(%Change) |
Day High |
Volume
(% DAV)
(% 50 day avg vol) |
52 Wk Hi
% From Hi |
Featured
Date |
Price
Featured |
Pivot Featured |
|
Max Buy |
USLM
-
NASDAQ
U.S. Lime & Minerals
Bldg-Cement/Concrt/Ag
|
$259.99
|
+5.84
2.30% |
$259.99
|
32,616
191.86% of 50 DAV
50 DAV is 17,000
|
$264.99
-1.89%
|
2/9/2024
|
$254.68
|
PP = $265.09
|
|
MB = $278.34
|
Most Recent Note - 2/9/2024 6:01:11 PM
Y - Finished strong and managed a best-ever close today after highlighted in yellow in the earlier mid-day report with pivot point cited based on its 1/24/24 high plus 10 cents. Subsequent gains above the pivot point backed by at least +40% above average volume may trigger a technical buy signal. Through Dec '23 its quarterly and annual earnings (C and A criteria) history has been strong, a good match with the fact-based investment system's guidelines. Thinly traded firm has only 5.7 million shares outstanding (S criteria), which can contribute to greater price volatility in the event of institutional buying or selling. See the latest FSU analysis for more details and a new annotated graph.
>>> FEATURED STOCK ARTICLE : Strong Finish for Thinly Traded U.S Lime & Minerals - 2/9/2024 |
View all notes |
Set NEW NOTE alert |
Company Profile |
SEC
News |
Chart |
Request a new note
C
A
S
I |
|
|
|
THESE ARE NOT BUY RECOMMENDATIONS!
Comments contained in the body of this report are technical
opinions only. The material herein has been obtained
from sources believed to be reliable and accurate, however,
its accuracy and completeness cannot be guaranteed.
This site is not an investment advisor, hence it does
not endorse or recommend any securities or other investments.
Any recommendation contained in this report may not
be suitable for all investors and it is not to be deemed
an offer or solicitation on our part with respect to
the purchase or sale of any securities. All trademarks,
service marks and trade names appearing in this report
are the property of their respective owners, and are
likewise used for identification purposes only.
This report is a service available
only to active Paid Premium Members.
You may opt-out of receiving report notifications
at any time. Questions or comments may be submitted
by writing to Premium Membership Services 665 S.E. 10 Street, Suite 201 Deerfield Beach, FL 33441-5634 or by calling 1-800-965-8307
or 954-785-1121.
|
|
|