You are not logged in.
This means you
CAN ONLY VIEW reports that were published prior to Monday, March 24, 2025.
You
MUST UPGRADE YOUR MEMBERSHIP if you want to see any current reports.
AFTER MARKET UPDATE - WEDNESDAY, FEBRUARY 14TH, 2024
Previous After Market Report Next After Market Report >>>
|
|
|
|
DOW |
+151.52 |
38,424.27 |
+0.40% |
|
Volume |
924,769,962 |
-7% |
|
Volume |
5,244,666,300 |
-9% |
|
NASDAQ |
+203.55 |
15,859.15 |
+1.30% |
|
Advancers |
2,208 |
81% |
|
Advancers |
3,309 |
77% |
|
S&P 500 |
+47.45 |
5,000.62 |
+0.96% |
|
Decliners |
533 |
19% |
|
Decliners |
978 |
23% |
|
Russell 2000 |
+47.93 |
2,012.10 |
+2.44% |
|
52 Wk Highs |
98 |
|
|
52 Wk Highs |
109 |
|
|
S&P 600 |
+24.70 |
1,289.15 |
+1.95% |
|
52 Wk Lows |
36 |
|
|
52 Wk Lows |
77 |
|
|
 |
Breadth Positive as Indices Rose With Lighter Volume Totals
Kenneth J. Gruneisen - Passed the CAN SLIM® Master's Exam
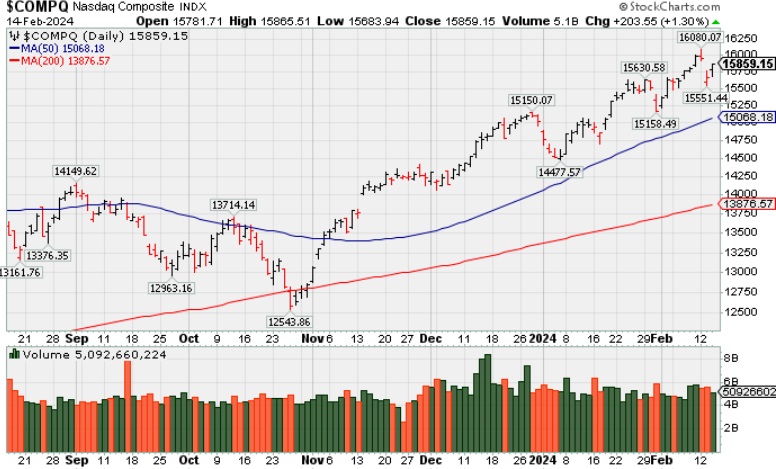
The Russell 2000 outperformed its peers, ultimately closing with a 2.4% gain following yesterday's 4.0% slide. A late afternoon surge in buying left the S&P 500 at 5,000 with a 1.0% gain. Volume was reported below the prior session totals on the NYSE and on the Nasdaq exchange. Advancers led decliners by more than a 4-1 margin on the NYSE and by more than a 3-1 margin on the Nasdaq exchange. There were 59 high-ranked companies from the Leaders List that hit new 52-week highs and were listed on the BreakOuts Page, up from the total of 13 on the prior session. New 52-week highs totals expanded and outnumbered shrinking new 52-week lows totals on the NYSE and on the Nasdaq exchange. The major indices are in a confirmed uptrend (M criteria). New buying efforts should be only made in stocks fitting all key criteria of the fact-based investment system.
PICTURED: The Nasdaq Composite Index posted a gain.
The 2-yr note yield fell nine basis points to 4.58% and the 10-yr note yield declined five basis points to 4.27%. Treasuries reacted to a downward revision in the December PPI to -0.2% from -0.1% that was part of an annual revision to seasonally adjusted indexes.
Nine of the 11 S&P 500 sectors ended higher. The industrial sector was at the top of the leaderboard with a 1.7% gain, propelled by a big move higher in Uber (UBER +14.7%), which announced a $7 billion share buyback program. Rideshare peer Lyft (LYFT +35.1%) reported pleasing earnings and an expectation for its FY24 adjusted EBITDA margin to increase approximately 50 basis points.
Consumer staples (-0.2%) suffered due to a decline in Kraft Heinz (KHC -5.5%). Energy (-0.2%) erased a +1.0% earlier gain, after WTI crude oil futures settled 1.6% lower at $76.64/bbl. |
 Kenneth J. Gruneisen started out as a licensed stockbroker in August 1987, a couple of months prior to the historic stock market crash that took the Dow Jones Industrial Average down -22.6% in a single day. He has published daily fact-based fundamental and technical analysis on high-ranked stocks online for two decades. Through FACTBASEDINVESTING.COM, Kenneth provides educational articles, news, market commentary, and other information regarding proven investment systems that work in good times and bad.
Comments contained in the body of this report are technical opinions only and are not necessarily those of Gruneisen Growth Corp. The material herein has been obtained from sources believed to be reliable and accurate, however, its accuracy and completeness cannot be guaranteed. Our firm, employees, and customers may effect transactions, including transactions contrary to any recommendation herein, or have positions in the securities mentioned herein or options with respect thereto. Any recommendation contained in this report may not be suitable for all investors and it is not to be deemed an offer or solicitation on our part with respect to the purchase or sale of any securities. |
|
 |
Tech, Financial, Retail, and Commodity-Linked Groups Rose
Kenneth J. Gruneisen - Passed the CAN SLIM® Master's Exam
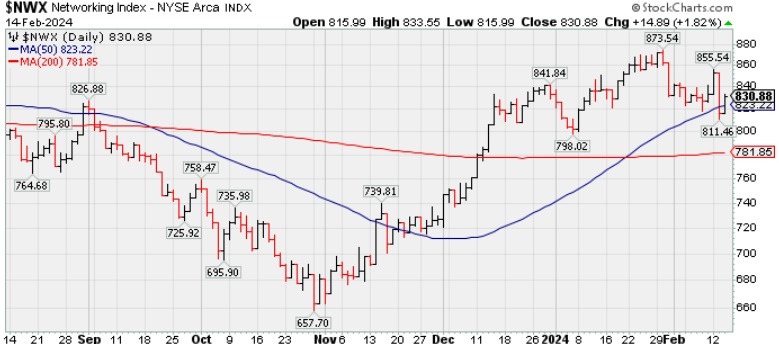
The Broker/Dealer Index ($XBD +1.33%) and the Bank Index ($BKX +1.33%) both posted gains and the Retail Index ($RLX +0.99%) posted a smaller gain. Commodity-linked groups had a slightly positive bias as the Gold & Silver Index ($XAU +0.55%), Oil Services Index ($OSX +0.64%) and Integrated Oil Index ($XOI +0.23%) each edged higher. The tech sector saw unanimous gains from the Networking Index ($NWX +1.82%), Biotech Index ($BTK +1.63%) and the Semiconductor Index ($SOX +2.18%) each gained ground.
![]() PICTURED: The Networking Index ($NWX +1.82%) posted a gain, finding prompt support near its 50-day moving average (DMA) line.
| Oil Services |
$OSX |
78.41 |
+0.50 |
+0.64% |
-6.52% |
| Integrated Oil |
$XOI |
1,889.01 |
+4.41 |
+0.23% |
+1.43% |
| Semiconductor |
$SOX |
4,565.41 |
+97.23 |
+2.18% |
+9.34% |
| Networking |
$NWX |
830.88 |
+14.89 |
+1.82% |
-0.23% |
| Broker/Dealer |
$XBD |
553.46 |
+7.25 |
+1.33% |
-0.69% |
| Retail |
$RLX |
4,236.41 |
+41.52 |
+0.99% |
+8.94% |
| Gold & Silver |
$XAU |
104.27 |
+0.57 |
+0.55% |
-17.04% |
| Bank |
$BKX |
93.53 |
+1.22 |
+1.33% |
-2.60% |
| Biotech |
$BTK |
5,068.14 |
+81.22 |
+1.63% |
-6.47% |
|
|
|
 |
Transdigm Perched Near All-Time High
Kenneth J. Gruneisen - Passed the CAN SLIM® Master's Exam
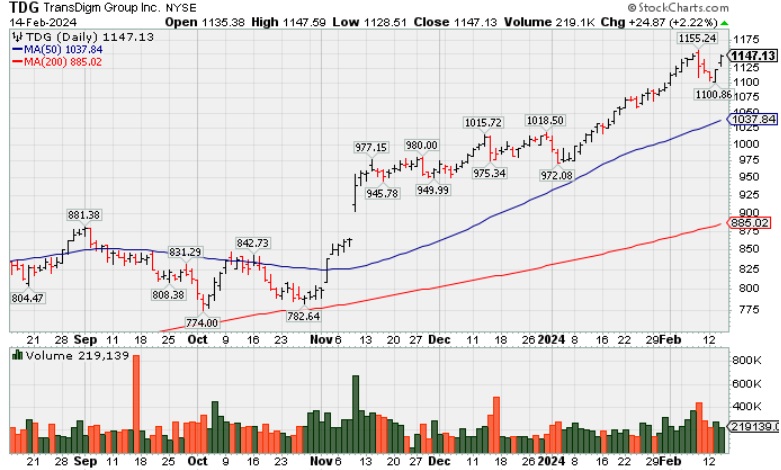
Transdigm Group Inc (TDG +$24.87 or +2.22% to $1,147.13) is extended from any sound base and managed a new high close with today's gain. Its 50-day moving average (DMA) line ($1,038) defines near-term support to watch above prior highs in the $1,013-1,015 area.
TDG was highlighted in yellow in the 11/09/23 mid-day report (read here) with pivot point cited based on its 8/08/23 high plus 10 cents. It was last shown in the FSU section on 1/11/24 in greater detail with an annotated gra
ph under the headline, "Inching to New Highs With 6th Consecutive Gain".
F undamentals remain strong. It reported Dec '23 quarterly earnings +56% on +28% sales revenues versus the year-ago period, its 11th consecutive comparison above the +25% minimum earnings guideline (C criteria). Growth has been very strong after a downturn in FY '20 and '21 (A criteria) hurt its earnings track record. It has an 88 Earnings Per Share Rating.
The number of top-rated funds owning its shares rose from 1,332 in Dec '22 to 1,520 in Dec '23, a reassuring trend concerning the I criteria. Its small supply of 53.1 million shares (S criteria) in the public float can contribute to greater price volatility in the event of institutional buying or selling. It has a Timeliness Rating of A and an Accumulation/Distribution rating of B+.
|
|
|
Color Codes Explained :
Y - Better candidates highlighted by our
staff of experts.
G - Previously featured
in past reports as yellow but may no longer be buyable under the
guidelines.
***Last / Change / Volume data in this table is the closing quote data***
Symbol/Exchange
Company Name
Industry Group |
PRICE |
CHANGE
(%Change) |
Day High |
Volume
(% DAV)
(% 50 day avg vol) |
52 Wk Hi
% From Hi |
Featured
Date |
Price
Featured |
Pivot Featured |
|
Max Buy |
 ANET
-
NYSE
ANET
-
NYSE
Arista Networks
Computer-Networking
|
$265.67
|
+0.16
0.06% |
$271.40
|
3,336,297
162.91% of 50 DAV
50 DAV is 2,048,000
|
$292.66
-9.22%
|
10/31/2023
|
$188.84
|
PP = $198.80
|
|
MB = $208.74
|
Most Recent Note - 2/13/2024 2:39:29 PM
G - Gapped down today following a "negative reversal" at its all-time high after getting very extended from any sound base. Its 50 DMA line ($246.80) defines important near-term support to watch on pullbacks.
>>> FEATURED STOCK ARTICLE : Pulled Back From All Time High With Gap Down on Prior Session - 2/1/2024 |
View all notes |
Set NEW NOTE alert |
Company Profile |
SEC
News |
Chart |
Request a new note
C
A
S
I |
NVO
-
NYSE
Novo Nordisk ADR
Medical-Ethical Drugs
|
$123.29
|
+3.30
2.75% |
$123.34
|
5,671,363
128.08% of 50 DAV
50 DAV is 4,428,000
|
$121.65
1.35%
|
11/2/2023
|
$100.97
|
PP = $104.10
|
|
MB = $109.31
|
Most Recent Note - 2/9/2024 6:09:56 PM
G - Gapped up and posted a gain with +21% above average volume for yet another new all-time high. Its 50 DMA line ($105.43) and recent low ($103.38 on 1/23/24) define important near-term support to watch on pullbacks. See the latest FSU analysis for more details and an annotated graph.
>>> FEATURED STOCK ARTICLE : Extended From Any Sound Base After Volume-Driven Gains - 2/8/2024 |
View all notes |
Set NEW NOTE alert |
Company Profile |
SEC
News |
Chart |
Request a new note
C
A
S
I |
AXON
-
NASDAQ
Axon Enterprise
Security/Sfty
|
$270.64
|
+6.19
2.34% |
$271.42
|
307,653
79.29% of 50 DAV
50 DAV is 388,000
|
$273.54
-1.06%
|
11/8/2023
|
$127.84
|
PP = $223.30
|
|
MB = $234.47
|
Most Recent Note - 2/12/2024 6:55:57 PM
G - After hitting a new all-time high today there was a "negative reversal" following 7 consecutive gains. Prior highs in the $260-262 area define initial support to watch above its 50-day moving average (DMA) line ($248.72). See the latest FSU analysis for more details and new annotated graph.
>>> FEATURED STOCK ARTICLE : Reversal at All-Time High After 7 Consecutive Gains - 2/12/2024 |
View all notes |
Set NEW NOTE alert |
Company Profile |
SEC
News |
Chart |
Request a new note
C
A
S
I |
TDG
-
NYSE
TransDigm Group
Aerospace/Defense
|
$1,147.13
|
+24.87
2.22% |
$1,147.60
|
219,139
105.36% of 50 DAV
50 DAV is 208,000
|
$1,155.24
-0.70%
|
12/12/2023
|
$1,000.39
|
PP = $1,013.18
|
|
MB = $1,063.84
|
 Most Recent Note - 2/14/2024 8:17:51 PM
G - Managed a best-ever close today perched near its all-time high. Its 50 DMA line ($1,038) defines near-term support to watch above prior highs in the $1,013-1,015 area. See the latest FSU analysis for more details and a new annotated graph.
>>> FEATURED STOCK ARTICLE : Transdigm Perched Near All-Time High - 2/14/2024 |
View all notes |
Set NEW NOTE alert |
Company Profile |
SEC
News |
Chart |
Request a new note
C
A
S
I |
PANW
-
NASDAQ
Palo Alto Networks
Computer Sftwr-Security
|
$368.33
|
+0.07
0.02% |
$375.17
|
3,090,095
87.32% of 50 DAV
50 DAV is 3,539,000
|
$380.84
-3.28%
|
1/10/2024
|
$313.65
|
PP = $318.00
|
|
MB = $333.90
|
Most Recent Note - 2/13/2024 2:57:28 PM
G - Volume is above average behind today's loss, retreating from its all-time high. Very extended from any sound base. Prior high ($318) and its 50 DMA line ($319) define important support to watch on pullbacks.
>>> FEATURED STOCK ARTICLE : Paused After 6 Gains to a New All-Time High - 1/17/2024 |
View all notes |
Set NEW NOTE alert |
Company Profile |
SEC
News |
Chart |
Request a new note
C
A
S
I |
Symbol/Exchange
Company Name
Industry Group |
PRICE |
CHANGE
(%Change) |
Day High |
Volume
(% DAV)
(% 50 day avg vol) |
52 Wk Hi
% From Hi |
Featured
Date |
Price
Featured |
Pivot Featured |
|
Max Buy |
URI
-
NYSE
United Rentals
Comml Svcs-Leasing
|
$654.04
|
+17.16
2.69% |
$657.99
|
616,041
87.88% of 50 DAV
50 DAV is 701,000
|
$673.68
-2.92%
|
1/24/2024
|
$576.90
|
PP = $585.60
|
|
MB = $614.88
|
Most Recent Note - 2/13/2024 9:52:01 PM
G - Gapped down today retreating from its all-time high. Prior high ($585.50) defines initial support to watch. Reported Dec '23 quarterly earnings +16% on +13% sales revenues versus the year-ago period, below the +25% minimum earnings guideline (C criteria) raising fundamental concerns.
>>> FEATURED STOCK ARTICLE : Negative Reversal After New High for United Rentals - 1/24/2024 |
View all notes |
Set NEW NOTE alert |
Company Profile |
SEC
News |
Chart |
Request a new note
C
A
S
I |
TBBK
-
NASDAQ
The Bancorp
Banks-Northeast
|
$42.71
|
-0.03
-0.07% |
$43.79
|
304,446
61.75% of 50 DAV
50 DAV is 493,000
|
$47.11
-9.34%
|
1/22/2024
|
$40.87
|
PP = $42.56
|
|
MB = $44.69
|
Most Recent Note - 2/9/2024 6:06:20 PM
Y - Posted a big gain with average volume and closed near the session high. Found support when testing prior highs in the $42 area and its color code was changed to yellow while trading below its "max buy". Fundamentals remain strong.
>>> FEATURED STOCK ARTICLE : Volume-Driven Breakout Triggered Buy Signal After Earnings Report - 1/26/2024 |
View all notes |
Set NEW NOTE alert |
Company Profile |
SEC
News |
Chart |
Request a new note
C
A
S
I |
LULU
-
NASDAQ
lululemon athletica
Retail-Apparel/Shoes/Acc
|
$460.46
|
+4.23
0.93% |
$461.99
|
697,179
44.92% of 50 DAV
50 DAV is 1,552,000
|
$516.39
-10.83%
|
12/8/2023
|
$490.61
|
PP = $485.93
|
|
MB = $510.23
|
Most Recent Note - 2/8/2024 6:31:48 PM
G - Posted a solid gain today with average volume, rebounding toward its 50 DMA line ($481) which may act as resistance. A rebound above the 50 DMA line is needed to help its outlook improve.
>>> FEATURED STOCK ARTICLE : Violation of 50-Day Moving Average Hurt Outlook - 2/2/2024 |
View all notes |
Set NEW NOTE alert |
Company Profile |
SEC
News |
Chart |
Request a new note
C
A
S
I |
CRWD
-
NASDAQ
CrowdStrike Holdings
Computer Sftwr-Security
|
$334.55
|
+12.11
3.76% |
$334.90
|
2,386,617
77.44% of 50 DAV
50 DAV is 3,082,000
|
$336.99
-0.72%
|
1/2/2024
|
$246.42
|
PP = $261.91
|
|
MB = $275.01
|
Most Recent Note - 2/12/2024 7:00:04 PM
G - Very extended from any sound base, it pulled back from its all-time high with average volume behind today's loss after 3 consecutive gains. Its 50 DMA line ($272) defines near-term support to watch. Fundamentals remain strong.
>>> FEATURED STOCK ARTICLE : Volume Totals Cooking While Stubbornly Perched at All-Time High - 2/6/2024 |
View all notes |
Set NEW NOTE alert |
Company Profile |
SEC
News |
Chart |
Request a new note
C
A
S
I |
ELF
-
NYSE
e.l.f. Beauty
Cosmetics/Personal Care
|
$166.78
|
-1.08
-0.64% |
$172.03
|
1,198,664
80.66% of 50 DAV
50 DAV is 1,486,000
|
$179.58
-7.13%
|
1/2/2024
|
$138.23
|
PP = $153.63
|
|
MB = $161.31
|
Most Recent Note - 2/8/2024 6:30:19 PM
G - Perched near its all-time high today after another big volume-driven gain. Reported Dec '23 quarterly earnings +54% on +85% sales revenues versus the year-ago period, continuing its strong earnings track record. Volume and volatility often increase near earnings news. Its 50 DMA line ($147) defines important near-term support to watch.
>>> FEATURED STOCK ARTICLE : Peched at All-Time High With Earnings News Due - 2/5/2024 |
View all notes |
Set NEW NOTE alert |
Company Profile |
SEC
News |
Chart |
Request a new note
C
A
S
I |
Symbol/Exchange
Company Name
Industry Group |
PRICE |
CHANGE
(%Change) |
Day High |
Volume
(% DAV)
(% 50 day avg vol) |
52 Wk Hi
% From Hi |
Featured
Date |
Price
Featured |
Pivot Featured |
|
Max Buy |
KOF
-
NYSE
Coca-Cola Femsa ADR
Beverages-Non-Alcoholic
|
$98.09
|
+1.05
1.08% |
$98.39
|
154,579
101.03% of 50 DAV
50 DAV is 153,000
|
$102.94
-4.71%
|
1/12/2024
|
$93.38
|
PP = $99.34
|
|
MB = $104.31
|
Most Recent Note - 2/8/2024 6:40:59 PM
Y - Holding its ground with volume totals cooling after abruptly reversing from its high this week and undercutting its prior high raising concerns. Its 50 DMA line ($92.34) recently acted as support. A valid secondary buy point was noted up to +5% above the 12/19/23 high since finding support at its 10 WMA line after an earlier breakout. Its Relative Strength Rating is currently 82, above the 80+ minimum guideline for buy candidates.
>>> FEATURED STOCK ARTICLE : Secondary Buy Point Noted After Finding Support - 1/12/2024 |
View all notes |
Set NEW NOTE alert |
Company Profile |
SEC
News |
Chart |
Request a new note
C
A
S
I |
PCAR
-
NASDAQ
Paccar
Trucks and Parts-Hvy Duty
|
$106.67
|
+1.75
1.67% |
$107.17
|
2,048,251
88.36% of 50 DAV
50 DAV is 2,318,000
|
$106.41
0.24%
|
1/23/2024
|
$100.35
|
PP = $98.57
|
|
MB = $103.50
|
Most Recent Note - 2/12/2024 7:06:27 PM
G - Hit a new all-time high with today's 8th consecutive gain, getting extended from any sound base. Reported Dec '23 quarterly earnings +53% on +11% sales revenues versus the year-ago period, its 9th quarterly comparison with better than the +25% minimum earnings guideline (C criteria). There was a downturn in FY' 20 annual earnings (A criteria) like many companies during the pandemic.
>>> FEATURED STOCK ARTICLE : Volume-Driven Breakout for Paccar - 1/23/2024 |
View all notes |
Set NEW NOTE alert |
Company Profile |
SEC
News |
Chart |
Request a new note
C
A
S
I |
HUBB
-
NYSE
Hubbell
Electrical-Power/Equipmt
|
$359.69
|
+7.07
2.00% |
$359.98
|
327,740
84.25% of 50 DAV
50 DAV is 389,000
|
$364.76
-1.39%
|
1/30/2024
|
$343.26
|
PP = $336.83
|
|
MB = $353.67
|
Most Recent Note - 2/8/2024 6:38:20 PM
G - Hit yet another new all-time high with today's gain backed by below-average volume, wedging above its "max buy" level, and its color code is changed to green. Prior high ($340) defines initial support to watch on pullbacks.
>>> FEATURED STOCK ARTICLE : Volume Heavy Behind Breakout Gain for Hubbell - 1/30/2024 |
View all notes |
Set NEW NOTE alert |
Company Profile |
SEC
News |
Chart |
Request a new note
C
A
S
I |
MANH
-
NASDAQ
Manhattan Associates
Computer Sftwr-Enterprse
|
$248.80
|
+3.05
1.24% |
$249.94
|
254,036
61.21% of 50 DAV
50 DAV is 415,000
|
$258.91
-3.90%
|
1/31/2024
|
$240.57
|
PP = $230.71
|
|
MB = $242.25
|
Most Recent Note - 2/12/2024 7:05:13 PM
G - Pulled back from its all-time high with light volume behind today's loss. Prior highs in the $230 area define near-term support to watch on pullbacks.
>>> FEATURED STOCK ARTICLE : Big Volume Behind Breakout Gain - 1/31/2024 |
View all notes |
Set NEW NOTE alert |
Company Profile |
SEC
News |
Chart |
Request a new note
C
A
S
I |
TENB
-
NASDAQ
Tenable Holdings
Computer Sftwr-Security
|
$50.76
|
+1.43
2.90% |
$50.85
|
678,500
66.00% of 50 DAV
50 DAV is 1,028,000
|
$53.50
-5.12%
|
2/7/2024
|
$49.50
|
PP = $49.87
|
|
MB = $52.36
|
Most Recent Note - 2/9/2024 6:12:18 PM
Y - Posted a 4th consecutive volume-driven gain today for a new high close approaching its "max buy" level. Bullish action this week came after it reported earnings for the Dec '23 quarter +108% on +16% sales revenues versus the year-ago period. Prior highs in the $49 area define initial support to watch on pullbacks. Prior quarterly and annual earnings history is a good match with the fact-based investment system's fundamental guidelines.
>>> FEATURED STOCK ARTICLE : Gap Up Gain Followed Latest Earnings Report - 2/7/2024 |
View all notes |
Set NEW NOTE alert |
Company Profile |
SEC
News |
Chart |
Request a new note
C
A
S
I |
Symbol/Exchange
Company Name
Industry Group |
PRICE |
CHANGE
(%Change) |
Day High |
Volume
(% DAV)
(% 50 day avg vol) |
52 Wk Hi
% From Hi |
Featured
Date |
Price
Featured |
Pivot Featured |
|
Max Buy |
USLM
-
NASDAQ
U.S. Lime & Minerals
Bldg-Cement/Concrt/Ag
|
$258.00
|
+3.65
1.44% |
$260.80
|
26,002
144.46% of 50 DAV
50 DAV is 18,000
|
$266.88
-3.33%
|
2/9/2024
|
$254.68
|
PP = $265.09
|
|
MB = $278.34
|
Most Recent Note - 2/13/2024 9:53:28 PM
Y - Gapped down today retreating from its all-time high after 4 consecutive gains. Finished strong and managed a best-ever close after highlighted in yellow in the 2/09/24 mid-day report with pivot point cited based on its 1/24/24 high plus 10 cents. Subsequent gains and a close above the pivot point backed by at least +40% above average volume may trigger a conviciing new technical buy signal. Through Dec '23 its quarterly and annual earnings (C and A criteria) history has been strong, a good match with the fact-based investment system's guidelines. Thinly traded firm has only 5.7 million shares outstanding (S criteria), which can contribute to greater price volatility in the event of institutional buying or selling.
>>> FEATURED STOCK ARTICLE : Strong Finish for Thinly Traded U.S Lime & Minerals - 2/9/2024 |
View all notes |
Set NEW NOTE alert |
Company Profile |
SEC
News |
Chart |
Request a new note
C
A
S
I |
|
|
|
THESE ARE NOT BUY RECOMMENDATIONS!
Comments contained in the body of this report are technical
opinions only. The material herein has been obtained
from sources believed to be reliable and accurate, however,
its accuracy and completeness cannot be guaranteed.
This site is not an investment advisor, hence it does
not endorse or recommend any securities or other investments.
Any recommendation contained in this report may not
be suitable for all investors and it is not to be deemed
an offer or solicitation on our part with respect to
the purchase or sale of any securities. All trademarks,
service marks and trade names appearing in this report
are the property of their respective owners, and are
likewise used for identification purposes only.
This report is a service available
only to active Paid Premium Members.
You may opt-out of receiving report notifications
at any time. Questions or comments may be submitted
by writing to Premium Membership Services 665 S.E. 10 Street, Suite 201 Deerfield Beach, FL 33441-5634 or by calling 1-800-965-8307
or 954-785-1121.
|
|
|