You are not logged in.
This means you
CAN ONLY VIEW reports that were published prior to Friday, April 4, 2025.
You
MUST UPGRADE YOUR MEMBERSHIP if you want to see any current reports.
AFTER MARKET UPDATE - MONDAY, FEBRUARY 5TH, 2024
Previous After Market Report Next After Market Report >>>
|
|
|
|
DOW |
-274.30 |
38,380.12 |
-0.71% |
|
Volume |
953,662,533 |
+197% |
|
Volume |
4,926,563,000 |
+78% |
|
NASDAQ |
-31.28 |
15,597.68 |
-0.20% |
|
Advancers |
485 |
18% |
|
Advancers |
1,206 |
28% |
|
S&P 500 |
-15.80 |
4,942.81 |
-0.32% |
|
Decliners |
2,271 |
82% |
|
Decliners |
3,148 |
72% |
|
Russell 2000 |
-25.49 |
1,937.24 |
-1.30% |
|
52 Wk Highs |
64 |
|
|
52 Wk Highs |
89 |
|
|
S&P 600 |
-20.53 |
1,253.10 |
-1.61% |
|
52 Wk Lows |
78 |
|
|
52 Wk Lows |
211 |
|
|
 |
Leadership Thinned and Major Indices Fell
Kenneth J. Gruneisen - Passed the CAN SLIM® Master's Exam
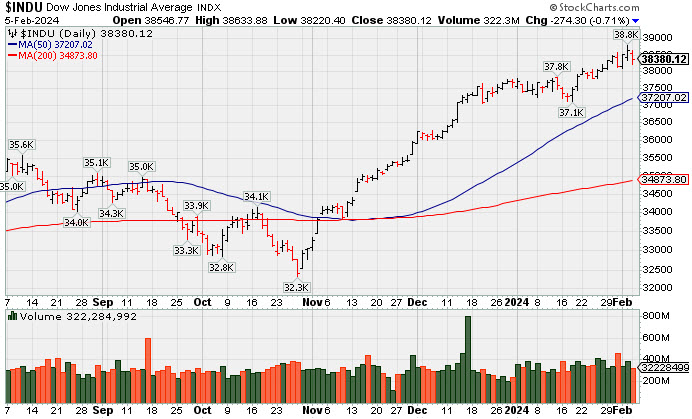
The S&P 500 Index ended with a -0.3% loss, the Nasdaq Composite was down -0.2%, the Dow Jones Industrial Average cloed -0.7% lower, and the Russell 2000 suffered a -1.3% loss. Volume was reported higher than the prior session totals on the NYSE and on the Nasdaq exchange. Breadth was negative as decliners led advancers by more than a 4-1 margin on the NYSE and by a 5-2 margin on the Nasdaq exchange. There were 40 high-ranked companies from the Leaders List that hit new 52-week highs and were listed on the BreakOuts Page versus 79 on the prior session. New 52-week lows totals expanded and outnumbered new highs on the NYSE and on the Nasdaq exchange. The major indices are in a confirmed uptrend (M criteria). New buying efforts should be only made in stocks fitting all key criteria of the fact-based investment system.
PICTURED: The Dow Jones Industrial Average pulled back from Friday's new all-time high.
NVIDIA (NVDA +4.79%) rose after its price target was raised by an analyst at Goldman Sachs. Apple (AAPL +0.98%) and Alphabet (GOOG +0.97%) both posted gains. ON Semiconductor (ON +9.54%) posted a standout gain following positive earnings and guidance. As a consequence, the heavily-weighted S&P 500 information technology sector posted a +0.6% gain. Meanwhile, nine of the sectors fell. Air Products (APD -15.55%) fell following disappointing earnings, making the materials sector (-2.5%) the worst performer.
The January ISM Services PMI featured an acceleration in services sector activity in January, with a pickup in new orders, employment, and prices. The 10-yr note yield settled at 4.16%, 13 basis points higher than Friday. The 2-yr note yield settled at 4.46%.
|
 Kenneth J. Gruneisen started out as a licensed stockbroker in August 1987, a couple of months prior to the historic stock market crash that took the Dow Jones Industrial Average down -22.6% in a single day. He has published daily fact-based fundamental and technical analysis on high-ranked stocks online for two decades. Through FACTBASEDINVESTING.COM, Kenneth provides educational articles, news, market commentary, and other information regarding proven investment systems that work in good times and bad.
Comments contained in the body of this report are technical opinions only and are not necessarily those of Gruneisen Growth Corp. The material herein has been obtained from sources believed to be reliable and accurate, however, its accuracy and completeness cannot be guaranteed. Our firm, employees, and customers may effect transactions, including transactions contrary to any recommendation herein, or have positions in the securities mentioned herein or options with respect thereto. Any recommendation contained in this report may not be suitable for all investors and it is not to be deemed an offer or solicitation on our part with respect to the purchase or sale of any securities. |
|
 |
Finanical, Retail, and Commodity-Linked Groups Led Decliners
Kenneth J. Gruneisen - Passed the CAN SLIM® Master's Exam
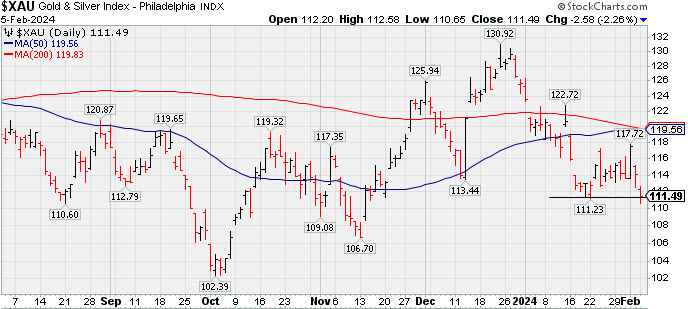
The Broker/Dealer Index ($XBD -1.64) and the Bank Index ($BKX -1.27%) both lost ground and weighed on the major averages. The Retail Index ($RLX -0.81%) posted a smaller loss. The tech sector was mixed as the Semiconductor Index ($SOX +1.18%) rose while the Biotech Index ($BTK -0.15%) was little changed but the Networking Index ($NWX -1.53%) fell. The Gold & Silver Index ($XAU -2.26%) outpaced the Oil Services Index ($OSX -1.04%) to the downside while the Integrated Oil Index ($XOI +0.19%) eked out a tiny gain.
![]() PICTURED: The Gold & Silver Index ($XAU -2.26%) sputtered to a new 2024 low. In recent weeks it has been living below its 50-day and 200-day moving average (DMA) lines.
| Oil Services |
$OSX |
77.19 |
-0.81 |
-1.04% |
-7.97% |
| Integrated Oil |
$XOI |
1,869.49 |
+3.48 |
+0.19% |
+0.38% |
| Semiconductor |
$SOX |
4,388.10 |
+51.37 |
+1.18% |
+5.09% |
| Networking |
$NWX |
826.24 |
-12.85 |
-1.53% |
-0.79% |
| Broker/Dealer |
$XBD |
540.56 |
-9.00 |
-1.64% |
-3.00% |
| Retail |
$RLX |
4,204.79 |
-34.26 |
-0.81% |
+8.13% |
| Gold & Silver |
$XAU |
111.49 |
-2.58 |
-2.26% |
-11.30% |
| Bank |
$BKX |
93.53 |
-1.21 |
-1.27% |
-2.59% |
| Biotech |
$BTK |
5,093.98 |
-7.90 |
-0.15% |
-5.99% |
|
|
|
 |
Peched at All-Time High With Earnings News Due
Kenneth J. Gruneisen - Passed the CAN SLIM® Master's Exam
e.l.f. Beauty (ELF -$0.02 or -0.01% to $169.74) finished flat after churning above average volume and hitting another new all-time high. It is extended from any sound base and rallied +22.8% since featured in the 1/02/24 mid-day report (read here) and in that evening's report under the headline, "Pulled Back After Closing 3 Weeks Tight". Its 50-day moving average (DMA) line ($143.63) defines important near-term support to watch. Keep in mind it is due to report Dec '23 quarterly results after the close on Tuesday, 2/06/24. Volume and volatility often increase near earnings news.
ELF currently has a 98 Earnings Per Share rating. It reported Sep '23 quarterly earnings +128% on +76% sales revenues versus the year-ago period, adding to its streak of very strong quarterly results well above the +25% minimum earnings guideline (C criteria). Annual earnings (A criteria) history over the past 3 years has been strong, making it a better match with the fact-based investment system's fundamental guidelines.
The number of top-rated funds owning its shares rose from 510 in Mar '23 to 752 in Dec '23, a very reassuring sign concerning the I criteria. Its current Up/Down Volume Ratio of 1.4 is an unbiased indication its shares have been under accumulation over the past 50 days. Its small supply (S criteria) of only 55.2 million shares outstanding can contribute to greater price volatility in the event of institutional buying or selling.
|
|
|
Color Codes Explained :
Y - Better candidates highlighted by our
staff of experts.
G - Previously featured
in past reports as yellow but may no longer be buyable under the
guidelines.
***Last / Change / Volume data in this table is the closing quote data***
Symbol/Exchange
Company Name
Industry Group |
PRICE |
CHANGE
(%Change) |
Day High |
Volume
(% DAV)
(% 50 day avg vol) |
52 Wk Hi
% From Hi |
Featured
Date |
Price
Featured |
Pivot Featured |
|
Max Buy |
 ANET
-
NYSE
ANET
-
NYSE
Arista Networks
Computer-Networking
|
$272.97
|
-0.13
-0.05% |
$276.40
|
1,961,723
116.35% of 50 DAV
50 DAV is 1,686,000
|
$276.99
-1.45%
|
10/31/2023
|
$188.84
|
PP = $198.80
|
|
MB = $208.74
|
Most Recent Note - 2/2/2024 1:13:26 PM
G - Gapped up today rallying to a new all-time high. Extended from any sound base, its 50 DMA line ($239) defines near-term support above the prior low ($226.60 on 1/04/24) area. Fundamentals remain strong.
>>> FEATURED STOCK ARTICLE : Pulled Back From All Time High With Gap Down on Prior Session - 2/1/2024 |
View all notes |
Set NEW NOTE alert |
Company Profile |
SEC
News |
Chart |
Request a new note
C
A
S
I |
NVO
-
NYSE
Novo Nordisk ADR
Medical-Ethical Drugs
|
$118.26
|
+4.56
4.01% |
$118.60
|
8,698,036
208.79% of 50 DAV
50 DAV is 4,166,000
|
$116.12
1.84%
|
11/2/2023
|
$100.97
|
PP = $104.10
|
|
MB = $109.31
|
 Most Recent Note - 2/5/2024 12:36:09 PM
G - Gapped up today rallying to another new all-time high, getting extended from any sound base. Its 50 DMA line ($104.18) and recent low ($103.38 on 1/23/24) define important near-term support to watch on pullbacks.
>>> FEATURED STOCK ARTICLE : Gap Up Gain on Prior Session Triggered Technical Buy Signal - 1/5/2024 |
View all notes |
Set NEW NOTE alert |
Company Profile |
SEC
News |
Chart |
Request a new note
C
A
S
I |
QLYS
-
NASDAQ
Qualys
Computer Sftwr-Security
|
$168.08
|
-19.79
-10.53% |
$184.04
|
1,417,323
390.45% of 50 DAV
50 DAV is 363,000
|
$206.35
-18.55%
|
1/24/2024
|
$196.27
|
PP = $206.45
|
|
MB = $216.77
|
Most Recent Note - 2/5/2024 7:16:41 PM
Gapped down today and violated the prior low ($180) with a damaging loss raising greater concerns and triggering a more worrisome technical sell signal. It will be dropped from the Featured Stocks list tonight
>>> FEATURED STOCK ARTICLE : Posted Light Volume Gain Finding Support at 50-Day Moving Average - 1/8/2024 |
View all notes |
Set NEW NOTE alert |
Company Profile |
SEC
News |
Chart |
Request a new note
C
A
S
I |
AXON
-
NASDAQ
Axon Enterprise
Security/Sfty
|
$257.46
|
+0.47
0.18% |
$257.76
|
322,240
85.25% of 50 DAV
50 DAV is 378,000
|
$262.95
-2.09%
|
11/8/2023
|
$127.84
|
PP = $223.30
|
|
MB = $234.47
|
Most Recent Note - 2/2/2024 1:49:12 PM
G - Posting a gain with below-average volume today while finding support above its 50-day moving average (DMA) line ($246.74). The 50 DMA line defines near-term support above prior low ($241.72 on 1/05/24).
>>> FEATURED STOCK ARTICLE : Consolidating Well Above Near-Term Support - 1/9/2024 |
View all notes |
Set NEW NOTE alert |
Company Profile |
SEC
News |
Chart |
Request a new note
C
A
S
I |
TDG
-
NYSE
TransDigm Group
Aerospace/Defense
|
$1,135.08
|
+11.32
1.01% |
$1,139.82
|
230,805
120.84% of 50 DAV
50 DAV is 191,000
|
$1,129.42
0.50%
|
12/12/2023
|
$1,000.39
|
PP = $1,013.18
|
|
MB = $1,063.84
|
Most Recent Note - 1/31/2024 5:49:30 PM
G - Posted a gain today for a new all-time high with above average volume. Prior highs in the $1,013-1,015 area define near-term support to watch on pullbacks.
>>> FEATURED STOCK ARTICLE : Inching to New Highs With 6th Consecutive Gain - 1/11/2024 |
View all notes |
Set NEW NOTE alert |
Company Profile |
SEC
News |
Chart |
Request a new note
C
A
S
I |
Symbol/Exchange
Company Name
Industry Group |
PRICE |
CHANGE
(%Change) |
Day High |
Volume
(% DAV)
(% 50 day avg vol) |
52 Wk Hi
% From Hi |
Featured
Date |
Price
Featured |
Pivot Featured |
|
Max Buy |
PANW
-
NASDAQ
Palo Alto Networks
Computer Sftwr-Security
|
$344.48
|
-0.58
-0.17% |
$345.50
|
2,666,842
73.22% of 50 DAV
50 DAV is 3,642,000
|
$350.60
-1.75%
|
1/10/2024
|
$313.65
|
PP = $318.00
|
|
MB = $333.90
|
Most Recent Note - 1/31/2024 12:47:32 PM
G - Gapped down today yet still perched near its all-time high. Color code is changed to green after recently getting extended beyond the "max buy" level.
>>> FEATURED STOCK ARTICLE : Paused After 6 Gains to a New All-Time High - 1/17/2024 |
View all notes |
Set NEW NOTE alert |
Company Profile |
SEC
News |
Chart |
Request a new note
C
A
S
I |
URI
-
NYSE
United Rentals
Comml Svcs-Leasing
|
$645.57
|
-8.63
-1.32% |
$649.65
|
650,241
92.23% of 50 DAV
50 DAV is 705,000
|
$658.63
-1.98%
|
1/24/2024
|
$576.90
|
PP = $585.60
|
|
MB = $614.88
|
Most Recent Note - 2/1/2024 5:55:07 PM
C - Posted a solid gain today with below-average volume. Prior high ($585.50) defines initial support to watch. Reported Dec '23 quarterly earnings +16% on +13% sales revenues versus the year-ago period, below the +25% minimum earnings guideline (C criteria) raising fundamental concerns.
>>> FEATURED STOCK ARTICLE : Negative Reversal After New High for United Rentals - 1/24/2024 |
View all notes |
Set NEW NOTE alert |
Company Profile |
SEC
News |
Chart |
Request a new note
C
A
S
I |
AMPH
-
NASDAQ
Amphastar Pharm
Medical-Biomed/Biotech
|
$52.33
|
-0.47
-0.89% |
$53.04
|
361,561
76.12% of 50 DAV
50 DAV is 475,000
|
$67.66
-22.66%
|
12/4/2023
|
$60.84
|
PP = $58.35
|
|
MB = $61.27
|
Most Recent Note - 2/5/2024 6:52:08 PM
It will be dropped from the Featured Stocks list tonight. Quietly slumped further below its 50 DMA line toward its 200 DMA line. A rebound above the 50 DMA line ($57.44) is needed for its outlook to improve.
>>> FEATURED STOCK ARTICLE : Quietly Sinking Toward 200-Day Moving Average Line - 1/25/2024 |
View all notes |
Set NEW NOTE alert |
Company Profile |
SEC
News |
Chart |
Request a new note
C
A
S
I |
TBBK
-
NASDAQ
Bancorp Inc
BANKING - Regional - Mid-Atlantic Banks
|
$42.37
|
-0.29
-0.68% |
$42.58
|
493,408
108.42% of 50 DAV
50 DAV is 455,100
|
$47.11
-10.06%
|
1/22/2024
|
$40.87
|
PP = $42.56
|
|
MB = $44.69
|
Most Recent Note - 2/1/2024 5:49:03 PM
G - Pulled back today for a 2nd volume-driven loss. Prior highs in the $42 area define near-term support to watch. Reported Dec '23 quarterly earnings +34% on +16% sales revenues versus the year-ago period. Volume and volatility often increase near earnings news.
>>> FEATURED STOCK ARTICLE : Volume-Driven Breakout Triggered Buy Signal After Earnings Report - 1/26/2024 |
View all notes |
Set NEW NOTE alert |
Company Profile |
SEC
News |
Chart |
Request a new note
C
A
S
I |
LULU
-
NASDAQ
lululemon athletica
Retail-Apparel/Shoes/Acc
|
$456.73
|
-5.67
-1.23% |
$459.05
|
1,165,409
75.58% of 50 DAV
50 DAV is 1,542,000
|
$516.39
-11.55%
|
12/8/2023
|
$490.61
|
PP = $485.93
|
|
MB = $510.23
|
Most Recent Note - 2/5/2024 6:57:11 PM
G - Halted its slide after gapping down on 1/31/24 violating its 50 DMA line ($479) triggering a technical sell signal. A rebound above the 50 DMA line is needed to help its outlook improve.
>>> FEATURED STOCK ARTICLE : Violation of 50-Day Moving Average Hurt Outlook - 2/2/2024 |
View all notes |
Set NEW NOTE alert |
Company Profile |
SEC
News |
Chart |
Request a new note
C
A
S
I |
Symbol/Exchange
Company Name
Industry Group |
PRICE |
CHANGE
(%Change) |
Day High |
Volume
(% DAV)
(% 50 day avg vol) |
52 Wk Hi
% From Hi |
Featured
Date |
Price
Featured |
Pivot Featured |
|
Max Buy |
CRWD
-
NASDAQ
CrowdStrike Holdings
Computer Sftwr-Security
|
$302.49
|
-1.08
-0.36% |
$307.77
|
2,477,579
73.37% of 50 DAV
50 DAV is 3,377,000
|
$307.55
-1.65%
|
1/2/2024
|
$246.42
|
PP = $261.91
|
|
MB = $275.01
|
Most Recent Note - 2/5/2024 6:55:14 PM
G - Volume totals have been cooling while hovering near its all-time high. Its 50 DMA line ($262) and prior high in the $261 area define important near-term support to watch. Fundamentals remain strong.
>>> FEATURED STOCK ARTICLE : CrowdStrike Holdings Pulling Back After "3-Weeks Tight" Pattern - 1/3/2024 |
View all notes |
Set NEW NOTE alert |
Company Profile |
SEC
News |
Chart |
Request a new note
C
A
S
I |
ELF
-
NYSE
e.l.f. Beauty
Cosmetics/Personal Care
|
$169.74
|
-0.02
-0.01% |
$174.32
|
1,902,664
141.99% of 50 DAV
50 DAV is 1,340,000
|
$170.33
-0.35%
|
1/2/2024
|
$138.23
|
PP = $153.63
|
|
MB = $161.31
|
Most Recent Note - 2/5/2024 6:50:27 PM
G - It is extended from the latest base and hit a new high today but finished flat. Keep in mind it is due to report Dec '23 quarterly earnings after the close on Tuesday, 2/06/24. Volume and volatility often increase near earnings news. Its 50 DMA line ($143.63) defines important near-term support to watch.
>>> FEATURED STOCK ARTICLE : Peched at All-Time High With Earnings News Due - 2/5/2024 |
View all notes |
Set NEW NOTE alert |
Company Profile |
SEC
News |
Chart |
Request a new note
C
A
S
I |
KOF
-
NYSE
Coca-Cola Femsa ADR
Beverages-Non-Alcoholic
|
$97.25
|
-5.14
-5.02% |
$101.28
|
174,124
118.45% of 50 DAV
50 DAV is 147,000
|
$102.94
-5.53%
|
1/12/2024
|
$93.38
|
PP = $99.34
|
|
MB = $104.31
|
Most Recent Note - 2/5/2024 7:02:40 PM
Y - Abruptly reversed the prior session's gain and undercut its prior high today raising concerns while retreating from its 52-week high. Its 50 DMA line ($91.61) recently acted as support. Color code was changed to yellow as a valid secondary buy point was noted up to +5% above the recent high since finding support at its 10 WMA line after an earlier breakout. Its Relative Strength Rating is currently 84, well above the 80+ minimum guideline for buy candidates.
>>> FEATURED STOCK ARTICLE : Secondary Buy Point Noted After Finding Support - 1/12/2024 |
View all notes |
Set NEW NOTE alert |
Company Profile |
SEC
News |
Chart |
Request a new note
C
A
S
I |
PCAR
-
NASDAQ
Paccar
Trucks and Parts-Hvy Duty
|
$104.20
|
+1.08
1.05% |
$104.37
|
2,589,197
113.66% of 50 DAV
50 DAV is 2,278,000
|
$103.55
0.63%
|
1/23/2024
|
$100.35
|
PP = $98.57
|
|
MB = $103.50
|
Most Recent Note - 1/31/2024 12:49:01 PM
Y - Volume totals have been cooling while consolidating near its all-time high after volume-driven gains. Reported Dec '23 quarterly earnings +53% on +11% sales revenues versus the year-ago period, its 9th quarterly comparison with better than the +25% minimum earnings guideline (C criteria). There was a downturn in FY' 20 annual earnings (A criteria) like many companies during the pandemic.
>>> FEATURED STOCK ARTICLE : Volume-Driven Breakout for Paccar - 1/23/2024 |
View all notes |
Set NEW NOTE alert |
Company Profile |
SEC
News |
Chart |
Request a new note
C
A
S
I |
HUBB
-
NYSE
Hubbell
Electrical-Power/Equipmt
|
$350.99
|
-3.04
-0.86% |
$356.38
|
507,019
131.35% of 50 DAV
50 DAV is 386,000
|
$356.06
-1.42%
|
1/30/2024
|
$343.26
|
PP = $336.83
|
|
MB = $353.67
|
Most Recent Note - 2/2/2024 1:46:41 PM
Y - Hitting another new all-time high with today's volume-driven gain. Finished strong after highlighted in yellow in the 1/30/24 mid-day report with pivot point cited based on its 1/22/24 high after a cup-with-handle base.
>>> FEATURED STOCK ARTICLE : Volume Heavy Behind Breakout Gain for Hubbell - 1/30/2024 |
View all notes |
Set NEW NOTE alert |
Company Profile |
SEC
News |
Chart |
Request a new note
C
A
S
I |
Symbol/Exchange
Company Name
Industry Group |
PRICE |
CHANGE
(%Change) |
Day High |
Volume
(% DAV)
(% 50 day avg vol) |
52 Wk Hi
% From Hi |
Featured
Date |
Price
Featured |
Pivot Featured |
|
Max Buy |
MANH
-
NASDAQ
Manhattan Associates
Computer Sftwr-Enterprse
|
$248.98
|
-1.58
-0.63% |
$252.00
|
273,054
62.92% of 50 DAV
50 DAV is 434,000
|
$258.91
-3.84%
|
1/31/2024
|
$240.57
|
PP = $230.71
|
|
MB = $242.25
|
Most Recent Note - 2/1/2024 5:54:02 PM
Y - Posted another solid gain today, Highlighted in yellow in the 1/31/24 mid-day report with pivot point cited based on its 11/29/23 high plus 10 cents.
>>> FEATURED STOCK ARTICLE : Big Volume Behind Breakout Gain - 1/31/2024 |
View all notes |
Set NEW NOTE alert |
Company Profile |
SEC
News |
Chart |
Request a new note
C
A
S
I |
|
|
|
THESE ARE NOT BUY RECOMMENDATIONS!
Comments contained in the body of this report are technical
opinions only. The material herein has been obtained
from sources believed to be reliable and accurate, however,
its accuracy and completeness cannot be guaranteed.
This site is not an investment advisor, hence it does
not endorse or recommend any securities or other investments.
Any recommendation contained in this report may not
be suitable for all investors and it is not to be deemed
an offer or solicitation on our part with respect to
the purchase or sale of any securities. All trademarks,
service marks and trade names appearing in this report
are the property of their respective owners, and are
likewise used for identification purposes only.
This report is a service available
only to active Paid Premium Members.
You may opt-out of receiving report notifications
at any time. Questions or comments may be submitted
by writing to Premium Membership Services 665 S.E. 10 Street, Suite 201 Deerfield Beach, FL 33441-5634 or by calling 1-800-965-8307
or 954-785-1121.
|
|
|