You are not logged in.
This means you
CAN ONLY VIEW reports that were published prior to Friday, March 21, 2025.
You
MUST UPGRADE YOUR MEMBERSHIP if you want to see any current reports.
AFTER MARKET UPDATE - WEDNESDAY, JANUARY 31ST, 2024
Previous After Market Report Next After Market Report >>>
|
|
|
|
DOW |
-317.01 |
38,150.30 |
-0.82% |
|
Volume |
1,291,568,243 |
+52% |
|
Volume |
5,939,991,100 |
+24% |
|
NASDAQ |
-345.89 |
15,164.01 |
-2.23% |
|
Advancers |
590 |
22% |
|
Advancers |
1,148 |
27% |
|
S&P 500 |
-79.32 |
4,845.65 |
-1.61% |
|
Decliners |
2,135 |
78% |
|
Decliners |
3,138 |
73% |
|
Russell 2000 |
-48.89 |
1,947.34 |
-2.45% |
|
52 Wk Highs |
164 |
|
|
52 Wk Highs |
132 |
|
|
S&P 600 |
-33.44 |
1,265.19 |
-2.58% |
|
52 Wk Lows |
29 |
|
|
52 Wk Lows |
131 |
|
|
 |
Major Indices Fell With Higher Volume Totals
Kenneth J. Gruneisen - Passed the CAN SLIM® Master's Exam
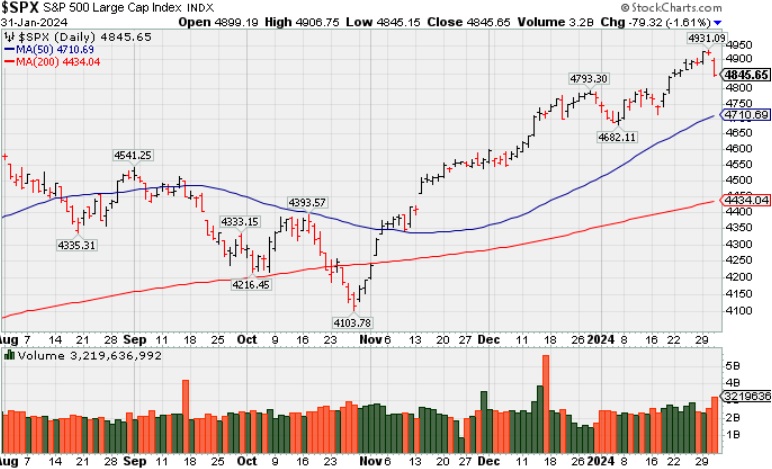
The major indices closed at or near their worst levels of the day. The Dow Jones Industrial Average fell -0.8%, the S&P 500 declined -1.6%, the Nasdaq Composite logged a -2.2% loss, and the Russell 2000 sank -2.5%. Volume was reported higher than the prior session totals on the NYSE and on the Nasdaq exchange, action indicative of distributional pressure. Breadth was negative as decliners led advancers by more than a 3-1 margin on the NYSE and by almost a 3-1 margin on the Nasdaq exchange. There were 68 high-ranked companies from the Leaders List that hit new 52-week highs and were listed on the BreakOuts Page versus 107 on the prior session. New 52-week highs totals outnumbered new lows on the NYSE while new highs and lows were evenly matched on the Nasdaq exchange. The major indices are in a confirmed uptrend (M criteria). New buying efforts should be only made in stocks fitting all key criteria of the fact-based investment system.
PICTURED: The S&P 500 Index is pulling back from a new all-time high.
All 11 S&P 500 sectors closed with a loss as investors reacted to the latest move by the FOMC. The committee voted unanimously to leave the target range for the fed funds rate unchanged at 5.25-5.50%. The 2-yr note yield fell 13 basis points to 4.23% and the 10-yr note yield fell nine basis points to 3.97%.
There was a weak reaction to earnings results from Alphabet (GOOG -7.35%) and Microsoft (MSFT -2.69%) as they did not live up to the market's expectations. Dow component Boeing (BA +5.29%) was a standout after its earnings report.
|
 Kenneth J. Gruneisen started out as a licensed stockbroker in August 1987, a couple of months prior to the historic stock market crash that took the Dow Jones Industrial Average down -22.6% in a single day. He has published daily fact-based fundamental and technical analysis on high-ranked stocks online for two decades. Through FACTBASEDINVESTING.COM, Kenneth provides educational articles, news, market commentary, and other information regarding proven investment systems that work in good times and bad.
Comments contained in the body of this report are technical opinions only and are not necessarily those of Gruneisen Growth Corp. The material herein has been obtained from sources believed to be reliable and accurate, however, its accuracy and completeness cannot be guaranteed. Our firm, employees, and customers may effect transactions, including transactions contrary to any recommendation herein, or have positions in the securities mentioned herein or options with respect thereto. Any recommendation contained in this report may not be suitable for all investors and it is not to be deemed an offer or solicitation on our part with respect to the purchase or sale of any securities. |
|
 |
Retail, Financial, Tech, and Commodity-Linked Groups Fell
Kenneth J. Gruneisen - Passed the CAN SLIM® Master's Exam
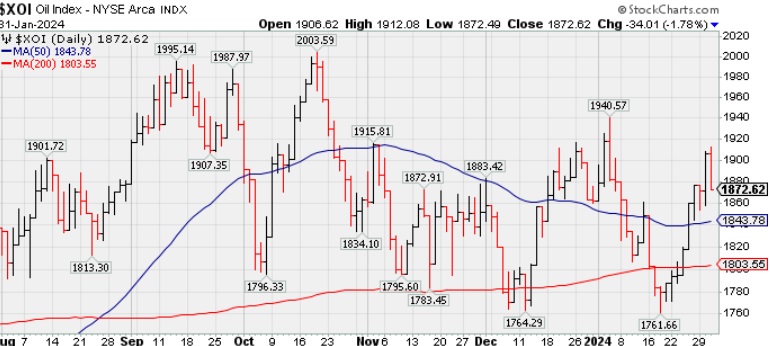
The Retail Index ($RLX -2.04%), Broker/Dealer Index ($XBD -2.36%) and the Bank Index ($BKX -2.33%) ended unanimously lower. The tech sector had a negative bias as the Semiconductor Index ($SOX -1.37%), Biotech Index ($BTK -1.76%) and the Networking Index ($NWX -3.50%) posted unanimous losses. The Gold & Silver Index ($XAU -0.57%) edged lower while the Oil Services Index ($OSX -2.30%) and the Integrated Oil Index ($XOI -1.78%) both slumped for larger losses.
![]() PICTURED: The Integrated Oil Index ($XOI -1.78%) pulled back after recent gains helped it rebound above its 50-day and 200-day moving average (DMA) lines.
| Oil Services |
$OSX |
80.70 |
-1.90 |
-2.30% |
-3.79% |
| Integrated Oil |
$XOI |
1,872.62 |
-34.01 |
-1.78% |
+0.54% |
| Semiconductor |
$SOX |
4,260.92 |
-59.07 |
-1.37% |
+2.05% |
| Networking |
$NWX |
832.26 |
-30.22 |
-3.50% |
-0.07% |
| Broker/Dealer |
$XBD |
537.77 |
-13.00 |
-2.36% |
-3.50% |
| Retail |
$RLX |
3,948.73 |
-82.23 |
-2.04% |
+1.54% |
| Gold & Silver |
$XAU |
113.54 |
-0.65 |
-0.57% |
-9.67% |
| Bank |
$BKX |
95.72 |
-2.28 |
-2.33% |
-0.31% |
| Biotech |
$BTK |
5,109.01 |
-91.41 |
-1.76% |
-5.72% |
|
|
|
 |
Big Volume Behind Breakout Gain
Kenneth J. Gruneisen - Passed the CAN SLIM® Master's Exam
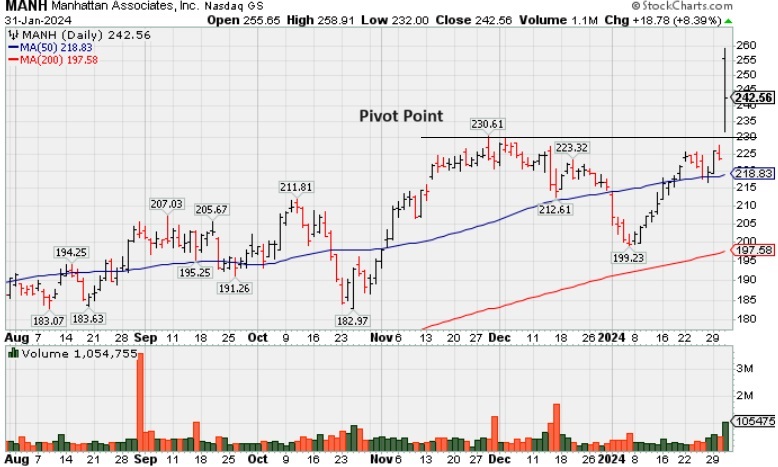
Manhattan Associates Inc (MANH +$18.78 or +8.39% to $242.56) closed in the middle of its intra-day range after highlighted in yellow with pivot point cited based on its 11/29/23 high plus 10 cents in the earlier mid-day report (read here). It gapped up today hitting a new 52-week high with gain backed by +153% above average volume triggering a technical buy signal.
Earnings increases were above the +25% minimum guideline in the 5 latest quarterly comparisons through Dec '23. Annual earnings growth has been strong. It has a 96 Earnings Per Share (EPS) rating. Its Relative Strength rating is 93. It has a small supply of 61.6 million shares (S criteria) outstanding, which can contribute to volatility in the event of institutional buying or selling. The number of top-rated funds owning its share rose from 849 in Mar '23 to 1,239 in Sep '15, a reassuring sign concerning the I criteria. Charts courtesy www.stockcharts.com
 |
|
|
Color Codes Explained :
Y - Better candidates highlighted by our
staff of experts.
G - Previously featured
in past reports as yellow but may no longer be buyable under the
guidelines.
***Last / Change / Volume data in this table is the closing quote data***
Symbol/Exchange
Company Name
Industry Group |
PRICE |
CHANGE
(%Change) |
Day High |
Volume
(% DAV)
(% 50 day avg vol) |
52 Wk Hi
% From Hi |
Featured
Date |
Price
Featured |
Pivot Featured |
|
Max Buy |
 ANET
-
NYSE
ANET
-
NYSE
Arista Networks
Computer-Networking
|
$258.68
|
-13.28
-4.88% |
$267.49
|
3,051,020
190.81% of 50 DAV
50 DAV is 1,599,000
|
$272.90
-5.21%
|
10/31/2023
|
$188.84
|
PP = $198.80
|
|
MB = $208.74
|
 Most Recent Note - 1/31/2024 11:58:48 AM
G - Gapped down today retreating from its all-time high. Extended from any sound base, its 50 DMA line ($237) defines near-term support above the prior low ($226.60 on 1/04/24) area. Fundamentals remain strong.
>>> FEATURED STOCK ARTICLE : Extended From Base and Hovering at All-Time High - 12/26/2023 |
View all notes |
Set NEW NOTE alert |
Company Profile |
SEC
News |
Chart |
Request a new note
C
A
S
I |
NVO
-
NYSE
Novo Nordisk ADR
Medical-Ethical Drugs
|
$114.68
|
+5.66
5.19% |
$116.12
|
12,013,743
304.76% of 50 DAV
50 DAV is 3,942,000
|
$109.33
4.89%
|
11/2/2023
|
$100.97
|
PP = $104.10
|
|
MB = $109.31
|
Most Recent Note - 1/31/2024 12:27:20 PM
G - Gapped up today rallying to a new all-time high above its "max buy" level, and its color code is changed to green. The recent low ($103.38 on 1/23/24) defines important near-term support nearly coinciding with its 50 DMA line ($103.39).
>>> FEATURED STOCK ARTICLE : Gap Up Gain on Prior Session Triggered Technical Buy Signal - 1/5/2024 |
View all notes |
Set NEW NOTE alert |
Company Profile |
SEC
News |
Chart |
Request a new note
C
A
S
I |
QLYS
-
NASDAQ
Qualys
Computer Sftwr-Security
|
$189.17
|
-4.01
-2.08% |
$192.09
|
365,373
101.21% of 50 DAV
50 DAV is 361,000
|
$206.35
-8.33%
|
1/24/2024
|
$196.27
|
PP = $206.45
|
|
MB = $216.77
|
Most Recent Note - 1/31/2024 5:52:39 PM
G - Sputtering below its 50 DMA line ($191) with today's loss backed by average volume. Only a prompt rebound above the 50 DMA line would help its outlook improve.
>>> FEATURED STOCK ARTICLE : Posted Light Volume Gain Finding Support at 50-Day Moving Average - 1/8/2024 |
View all notes |
Set NEW NOTE alert |
Company Profile |
SEC
News |
Chart |
Request a new note
C
A
S
I |
AXON
-
NASDAQ
Axon Enterprise
Security/Sfty
|
$249.14
|
-5.11
-2.01% |
$255.02
|
492,397
132.36% of 50 DAV
50 DAV is 372,000
|
$262.95
-5.25%
|
11/8/2023
|
$127.84
|
PP = $223.30
|
|
MB = $234.47
|
Most Recent Note - 1/29/2024 6:32:39 PM
G - Posted a gain with below-average volume, hovering near its all-time high. Its 50-day moving average (DMA) line ($244) defines near-term support above prior highs in the $229-231 area.
>>> FEATURED STOCK ARTICLE : Consolidating Well Above Near-Term Support - 1/9/2024 |
View all notes |
Set NEW NOTE alert |
Company Profile |
SEC
News |
Chart |
Request a new note
C
A
S
I |
TDG
-
NYSE
TransDigm Group
Aerospace/Defense
|
$1,092.68
|
+6.74
0.62% |
$1,100.00
|
296,672
153.72% of 50 DAV
50 DAV is 193,000
|
$1,089.97
0.25%
|
12/12/2023
|
$1,000.39
|
PP = $1,013.18
|
|
MB = $1,063.84
|
Most Recent Note - 1/31/2024 5:49:30 PM
G - Posted a gain today for a new all-time high with above average volume. Prior highs in the $1,013-1,015 area define near-term support to watch on pullbacks.
>>> FEATURED STOCK ARTICLE : Inching to New Highs With 6th Consecutive Gain - 1/11/2024 |
View all notes |
Set NEW NOTE alert |
Company Profile |
SEC
News |
Chart |
Request a new note
C
A
S
I |
Symbol/Exchange
Company Name
Industry Group |
PRICE |
CHANGE
(%Change) |
Day High |
Volume
(% DAV)
(% 50 day avg vol) |
52 Wk Hi
% From Hi |
Featured
Date |
Price
Featured |
Pivot Featured |
|
Max Buy |
PANW
-
NASDAQ
Palo Alto Networks
Computer Sftwr-Security
|
$338.51
|
-7.38
-2.13% |
$343.99
|
2,478,887
60.46% of 50 DAV
50 DAV is 4,100,000
|
$350.60
-3.45%
|
1/10/2024
|
$313.65
|
PP = $318.00
|
|
MB = $333.90
|
Most Recent Note - 1/31/2024 12:47:32 PM
G - Gapped down today yet still perched near its all-time high. Color code is changed to green after recently getting extended beyond the "max buy" level.
>>> FEATURED STOCK ARTICLE : Paused After 6 Gains to a New All-Time High - 1/17/2024 |
View all notes |
Set NEW NOTE alert |
Company Profile |
SEC
News |
Chart |
Request a new note
C
A
S
I |
URI
-
NYSE
United Rentals
Comml Svcs-Leasing
|
$625.40
|
-17.58
-2.73% |
$641.25
|
1,003,036
142.68% of 50 DAV
50 DAV is 703,000
|
$658.51
-5.03%
|
1/24/2024
|
$576.90
|
PP = $585.60
|
|
MB = $614.88
|
Most Recent Note - 1/31/2024 5:51:16 PM
C - Pulled back today with above-average volume. Prior high ($585.50) defines initial support to watch. Reported Dec '23 quarterly earnings +16% on +13% sales revenues versus the year-ago period, below the +25% minimum earnings guideline (C criteria) raising fundamental concerns.
>>> FEATURED STOCK ARTICLE : Negative Reversal After New High for United Rentals - 1/24/2024 |
View all notes |
Set NEW NOTE alert |
Company Profile |
SEC
News |
Chart |
Request a new note
C
A
S
I |
AMPH
-
NASDAQ
Amphastar Pharm
Medical-Biomed/Biotech
|
$53.35
|
-1.59
-2.89% |
$55.28
|
367,092
77.12% of 50 DAV
50 DAV is 476,000
|
$67.66
-21.15%
|
12/4/2023
|
$60.84
|
PP = $58.35
|
|
MB = $61.27
|
Most Recent Note - 1/31/2024 5:48:16 PM
G - Quietly slumped further below its 50 DMA line toward its 200 DMA line. A rebound above the 50 DMA line ($57.64) is needed for its outlook to improve. Fundamentals remain strong.
>>> FEATURED STOCK ARTICLE : Quietly Sinking Toward 200-Day Moving Average Line - 1/25/2024 |
View all notes |
Set NEW NOTE alert |
Company Profile |
SEC
News |
Chart |
Request a new note
C
A
S
I |
TBBK
-
NASDAQ
The Bancorp
Banks-Northeast
|
$43.64
|
-3.35
-7.13% |
$46.69
|
628,369
144.79% of 50 DAV
50 DAV is 434,000
|
$47.11
-7.37%
|
1/22/2024
|
$40.87
|
PP = $42.56
|
|
MB = $44.69
|
Most Recent Note - 1/31/2024 12:43:21 PM
G - Pulling back today after 3 volume-driven gains. Prior highs in the $42 area define near-term support to watch. Reported Dec '23 quarterly earnings +34% on +16% sales revenues versus the year-ago period. Volume and volatility often increase near earnings news.
>>> FEATURED STOCK ARTICLE : Volume-Driven Breakout Triggered Buy Signal After Earnings Report - 1/26/2024 |
View all notes |
Set NEW NOTE alert |
Company Profile |
SEC
News |
Chart |
Request a new note
C
A
S
I |
LULU
-
NASDAQ
lululemon athletica
Retail-Apparel/Shoes/Acc
|
$453.73
|
-27.67
-5.75% |
$473.10
|
2,863,717
190.03% of 50 DAV
50 DAV is 1,507,000
|
$516.39
-12.13%
|
12/8/2023
|
$490.61
|
PP = $485.93
|
|
MB = $510.23
|
Most Recent Note - 1/31/2024 12:45:22 PM
G - Color code is changed to green after gapping down today and violating its 50 DMA line ($477) triggering a technical sell signal. Only a prompt rebound above the 50 DMA line would help its outlook improve.
>>> FEATURED STOCK ARTICLE : Perched at All-Time High With Volume Totals Cooling - 12/27/2023 |
View all notes |
Set NEW NOTE alert |
Company Profile |
SEC
News |
Chart |
Request a new note
C
A
S
I |
Symbol/Exchange
Company Name
Industry Group |
PRICE |
CHANGE
(%Change) |
Day High |
Volume
(% DAV)
(% 50 day avg vol) |
52 Wk Hi
% From Hi |
Featured
Date |
Price
Featured |
Pivot Featured |
|
Max Buy |
CRWD
-
NASDAQ
CrowdStrike Holdings
Computer Sftwr-Security
|
$292.38
|
-8.97
-2.98% |
$300.12
|
2,490,415
73.57% of 50 DAV
50 DAV is 3,385,000
|
$307.55
-4.93%
|
1/2/2024
|
$246.42
|
PP = $261.91
|
|
MB = $275.01
|
Most Recent Note - 1/31/2024 12:50:16 PM
G - Hovering near its all-time high. Prior high in the $261 area defines initial support to watch above its 50 DMA line ($256). Fundamentals remain strong.
>>> FEATURED STOCK ARTICLE : CrowdStrike Holdings Pulling Back After "3-Weeks Tight" Pattern - 1/3/2024 |
View all notes |
Set NEW NOTE alert |
Company Profile |
SEC
News |
Chart |
Request a new note
C
A
S
I |
ELF
-
NYSE
e.l.f. Beauty
Cosmetics/Personal Care
|
$159.53
|
-1.48
-0.92% |
$163.57
|
1,046,117
75.59% of 50 DAV
50 DAV is 1,384,000
|
$164.71
-3.14%
|
1/2/2024
|
$138.23
|
PP = $153.63
|
|
MB = $161.31
|
Most Recent Note - 1/29/2024 6:34:13 PM
Y - Holding its ground in a tight range above the pivot point and below its "max buy" level. Fundamentals remain strong.
>>> FEATURED STOCK ARTICLE : Pulled Back After Closing 3 Weeks Tight - 1/2/2024 |
View all notes |
Set NEW NOTE alert |
Company Profile |
SEC
News |
Chart |
Request a new note
C
A
S
I |
KOF
-
NYSE
Coca Cola Femsa Sab Ads
FOOD and BEVERAGE - Beverages - Soft Drinks
|
$94.94
|
+1.76
1.89% |
$96.66
|
253,119
181.97% of 50 DAV
50 DAV is 139,100
|
$99.34
-4.43%
|
1/12/2024
|
$93.38
|
PP = $99.34
|
|
MB = $104.31
|
Most Recent Note - 1/30/2024 5:30:30 PM
Y - Posted a 4th consecutive gain with below average volume, finding support above its 50 DMA line ($90.55). Color code was changed to yellow as a valid secondary buy point was noted up to +5% above the recent high since finding support at its 10 WMA line after an earlier breakout. Its Relative Strength Rating is currently 79, below the 80+ minimum guideline for buy candidates.
>>> FEATURED STOCK ARTICLE : Secondary Buy Point Noted After Finding Support - 1/12/2024 |
View all notes |
Set NEW NOTE alert |
Company Profile |
SEC
News |
Chart |
Request a new note
C
A
S
I |
PCAR
-
NASDAQ
Paccar
Trucks and Parts-Hvy Duty
|
$100.39
|
-1.58
-1.55% |
$102.20
|
2,069,911
90.35% of 50 DAV
50 DAV is 2,291,000
|
$103.40
-2.91%
|
1/23/2024
|
$100.35
|
PP = $98.57
|
|
MB = $103.50
|
Most Recent Note - 1/31/2024 12:49:01 PM
Y - Volume totals have been cooling while consolidating near its all-time high after volume-driven gains. Reported Dec '23 quarterly earnings +53% on +11% sales revenues versus the year-ago period, its 9th quarterly comparison with better than the +25% minimum earnings guideline (C criteria). There was a downturn in FY' 20 annual earnings (A criteria) like many companies during the pandemic.
>>> FEATURED STOCK ARTICLE : Volume-Driven Breakout for Paccar - 1/23/2024 |
View all notes |
Set NEW NOTE alert |
Company Profile |
SEC
News |
Chart |
Request a new note
C
A
S
I |
HUBB
-
NYSE
Hubbell
Electrical-Power/Equipmt
|
$335.57
|
-8.74
-2.54% |
$343.63
|
676,008
177.43% of 50 DAV
50 DAV is 381,000
|
$347.28
-3.37%
|
1/30/2024
|
$343.26
|
PP = $336.83
|
|
MB = $353.67
|
Most Recent Note - 1/30/2024 5:26:40 PM
Y - Finished strong after highlighted in yellow in the earlier mid-day report with pivot point cited based on its 1/22/24 high after a cup-with-handle base. Hit a new all-time high with today's gain backed by +139% above average volume triggering a technical buy signal. See the latest FSU analysis for more details and a new annotated graph.
>>> FEATURED STOCK ARTICLE : Volume Heavy Behind Breakout Gain for Hubbell - 1/30/2024 |
View all notes |
Set NEW NOTE alert |
Company Profile |
SEC
News |
Chart |
Request a new note
C
A
S
I |
Symbol/Exchange
Company Name
Industry Group |
PRICE |
CHANGE
(%Change) |
Day High |
Volume
(% DAV)
(% 50 day avg vol) |
52 Wk Hi
% From Hi |
Featured
Date |
Price
Featured |
Pivot Featured |
|
Max Buy |
MANH
-
NASDAQ
Manhattan Associates
Computer Sftwr-Enterprse
|
$242.56
|
+18.78
8.39% |
$258.91
|
1,054,755
251.13% of 50 DAV
50 DAV is 420,000
|
$230.61
5.18%
|
1/31/2024
|
$240.57
|
PP = $230.71
|
|
MB = $242.25
|
Most Recent Note - 1/31/2024 5:46:28 PM
Y - Posted a solid gain today after highlighted in yellow with pivot point cited based on its 11/29/23 high plus 10 cents. Gapped up hitting a new 52-week high with gain backed by +153% above average volume triggering a technical buy signal. Earnings increases were above the +25% minimum guideline in the 5 latest quarterly comparisons through Dec '23. Annual earnings growth has been strong. See the latest FSU analysis for more details and a new annotated graph.
>>> FEATURED STOCK ARTICLE : Big Volume Behind Breakout Gain - 1/31/2024 |
View all notes |
Set NEW NOTE alert |
Company Profile |
SEC
News |
Chart |
Request a new note
C
A
S
I |
|
|
|
THESE ARE NOT BUY RECOMMENDATIONS!
Comments contained in the body of this report are technical
opinions only. The material herein has been obtained
from sources believed to be reliable and accurate, however,
its accuracy and completeness cannot be guaranteed.
This site is not an investment advisor, hence it does
not endorse or recommend any securities or other investments.
Any recommendation contained in this report may not
be suitable for all investors and it is not to be deemed
an offer or solicitation on our part with respect to
the purchase or sale of any securities. All trademarks,
service marks and trade names appearing in this report
are the property of their respective owners, and are
likewise used for identification purposes only.
This report is a service available
only to active Paid Premium Members.
You may opt-out of receiving report notifications
at any time. Questions or comments may be submitted
by writing to Premium Membership Services 665 S.E. 10 Street, Suite 201 Deerfield Beach, FL 33441-5634 or by calling 1-800-965-8307
or 954-785-1121.
|
|
|