You are not logged in.
This means you
CAN ONLY VIEW reports that were published prior to Tuesday, March 25, 2025.
You
MUST UPGRADE YOUR MEMBERSHIP if you want to see any current reports.
AFTER MARKET UPDATE - FRIDAY, JANUARY 12TH, 2024
Previous After Market Report Next After Market Report >>>
|
|
|
|
DOW |
-118.04 |
37,592.98 |
-0.31% |
|
Volume |
801,459,818 |
-10% |
|
Volume |
4,980,878,500 |
-5% |
|
NASDAQ |
+2.57 |
14,972.76 |
+0.02% |
|
Advancers |
1,526 |
55% |
|
Advancers |
2,017 |
48% |
|
S&P 500 |
+3.59 |
4,783.83 |
+0.08% |
|
Decliners |
1,232 |
45% |
|
Decliners |
2,208 |
52% |
|
Russell 2000 |
-4.49 |
1,950.96 |
-0.23% |
|
52 Wk Highs |
96 |
|
|
52 Wk Highs |
137 |
|
|
S&P 600 |
-2.79 |
1,269.90 |
-0.22% |
|
52 Wk Lows |
22 |
|
|
52 Wk Lows |
89 |
|
|
 |
Major Indices Were Indecisive While Leadership Improved
Kenneth J. Gruneisen - Passed the CAN SLIM® Master's Exam
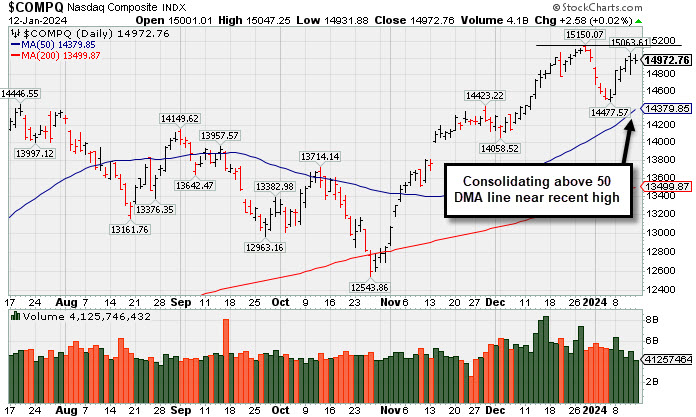
The S&P 500 and Nasdaq Composite closed little changed while the Dow Jones Industrial Average and Russell 2000 declined 0.3% and 0.2%, respectively. Volume was reported lighter than the prior session total on the NYSE and on the Nasdaq exchange. Advancers led decliners by a 5-4 margin on the NYSE but decliners slightly outnumbered advancers on the Nasdaq exchange. There were 61 high-ranked companies from the Leaders List that hit new 52-week highs and were listed on the BreakOuts Page, versus the total of 51 on the prior session. New 52-week highs outnumbered new 52-week lows on the NYSE and on the Nasdaq exchange. The major indices are in a confirmed uptrend (M criteria). New buying efforts should be only made in stocks fitting all key criteria of the fact-based investment system.
PICTURED: The Nasdaq Composite Index is consoidating above its 50-day moving average (DMA) line near its prior high.
Dow component UnitedHealth (UNH -3.37%), was a losing standout while Delta Air Lines (DAL -8.97%), Bank of America (BAC -1.06%), and Wells Fargo (WFC -3.34%) also fell. JP Morgan Chase (JPM -0.73%) and Citigroup (C +1.04%) were mixed after they reported earnings.
There was a cooler-than-expected Producer Price Index (PPI) report for December. The 2-yr note yield declined 12 basis points to 4.15%. The 10-yr note yield fell three basis points to 3.95%.
Geopolitical angst was also part of the narrative. The United States and the UK conducted strikes against military targets in Houthi-controlled areas of Yemen.
|
 Kenneth J. Gruneisen started out as a licensed stockbroker in August 1987, a couple of months prior to the historic stock market crash that took the Dow Jones Industrial Average down -22.6% in a single day. He has published daily fact-based fundamental and technical analysis on high-ranked stocks online for two decades. Through FACTBASEDINVESTING.COM, Kenneth provides educational articles, news, market commentary, and other information regarding proven investment systems that work in good times and bad.
Comments contained in the body of this report are technical opinions only and are not necessarily those of Gruneisen Growth Corp. The material herein has been obtained from sources believed to be reliable and accurate, however, its accuracy and completeness cannot be guaranteed. Our firm, employees, and customers may effect transactions, including transactions contrary to any recommendation herein, or have positions in the securities mentioned herein or options with respect thereto. Any recommendation contained in this report may not be suitable for all investors and it is not to be deemed an offer or solicitation on our part with respect to the purchase or sale of any securities. |
|
 |
Commodity-Linked Groups Posted Standout Gains
Kenneth J. Gruneisen - Passed the CAN SLIM® Master's Exam
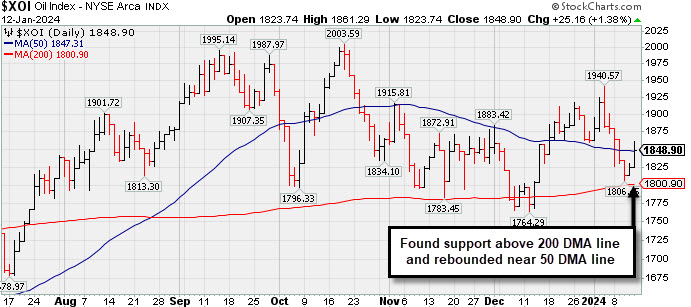
The Retail Index ($RLX -0.32%), Broker/Dealer Index ($XBD -0.38%), and the Bank Index ($BKX -1.05%) each ended lower. The tech sector saw the Semiconductor Index ($SOX -0.38%) and the Biotech Index ($BTK -0.57%) both edge lower while the Networking Index ($NWX +0.15%) finished just slightly higher. Commodity-linked groups had a positive bias as the Integrated Oil Index ($XOI +1.38%), Oil Services Index ($OSX +1.43%), and the Gold & Silver Index ($XAU +2.73%) each posted solid gains.
PICTURED: The Integrated Oil Index ($XOI +1.38%) found support above its 200-day moving average (DMA) line and rebounded near its 50 DMA line.
| Oil Services |
$OSX |
79.39 |
+1.12 |
+1.43% |
-5.35% |
| Integrated Oil |
$XOI |
1,848.90 |
+25.16 |
+1.38% |
-0.73% |
| Semiconductor |
$SOX |
4,052.42 |
-15.47 |
-0.38% |
-2.95% |
| Networking |
$NWX |
837.25 |
+1.26 |
+0.15% |
+0.53% |
| Broker/Dealer |
$XBD |
539.26 |
-2.07 |
-0.38% |
-3.24% |
| Retail |
$RLX |
3,935.02 |
-12.52 |
-0.32% |
+1.19% |
| Gold & Silver |
$XAU |
120.64 |
+3.20 |
+2.73% |
-4.02% |
| Bank |
$BKX |
94.11 |
-1.00 |
-1.05% |
-1.99% |
| Biotech |
$BTK |
5,305.34 |
-30.22 |
-0.57% |
-2.09% |
|
|
|
 |
Secondary Buy Point Noted After Finding Support
Kenneth J. Gruneisen - Passed the CAN SLIM® Master's Exam
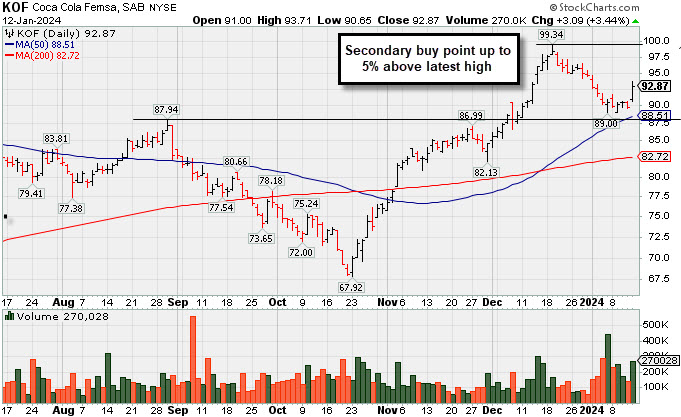
Coca Cola Femsa Sab Ads (KOF +$3.09 or +3.44% to $92.87) was highlighted in yellow in the earlier mid-day report (read here) because a valid secondary buy point exists up to +5% above the recent high since finding support at its 10-week moving average (WMA) line after an earlier breakout. It posted a big volume-driven gain today, finding prompt support near prior highs in the $90 area and above its 50-day moving average (DMA) line. Its Relative Strength Rating is currently 81, just above the 80+ minimum guideline for buy candidates. It was dropped from the Featured Stocks list on 9/21/23 and slumped well below its 200 DMA line then rebounded and rallied to a new high.
KOF has a 95 Earnings Per Share Rating. It reported Sep '23 quarterly earnings +42% on +27% sales revenues versus the year-ago period, and 3 of the 4 latest quarterly comparisons were above the +25% minimum guideline (C criteria). KOF was last shown in great detail on 9/14/23 with an annotated graph under the headline "Lingering Below 50 DMA Line and Relative Strength Rating Slumped". Annal earnings had a downturn in FY '20 like many companies during the pandemic.
It hails from the Beverages - Non-Alcoholic group which is currently ranked 12th on the 197 Industry Groups list. There are 857.1 million shares in the public float (S criteria). The number of top-rated funds owning its shares rose from 120 in Mar '22 to 161 in Sep '23, a reassuring sign concerning the I criteria. Its current Up/Down Volume Ratio of 1.8 is an unbiased indication its shares have been under accumulation over the past 50 days.
|
|
|
Color Codes Explained :
Y - Better candidates highlighted by our
staff of experts.
G - Previously featured
in past reports as yellow but may no longer be buyable under the
guidelines.
***Last / Change / Volume data in this table is the closing quote data***
Symbol/Exchange
Company Name
Industry Group |
PRICE |
CHANGE
(%Change) |
Day High |
Volume
(% DAV)
(% 50 day avg vol) |
52 Wk Hi
% From Hi |
Featured
Date |
Price
Featured |
Pivot Featured |
|
Max Buy |
 ANET
-
NYSE
ANET
-
NYSE
Arista Networks
Computer-Networking
|
$252.03
|
+0.29
0.12% |
$254.73
|
1,221,592
63.03% of 50 DAV
50 DAV is 1,938,000
|
$252.15
-0.05%
|
10/31/2023
|
$188.84
|
PP = $198.80
|
|
MB = $208.74
|
Most Recent Note - 1/11/2024 11:08:42 PM
G - Posted a small gain today with light volume for another new all-time high. Its 50 DMA line ($224) defines near-term support above the prior low in the $210 area. Fundamentals remain strong.
>>> FEATURED STOCK ARTICLE : Extended From Base and Hovering at All-Time High - 12/26/2023 |
View all notes |
Set NEW NOTE alert |
Company Profile |
SEC
News |
Chart |
Request a new note
C
A
S
I |
NVO
-
NYSE
Novo Nordisk ADR
Medical-Ethical Drugs
|
$107.16
|
+0.47
0.44% |
$107.47
|
3,577,229
84.03% of 50 DAV
50 DAV is 4,257,000
|
$108.98
-1.67%
|
11/2/2023
|
$100.97
|
PP = $104.10
|
|
MB = $109.31
|
Most Recent Note - 1/11/2024 12:23:23 PM
Y - Pulling back today after challenging its all-time high. Prior highs in the $105 area define initial support above its 50 DMA line ($101.34).
>>> FEATURED STOCK ARTICLE : Gap Up Gain on Prior Session Triggered Technical Buy Signal - 1/5/2024 |
View all notes |
Set NEW NOTE alert |
Company Profile |
SEC
News |
Chart |
Request a new note
C
A
S
I |
QLYS
-
NASDAQ
Qualys
Computer Sftwr-Security
|
$193.10
|
+1.11
0.58% |
$195.06
|
302,599
78.80% of 50 DAV
50 DAV is 384,000
|
$206.35
-6.42%
|
11/3/2023
|
$167.50
|
PP = $165.03
|
|
MB = $173.28
|
Most Recent Note - 1/11/2024 11:11:40 PM
G - Posted a 3rd consecutive gain today with higher volume after finding prompt support near its 50 DMA line ($184). The 1/05/24 low ($180.01) defines important near-term support where more damaging losses would raise concerns.
>>> FEATURED STOCK ARTICLE : Posted Light Volume Gain Finding Support at 50-Day Moving Average - 1/8/2024 |
View all notes |
Set NEW NOTE alert |
Company Profile |
SEC
News |
Chart |
Request a new note
C
A
S
I |
AXON
-
NASDAQ
Axon Enterprise
Security/Sfty
|
$250.56
|
+1.02
0.41% |
$253.90
|
483,542
106.27% of 50 DAV
50 DAV is 455,000
|
$260.69
-3.89%
|
11/8/2023
|
$127.84
|
PP = $223.30
|
|
MB = $234.47
|
 Most Recent Note - 1/12/2024 5:04:05 PM
G - Posted a small gain today with average volume. Its 50-day moving average (DMA) line ($237) defines near-term support above prior highs in the $229-231 area.
>>> FEATURED STOCK ARTICLE : Consolidating Well Above Near-Term Support - 1/9/2024 |
View all notes |
Set NEW NOTE alert |
Company Profile |
SEC
News |
Chart |
Request a new note
C
A
S
I |
TDG
-
NYSE
TransDigm Group
Aerospace/Defense
|
$1,032.83
|
+13.01
1.28% |
$1,033.81
|
144,266
63.27% of 50 DAV
50 DAV is 228,000
|
$1,022.98
0.96%
|
12/12/2023
|
$1,000.39
|
PP = $1,013.18
|
|
MB = $1,063.84
|
Most Recent Note - 1/11/2024 11:26:30 PM
Y - Hit a new high as it posted a 6th consecutive gain today with below-average volume. See the latest FSU analysis for more details and a new annotated graph.
>>> FEATURED STOCK ARTICLE : Inching to New Highs With 6th Consecutive Gain - 1/11/2024 |
View all notes |
Set NEW NOTE alert |
Company Profile |
SEC
News |
Chart |
Request a new note
C
A
S
I |
Symbol/Exchange
Company Name
Industry Group |
PRICE |
CHANGE
(%Change) |
Day High |
Volume
(% DAV)
(% 50 day avg vol) |
52 Wk Hi
% From Hi |
Featured
Date |
Price
Featured |
Pivot Featured |
|
Max Buy |
PANW
-
NASDAQ
Palo Alto Networks
Computer Sftwr-Security
|
$325.24
|
+1.75
0.54% |
$330.40
|
3,125,432
70.63% of 50 DAV
50 DAV is 4,425,000
|
$325.37
-0.04%
|
1/10/2024
|
$313.65
|
PP = $318.00
|
|
MB = $333.90
|
Most Recent Note - 1/10/2024 1:58:01 PM
Y - Gapped up today on track for a 3rd consecutive gain challenging its all-time high. Color code is changed to yellow while noting that a valid secondary buy point exists up to 5% above the prior high after finding support at its 10 WMA line since the prior breakout. Fundamentals remain strong.
>>> FEATURED STOCK ARTICLE : Consolidating After Volume-Driven Gains for All-Time Highs - 12/15/2023 |
View all notes |
Set NEW NOTE alert |
Company Profile |
SEC
News |
Chart |
Request a new note
C
A
S
I |
URI
-
NYSE
United Rentals
Comml Svcs-Leasing
|
$559.18
|
+7.48
1.36% |
$560.75
|
511,488
75.00% of 50 DAV
50 DAV is 682,000
|
$585.50
-4.50%
|
12/1/2023
|
$499.51
|
PP = $488.73
|
|
MB = $513.17
|
Most Recent Note - 1/12/2024 5:03:01 PM
G - Volume totals have been cooling while consolidating near its all-time high. Its 50 DMA line ($507) defines near-term support to watch above prior highs.
>>> FEATURED STOCK ARTICLE : Perched Near All-Time High Following Volume-Driven Gains - 12/19/2023 |
View all notes |
Set NEW NOTE alert |
Company Profile |
SEC
News |
Chart |
Request a new note
C
A
S
I |
AMPH
-
NASDAQ
Amphastar Pharm
Medical-Biomed/Biotech
|
$54.21
|
+0.18
0.33% |
$54.80
|
605,937
123.16% of 50 DAV
50 DAV is 492,000
|
$67.66
-19.88%
|
12/4/2023
|
$60.84
|
PP = $58.35
|
|
MB = $61.27
|
Most Recent Note - 1/10/2024 1:50:47 PM
G - Color code is changed to green with today's 4th consecutive volume-driven loss violating its 50 DMA line ($56.16) raising concerns and triggering a technical sell signal. Only a prompt rebound above the 50 DMA line would help its outlook improve. Fundamentals remain strong.
>>> FEATURED STOCK ARTICLE : Consolidating Above Pivot Point With Volume Cooling - 12/21/2023 |
View all notes |
Set NEW NOTE alert |
Company Profile |
SEC
News |
Chart |
Request a new note
C
A
S
I |
TBBK
-
NASDAQ
The Bancorp
Banks-Northeast
|
$38.54
|
-0.88
-2.23% |
$40.14
|
338,081
82.26% of 50 DAV
50 DAV is 411,000
|
$42.46
-9.23%
|
12/4/2023
|
$39.88
|
PP = $41.62
|
|
MB = $43.70
|
Most Recent Note - 1/12/2024 5:02:05 PM
G - Slumped back below its 50 DMA line ($39.08) with today's loss following 4 gains. A prompt rebound above the 50 DMA line is needed for its outlook to improve.
>>> FEATURED STOCK ARTICLE : Negative Reversals are Signs of Distributional Pressure - 12/22/2023 |
View all notes |
Set NEW NOTE alert |
Company Profile |
SEC
News |
Chart |
Request a new note
C
A
S
I |
LULU
-
NASDAQ
lululemon athletica
Retail-Apparel/Shoes/Acc
|
$479.64
|
-5.84
-1.20% |
$490.84
|
1,039,554
69.44% of 50 DAV
50 DAV is 1,497,000
|
$516.39
-7.12%
|
12/8/2023
|
$490.61
|
PP = $485.93
|
|
MB = $510.23
|
Most Recent Note - 1/12/2024 5:05:58 PM
Y - Quietly pulling back from its all-time high but slumping back below its 2021 high of $485 raising some concerns, negating its recent breakout from a 2+ year base. Its 50 DMA line ($462.54) defines the next important near-term support to watch.
>>> FEATURED STOCK ARTICLE : Perched at All-Time High With Volume Totals Cooling - 12/27/2023 |
View all notes |
Set NEW NOTE alert |
Company Profile |
SEC
News |
Chart |
Request a new note
C
A
S
I |
Symbol/Exchange
Company Name
Industry Group |
PRICE |
CHANGE
(%Change) |
Day High |
Volume
(% DAV)
(% 50 day avg vol) |
52 Wk Hi
% From Hi |
Featured
Date |
Price
Featured |
Pivot Featured |
|
Max Buy |
CRWD
-
NASDAQ
CrowdStrike Holdings
Computer Sftwr-Security
|
$283.34
|
-1.18
-0.41% |
$290.33
|
2,521,661
77.88% of 50 DAV
50 DAV is 3,238,000
|
$287.76
-1.54%
|
1/2/2024
|
$246.42
|
PP = $261.91
|
|
MB = $275.01
|
Most Recent Note - 1/10/2024 12:19:52 PM
G - Color code was changed to green after rising above its "max buy" level and hitting another new 52-week high with today's 5th consecutive gain. A solid gain and close above the pivot point triggered a technical buy signal on the prior session. Reported Oct '23 quarterly earnings +105% on +35% sales revenues versus the year-ago period, extending its streak of strong earnings increases well above the +25% minimum guideline (C criteria) in quarterly comparisons. Faces no resistance due to overhead supply. Annual earnings history has been strong. Completed its $34 IPO on 6/12/19.
>>> FEATURED STOCK ARTICLE : CrowdStrike Holdings Pulling Back After "3-Weeks Tight" Pattern - 1/3/2024 |
View all notes |
Set NEW NOTE alert |
Company Profile |
SEC
News |
Chart |
Request a new note
C
A
S
I |
ELF
-
NYSE
e.l.f. Beauty
Cosmetics/Personal Care
|
$157.61
|
-1.46
-0.92% |
$161.06
|
701,011
47.33% of 50 DAV
50 DAV is 1,481,000
|
$160.21
-1.62%
|
1/2/2024
|
$138.23
|
PP = $153.63
|
|
MB = $161.31
|
Most Recent Note - 1/11/2024 11:10:02 PM
Y - Wedged to another new high with today's 6th consecutive gain backed by below-average volume. Pivot point cited recently was based on its 12/20/23 high plus 10 cents after forming an advanced "3 weeks tight" base. Subsequent volume-driven gains for new highs are needed to trigger a technical buy signal. Reported Sep '23 quarterly earnings +128% on +76% sales revenues versus the year-ago period, adding to its streak of very strong quarterly results well above the +25% minimum earnings guideline (C criteria). Annual earnings (A criteria) history over the past 3 years has been strong, making it a better match with the fact-based investment system's fundamental guidelines.
>>> FEATURED STOCK ARTICLE : Pulled Back After Closing 3 Weeks Tight - 1/2/2024 |
View all notes |
Set NEW NOTE alert |
Company Profile |
SEC
News |
Chart |
Request a new note
C
A
S
I |
KOF
-
NYSE
Coca-Cola Femsa ADR
Beverages-Non-Alcoholic
|
$92.87
|
+3.09
3.44% |
$93.71
|
270,028
195.67% of 50 DAV
50 DAV is 138,000
|
$99.34
-6.51%
|
1/12/2024
|
$93.38
|
PP = $99.34
|
|
MB = $104.31
|
Most Recent Note - 1/12/2024 5:00:19 PM
Y - Posted a solid volume-driven gaink today. Color code was changed to yellow as a valid secondary buy point was noted up to +5% above the recent high since finding support at its 10 WMA line after an earlier breakout. Found prompt support near prior highs in the $90 area and above its 50 DMA line. Its Relative Strength Rating is currently 81, just above the 80+ minimum guideline for buy candidates. See the latest FSU analysis for more details and a new annotated graph.
>>> FEATURED STOCK ARTICLE : Secondary Buy Point Noted After Finding Support - 1/12/2024 |
View all notes |
Set NEW NOTE alert |
Company Profile |
SEC
News |
Chart |
Request a new note
C
A
S
I |
|
|
|
THESE ARE NOT BUY RECOMMENDATIONS!
Comments contained in the body of this report are technical
opinions only. The material herein has been obtained
from sources believed to be reliable and accurate, however,
its accuracy and completeness cannot be guaranteed.
This site is not an investment advisor, hence it does
not endorse or recommend any securities or other investments.
Any recommendation contained in this report may not
be suitable for all investors and it is not to be deemed
an offer or solicitation on our part with respect to
the purchase or sale of any securities. All trademarks,
service marks and trade names appearing in this report
are the property of their respective owners, and are
likewise used for identification purposes only.
This report is a service available
only to active Paid Premium Members.
You may opt-out of receiving report notifications
at any time. Questions or comments may be submitted
by writing to Premium Membership Services 665 S.E. 10 Street, Suite 201 Deerfield Beach, FL 33441-5634 or by calling 1-800-965-8307
or 954-785-1121.
|
|
|