You are not logged in.
This means you
CAN ONLY VIEW reports that were published prior to Tuesday, March 25, 2025.
You
MUST UPGRADE YOUR MEMBERSHIP if you want to see any current reports.
AFTER MARKET UPDATE - WEDNESDAY, JANUARY 17TH, 2024
Previous After Market Report Next After Market Report >>>
|
|
|
|
DOW |
-94.45 |
37,266.67 |
-0.25% |
|
Volume |
896,068,294 |
-9% |
|
Volume |
5,213,416,000 |
-16% |
|
NASDAQ |
-88.73 |
14,855.62 |
-0.59% |
|
Advancers |
709 |
26% |
|
Advancers |
1,384 |
32% |
|
S&P 500 |
-26.77 |
4,739.21 |
-0.56% |
|
Decliners |
2,062 |
74% |
|
Decliners |
2,890 |
68% |
|
Russell 2000 |
-14.14 |
1,913.17 |
-0.73% |
|
52 Wk Highs |
41 |
|
|
52 Wk Highs |
57 |
|
|
S&P 600 |
-11.93 |
1,245.11 |
-0.95% |
|
52 Wk Lows |
78 |
|
|
52 Wk Lows |
241 |
|
|
 |
Major Indices Sputtered With Less Leadership
Kenneth J. Gruneisen - Passed the CAN SLIM® Master's Exam
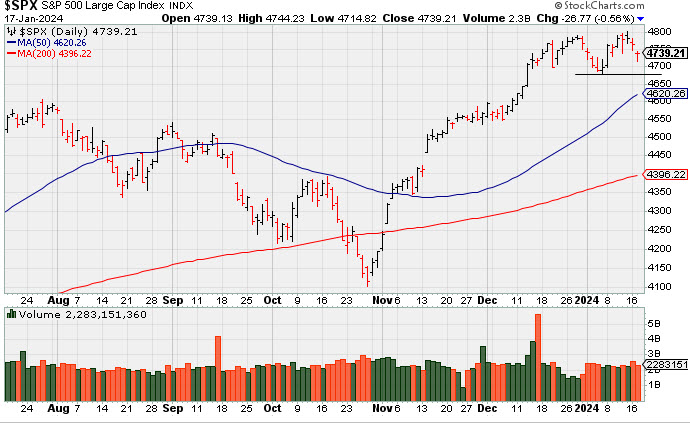
The major indices fell on Wednesday yet a late afternoon improvement left the S&P 500 and Nasdaq Composite near their best levels of the day. Volume was reported lighter than the prior session total on the NYSE and on the Nasdaq exchange. Decliners led advancers by almost a 3-1 margin on the NYSE and by more than 2-1 on the Nasdaq exchange. There were 28 high-ranked companies from the Leaders List that hit new 52-week highs and were listed on the BreakOuts Page, versus the total of 43 on the prior session. New 52-week lows totals expanded and outnumbered shrinking new 52-week highs on the NYSE and on the Nasdaq exchange. The major indices are in a confirmed uptrend (M criteria). New buying efforts should be only made in stocks fitting all key criteria of the fact-based investment system.
PICTURED: The S&P 500 Index fell for a 2nd consecutive session. It is consolidating above recent lows and well above its 50-day moving average (DMA) line.
The S&P 500 financial sector closed with a -0.3% decline. Charles Schwab (SCHW -1.34%) and U.S. Bancorp (USB -1.35%) fell after their quarterly results. Citizens Financial Group (CFG +1.70%) was a group standout with a gain. Meanwhile, the rate-sensitive real estate sector (-1.9%) saw the largest decline.
Meta Platforms (META +0.25%) eked out a slim gain after being down as much as -2.4%. Maplebear Inc.(CART +7.50%) and Impinj, Inc (PI +11.40%) were influentiual tech gainers.
The 2-yr note yield jumped 14 basis points to 4.36% and the 10-yr note yield climbed four basis points to 4.11%. The December retail sales report showed consumer spending slightly better than expected in December. This data was believed to be unlikely to persuade the Fed to cut rates as much, or as early, as the market hopes.
|
 Kenneth J. Gruneisen started out as a licensed stockbroker in August 1987, a couple of months prior to the historic stock market crash that took the Dow Jones Industrial Average down -22.6% in a single day. He has published daily fact-based fundamental and technical analysis on high-ranked stocks online for two decades. Through FACTBASEDINVESTING.COM, Kenneth provides educational articles, news, market commentary, and other information regarding proven investment systems that work in good times and bad.
Comments contained in the body of this report are technical opinions only and are not necessarily those of Gruneisen Growth Corp. The material herein has been obtained from sources believed to be reliable and accurate, however, its accuracy and completeness cannot be guaranteed. Our firm, employees, and customers may effect transactions, including transactions contrary to any recommendation herein, or have positions in the securities mentioned herein or options with respect thereto. Any recommendation contained in this report may not be suitable for all investors and it is not to be deemed an offer or solicitation on our part with respect to the purchase or sale of any securities. |
|
 |
Tech, Retail, Financial, and Commodity-Linked Groups Fell
Kenneth J. Gruneisen - Passed the CAN SLIM® Master's Exam
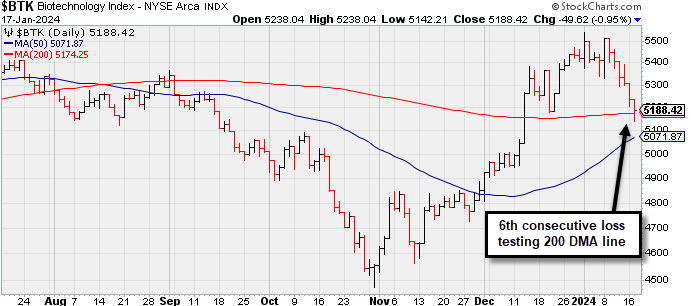
The Retail Index ($RLX -0.88%), Broker/Dealer Index ($XBD -0.21%), and the Bank Index ($BKX -0.68%) each ended lower. The tech sector had a negative bias as the Semiconductor Index ($SOX -0.88%) and the Networking Index ($NWX -0.91%) both fell. Commodity-linked groups also had a negative bias as the Integrated Oil Index ($XOI -1.07%), Oil Services Index ($OSX -0.69%), and the Gold & Silver Index ($XAU -2.70%) ended unanimously lower.
PICTURED: The Biotech Index ($BTK -0.95%) suffered a 6th consecutive loss testing its 200-day moving average (DMA) line.
| Oil Services |
$OSX |
76.90 |
-0.53 |
-0.69% |
-8.32% |
| Integrated Oil |
$XOI |
1,783.80 |
-19.25 |
-1.07% |
-4.22% |
| Semiconductor |
$SOX |
4,069.95 |
-36.00 |
-0.88% |
-2.53% |
| Networking |
$NWX |
829.19 |
-7.65 |
-0.91% |
-0.44% |
| Broker/Dealer |
$XBD |
535.45 |
-1.11 |
-0.21% |
-3.92% |
| Retail |
$RLX |
3,891.52 |
-34.45 |
-0.88% |
+0.07% |
| Gold & Silver |
$XAU |
112.78 |
-3.13 |
-2.70% |
-10.27% |
| Bank |
$BKX |
92.24 |
-0.63 |
-0.68% |
-3.94% |
| Biotech |
$BTK |
5,188.42 |
-49.62 |
-0.95% |
-4.25% |
|
|
|
 |
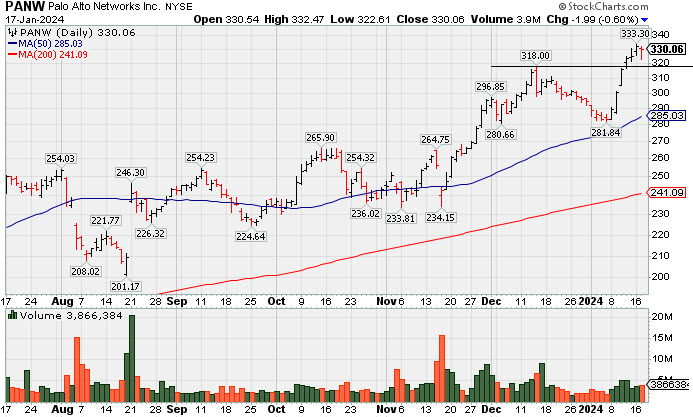
Paused After 6 Gains to a New All-Time High
Kenneth J. Gruneisen - Passed the CAN SLIM® Master's Exam
Palo Alto Networks (PANW -$1.99 or -0.60% to $330.06) paused today following 6 consecutive gains for new all-time highs. It was recently highlighted in yellow while noting that a valid secondary buy point exists up to 5% above the prior high after finding support at its 10 WMA line since the prior breakout. Fundamentals remain strong. PANW was highlighted in yellow in the 11/13/23 mid-day report (read here) with new pivot point cited based on its 10/13/23 high after a short flat base. It was last shown in great detail on 12/15/23 with an annotated graph under the headline, "Consolidating After Volume-Driven Gains for All-Time Highs". Fundamentals have been strong through the Oct '23 quarter with earnings +66% on +20% sales revenues versus the year-ago period. It has a 98 Earnings Per Share Rating. It had a downturn in FY '20 earnings like many companies during the pandemic but has continued posting strong annual earnings (A criteria) since. . PANW's share price was impacted by a 3:1 split on 9/14/22 and it now has a supply (S criteria) of 315.3 million shares outstanding. The number of top-rated funds owning its shares rose from 892 in Jun '17 to 3,200 in Dec '23, a very reassuring sign concerning the I criteria. Its current Up/Down Volume Ratio of 1.7 is an unbiased indication that over the past 50 days it has been under slight accumulation. It has an A Timeliness Rating and a C Sponsorship Rating.
Symbol/Exchange
Company Name
Industry Group | PRICE | CHANGE
(%Change) | Day High | Volume
(% DAV)
(% 50 day avg vol) | 52 Wk Hi
% From Hi | Featured
Date | Price
Featured | Pivot Featured | | Max Buy |  ANET - NYSE ANET - NYSE
Arista Networks
Computer-Networking | $248.99 | -4.27
-1.69% | $253.26 | 1,377,929
81.01% of 50 DAV
50 DAV is 1,701,000 | $257.21
-3.20%
| 10/31/2023 | $188.84 | PP = $198.80 | | MB = $208.74 |  Most Recent Note - 1/17/2024 5:20:02 PM Most Recent Note - 1/17/2024 5:20:02 PM
G - Pulled back today after 4 consecutive gains, retreating from its all-time high with lighter volume behind a small loss. Its 50 DMA line ($226.53) defines near-term support above the prior low in the $210 area. Fundamentals remain strong.
>>> FEATURED STOCK ARTICLE : Extended From Base and Hovering at All-Time High - 12/26/2023 | View all notes | Set NEW NOTE alert | Company Profile | SEC News | Chart | Request a new note C A S I | NVO - NYSE
Novo Nordisk ADR
Medical-Ethical Drugs | $106.68 | +0.33
0.31% | $107.11 | 2,682,303
62.89% of 50 DAV
50 DAV is 4,265,000 | $108.98
-2.11%
| 11/2/2023 | $100.97 | PP = $104.10 | | MB = $109.31 | Most Recent Note - 1/17/2024 5:21:06 PM
Y - Volume has been cooling after recently challenging its all-time high. Prior highs in the $105 area define initial support above its 50 DMA line ($101.85).
>>> FEATURED STOCK ARTICLE : Gap Up Gain on Prior Session Triggered Technical Buy Signal - 1/5/2024 | View all notes | Set NEW NOTE alert | Company Profile | SEC News | Chart | Request a new note C A S I | QLYS - NASDAQ
Qualys
Computer Sftwr-Security | $193.54 | +1.36
0.71% | $194.81 | 324,830
84.81% of 50 DAV
50 DAV is 383,000 | $206.35
-6.21%
| 11/3/2023 | $167.50 | PP = $165.03 | | MB = $173.28 | Most Recent Note - 1/17/2024 5:17:03 PM
G - Still finding support above its 50 DMA line ($186.53). The 1/05/24 low ($180.01) defines important near-term support where more damaging losses would raise concerns.
>>> FEATURED STOCK ARTICLE : Posted Light Volume Gain Finding Support at 50-Day Moving Average - 1/8/2024 | View all notes | Set NEW NOTE alert | Company Profile | SEC News | Chart | Request a new note C A S I | AXON - NASDAQ
Axon Enterprise
Security/Sfty | $250.51 | +1.04
0.42% | $250.68 | 265,663
58.01% of 50 DAV
50 DAV is 458,000 | $260.69
-3.91%
| 11/8/2023 | $127.84 | PP = $223.30 | | MB = $234.47 | Most Recent Note - 1/12/2024 5:04:05 PM
G - Posted a small gain today with average volume. Its 50-day moving average (DMA) line ($237) defines near-term support above prior highs in the $229-231 area.
>>> FEATURED STOCK ARTICLE : Consolidating Well Above Near-Term Support - 1/9/2024 | View all notes | Set NEW NOTE alert | Company Profile | SEC News | Chart | Request a new note C A S I | TDG - NYSE
TransDigm Group
Aerospace/Defense | $1,031.75 | +4.43
0.43% | $1,040.67 | 148,984
67.11% of 50 DAV
50 DAV is 222,000 | $1,033.81
-0.20%
| 12/12/2023 | $1,000.39 | PP = $1,013.18 | | MB = $1,063.84 | Most Recent Note - 1/17/2024 5:18:18 PM
Y - Hit another new all-time high with a small gain today with below-average volume. Recently wedging higher without great volume conviction.
>>> FEATURED STOCK ARTICLE : Inching to New Highs With 6th Consecutive Gain - 1/11/2024 | View all notes | Set NEW NOTE alert | Company Profile | SEC News | Chart | Request a new note C A S I | Symbol/Exchange
Company Name
Industry Group | PRICE | CHANGE
(%Change) | Day High | Volume
(% DAV)
(% 50 day avg vol) | 52 Wk Hi
% From Hi | Featured
Date | Price
Featured | Pivot Featured | | Max Buy | PANW - NASDAQ
Palo Alto Networks
Computer Sftwr-Security | $330.06 | -1.99
-0.60% | $332.47 | 3,863,729
86.40% of 50 DAV
50 DAV is 4,472,000 | $333.30
-0.97%
| 1/10/2024 | $313.65 | PP = $318.00 | | MB = $333.90 | Most Recent Note - 1/17/2024 5:15:47 PM
Y - Paused today after 6 consecutive gains with below-average volume for new all-time highs.A valid secondary buy point exists up to 5% above the prior high after finding support at its 10 WMA line since the prior breakout. Fundamentals remain strong. See the latest FSU analysis for more details and a new annotated graph.
>>> FEATURED STOCK ARTICLE : Paused After 6 Gains to a New All-Time High - 1/17/2024 | View all notes | Set NEW NOTE alert | Company Profile | SEC News | Chart | Request a new note C A S I | URI - NYSE
United Rentals
Comml Svcs-Leasing | $550.32 | -10.81
-1.93% | $561.31 | 634,417
94.55% of 50 DAV
50 DAV is 671,000 | $585.50
-6.01%
| 12/1/2023 | $499.51 | PP = $488.73 | | MB = $513.17 | Most Recent Note - 1/17/2024 5:22:21 PM
G - Pulled back today with higher (near average) volume. Still consolidating near its all-time high. Its 50 DMA line ($512) defines near-term support to watch above prior highs.
>>> FEATURED STOCK ARTICLE : Perched Near All-Time High Following Volume-Driven Gains - 12/19/2023 | View all notes | Set NEW NOTE alert | Company Profile | SEC News | Chart | Request a new note C A S I | AMPH - NASDAQ
Amphastar Pharm
Medical-Biomed/Biotech | $56.17 | +0.67
1.21% | $56.37 | 344,797
68.82% of 50 DAV
50 DAV is 501,000 | $67.66
-16.98%
| 12/4/2023 | $60.84 | PP = $58.35 | | MB = $61.27 | Most Recent Note - 1/16/2024 2:31:45 PM
G - Still lingering below its 50 DMA line ($56.71) after 5 consecutive volume-driven losses. Only a prompt rebound above the 50 DMA line would help its outlook improve. Fundamentals remain strong.
>>> FEATURED STOCK ARTICLE : Consolidating Above Pivot Point With Volume Cooling - 12/21/2023 | View all notes | Set NEW NOTE alert | Company Profile | SEC News | Chart | Request a new note C A S I | TBBK - NASDAQ
The Bancorp
Banks-Northeast | $37.95 | +0.15
0.40% | $38.02 | 266,145
66.87% of 50 DAV
50 DAV is 398,000 | $42.46
-10.62%
| 12/4/2023 | $39.88 | PP = $41.62 | | MB = $43.70 | Most Recent Note - 1/12/2024 5:02:05 PM
G - Slumped back below its 50 DMA line ($39.08) with today''s loss following 4 gains. A prompt rebound above the 50 DMA line is needed for its outlook to improve.
>>> FEATURED STOCK ARTICLE : Negative Reversals are Signs of Distributional Pressure - 12/22/2023 | View all notes | Set NEW NOTE alert | Company Profile | SEC News | Chart | Request a new note C A S I | LULU - NASDAQ
lululemon athletica
Retail-Apparel/Shoes/Acc | $468.46 | -2.27
-0.48% | $469.58 | 1,315,363
87.87% of 50 DAV
50 DAV is 1,497,000 | $516.39
-9.28%
| 12/8/2023 | $490.61 | PP = $485.93 | | MB = $510.23 | Most Recent Note - 1/16/2024 2:39:02 PM
Y - Slumping near its 50 DMA line ($464) which defines important near-term support to watch. Retreat below its 2021 high of $485 raised concerns, negating its recent breakout from a 2+ year base.
>>> FEATURED STOCK ARTICLE : Perched at All-Time High With Volume Totals Cooling - 12/27/2023 | View all notes | Set NEW NOTE alert | Company Profile | SEC News | Chart | Request a new note C A S I | Symbol/Exchange
Company Name
Industry Group | PRICE | CHANGE
(%Change) | Day High | Volume
(% DAV)
(% 50 day avg vol) | 52 Wk Hi
% From Hi | Featured
Date | Price
Featured | Pivot Featured | | Max Buy | CRWD - NASDAQ
CrowdStrike Holdings
Computer Sftwr-Security | $276.19 | -10.10
-3.53% | $283.23 | 4,395,894
134.55% of 50 DAV
50 DAV is 3,267,000 | $290.33
-4.87%
| 1/2/2024 | $246.42 | PP = $261.91 | | MB = $275.01 | Most Recent Note - 1/17/2024 12:19:42 PM
G - Pulling back near its "max buy" level with today's loss. Faces no resistance due to overhead supply. Prior high in the $261 area defines initial support to watch on pullbacks. Fundamentals remain strong.
>>> FEATURED STOCK ARTICLE : CrowdStrike Holdings Pulling Back After "3-Weeks Tight" Pattern - 1/3/2024 | View all notes | Set NEW NOTE alert | Company Profile | SEC News | Chart | Request a new note C A S I | ELF - NYSE
e.l.f. Beauty
Cosmetics/Personal Care | $163.10 | -0.83
-0.51% | $163.26 | 974,884
70.69% of 50 DAV
50 DAV is 1,379,000 | $164.71
-0.98%
| 1/2/2024 | $138.23 | PP = $153.63 | | MB = $161.31 | Most Recent Note - 1/16/2024 2:36:31 PM
G - Wedging to yet another new high and above its "max buy" level with today''s gain adding to a spurt of gains backed by below-average volume and its color code is changed to green. Fundamentals remain strong.
>>> FEATURED STOCK ARTICLE : Pulled Back After Closing 3 Weeks Tight - 1/2/2024 | View all notes | Set NEW NOTE alert | Company Profile | SEC News | Chart | Request a new note C A S I | KOF - NYSE
Coca-Cola Femsa ADR
Beverages-Non-Alcoholic | $90.90 | -0.44
-0.48% | $91.28 | 118,888
83.72% of 50 DAV
50 DAV is 142,000 | $99.34
-8.50%
| 1/12/2024 | $93.38 | PP = $99.34 | | MB = $104.31 | Most Recent Note - 1/12/2024 5:00:19 PM
Y - Posted a solid volume-driven gaink today. Color code was changed to yellow as a valid secondary buy point was noted up to +5% above the recent high since finding support at its 10 WMA line after an earlier breakout. Found prompt support near prior highs in the $90 area and above its 50 DMA line. Its Relative Strength Rating is currently 81, just above the 80+ minimum guideline for buy candidates. See the latest FSU analysis for more details and a new annotated graph.
>>> FEATURED STOCK ARTICLE : Secondary Buy Point Noted After Finding Support - 1/12/2024 | View all notes | Set NEW NOTE alert | Company Profile | SEC News | Chart | Request a new note C A S I |
|
|
|
Color Codes Explained :
Y - Better candidates highlighted by our
staff of experts.
G - Previously featured
in past reports as yellow but may no longer be buyable under the
guidelines.
***Last / Change / Volume data in this table is the closing quote data***
Symbol/Exchange
Company Name
Industry Group |
PRICE |
CHANGE
(%Change) |
Day High |
Volume
(% DAV)
(% 50 day avg vol) |
52 Wk Hi
% From Hi |
Featured
Date |
Price
Featured |
Pivot Featured |
|
Max Buy |
 ANET
-
NYSE
ANET
-
NYSE
Arista Networks
Computer-Networking
|
$253.26
|
+0.00
0.00% |
$257.21
|
3,107
0.17% of 50 DAV
50 DAV is 1,784,000
|
$254.73
-0.58%
|
10/31/2023
|
$188.84
|
PP = $198.80
|
|
MB = $208.74
|
Most Recent Note - 1/11/2024 11:08:42 PM
G - Posted a small gain today with light volume for another new all-time high. Its 50 DMA line ($224) defines near-term support above the prior low in the $210 area. Fundamentals remain strong.
>>> FEATURED STOCK ARTICLE : Extended From Base and Hovering at All-Time High - 12/26/2023 |
View all notes |
Set NEW NOTE alert |
Company Profile |
SEC
News |
Chart |
Request a new note
C
A
S
I |
NVO
-
NYSE
Novo Nordisk ADR
Medical-Ethical Drugs
|
$106.35
|
+0.00
0.00% |
$107.04
|
15,024
0.35% of 50 DAV
50 DAV is 4,264,000
|
$108.98
-2.41%
|
11/2/2023
|
$100.97
|
PP = $104.10
|
|
MB = $109.31
|
Most Recent Note - 1/11/2024 12:23:23 PM
Y - Pulling back today after challenging its all-time high. Prior highs in the $105 area define initial support above its 50 DMA line ($101.34).
>>> FEATURED STOCK ARTICLE : Gap Up Gain on Prior Session Triggered Technical Buy Signal - 1/5/2024 |
View all notes |
Set NEW NOTE alert |
Company Profile |
SEC
News |
Chart |
Request a new note
C
A
S
I |
QLYS
-
NASDAQ
Qualys
Computer Sftwr-Security
|
$192.18
|
+0.00
0.00% |
$194.30
|
20
0.01% of 50 DAV
50 DAV is 384,000
|
$206.35
-6.87%
|
11/3/2023
|
$167.50
|
PP = $165.03
|
|
MB = $173.28
|
Most Recent Note - 1/11/2024 11:11:40 PM
G - Posted a 3rd consecutive gain today with higher volume after finding prompt support near its 50 DMA line ($184). The 1/05/24 low ($180.01) defines important near-term support where more damaging losses would raise concerns.
>>> FEATURED STOCK ARTICLE : Posted Light Volume Gain Finding Support at 50-Day Moving Average - 1/8/2024 |
View all notes |
Set NEW NOTE alert |
Company Profile |
SEC
News |
Chart |
Request a new note
C
A
S
I |
AXON
-
NASDAQ
Axon Enterprise
Security/Sfty
|
$249.42
|
-0.05
-0.02% |
$251.61
|
31
0.01% of 50 DAV
50 DAV is 457,000
|
$260.69
-4.32%
|
11/8/2023
|
$127.84
|
PP = $223.30
|
|
MB = $234.47
|
Most Recent Note - 1/12/2024 5:04:05 PM
G - Posted a small gain today with average volume. Its 50-day moving average (DMA) line ($237) defines near-term support above prior highs in the $229-231 area.
>>> FEATURED STOCK ARTICLE : Consolidating Well Above Near-Term Support - 1/9/2024 |
View all notes |
Set NEW NOTE alert |
Company Profile |
SEC
News |
Chart |
Request a new note
C
A
S
I |
TDG
-
NYSE
TransDigm Group
Aerospace/Defense
|
$1,027.32
|
+0.00
0.00% |
$1,033.65
|
18
0.01% of 50 DAV
50 DAV is 224,000
|
$1,033.81
-0.63%
|
12/12/2023
|
$1,000.39
|
PP = $1,013.18
|
|
MB = $1,063.84
|
Most Recent Note - 1/11/2024 11:26:30 PM
Y - Hit a new high as it posted a 6th consecutive gain today with below-average volume. See the latest FSU analysis for more details and a new annotated graph.
>>> FEATURED STOCK ARTICLE : Inching to New Highs With 6th Consecutive Gain - 1/11/2024 |
View all notes |
Set NEW NOTE alert |
Company Profile |
SEC
News |
Chart |
Request a new note
C
A
S
I |
Symbol/Exchange
Company Name
Industry Group |
PRICE |
CHANGE
(%Change) |
Day High |
Volume
(% DAV)
(% 50 day avg vol) |
52 Wk Hi
% From Hi |
Featured
Date |
Price
Featured |
Pivot Featured |
|
Max Buy |
PANW
-
NASDAQ
Palo Alto Networks
Computer Sftwr-Security
|
$332.05
|
+0.00
0.00% |
$333.30
|
10,127
0.23% of 50 DAV
50 DAV is 4,446,000
|
$330.40
0.50%
|
1/10/2024
|
$313.65
|
PP = $318.00
|
|
MB = $333.90
|
Most Recent Note - 1/16/2024 2:40:32 PM
Y - Today's 6th consecutive gain with below-average volume has it hitting a new all-time high. Color code was changed to yellow while noting that a valid secondary buy point exists up to 5% above the prior high after finding support at its 10 WMA line since the prior breakout. Fundamentals remain strong.
>>> FEATURED STOCK ARTICLE : Consolidating After Volume-Driven Gains for All-Time Highs - 12/15/2023 |
View all notes |
Set NEW NOTE alert |
Company Profile |
SEC
News |
Chart |
Request a new note
C
A
S
I |
URI
-
NYSE
United Rentals
Comml Svcs-Leasing
|
$561.13
|
+0.00
0.00% |
$566.33
|
331
0.05% of 50 DAV
50 DAV is 674,000
|
$585.50
-4.16%
|
12/1/2023
|
$499.51
|
PP = $488.73
|
|
MB = $513.17
|
Most Recent Note - 1/12/2024 5:03:01 PM
G - Volume totals have been cooling while consolidating near its all-time high. Its 50 DMA line ($507) defines near-term support to watch above prior highs.
>>> FEATURED STOCK ARTICLE : Perched Near All-Time High Following Volume-Driven Gains - 12/19/2023 |
View all notes |
Set NEW NOTE alert |
Company Profile |
SEC
News |
Chart |
Request a new note
C
A
S
I |
AMPH
-
NASDAQ
Amphastar Pharm
Medical-Biomed/Biotech
|
$55.51
|
+0.01
0.02% |
$55.77
|
156
0.03% of 50 DAV
50 DAV is 499,000
|
$67.66
-17.96%
|
12/4/2023
|
$60.84
|
PP = $58.35
|
|
MB = $61.27
|
Most Recent Note - 1/16/2024 2:31:45 PM
G - Still lingering below its 50 DMA line ($56.71) after 5 consecutive volume-driven losses. Only a prompt rebound above the 50 DMA line would help its outlook improve. Fundamentals remain strong.
>>> FEATURED STOCK ARTICLE : Consolidating Above Pivot Point With Volume Cooling - 12/21/2023 |
View all notes |
Set NEW NOTE alert |
Company Profile |
SEC
News |
Chart |
Request a new note
C
A
S
I |
TBBK
-
NASDAQ
The Bancorp
Banks-Northeast
|
$37.80
|
+0.00
0.00% |
$38.52
|
6,243
1.55% of 50 DAV
50 DAV is 402,000
|
$42.46
-10.98%
|
12/4/2023
|
$39.88
|
PP = $41.62
|
|
MB = $43.70
|
Most Recent Note - 1/12/2024 5:02:05 PM
G - Slumped back below its 50 DMA line ($39.08) with today's loss following 4 gains. A prompt rebound above the 50 DMA line is needed for its outlook to improve.
>>> FEATURED STOCK ARTICLE : Negative Reversals are Signs of Distributional Pressure - 12/22/2023 |
View all notes |
Set NEW NOTE alert |
Company Profile |
SEC
News |
Chart |
Request a new note
C
A
S
I |
LULU
-
NASDAQ
lululemon athletica
Retail-Apparel/Shoes/Acc
|
$470.73
|
+0.00
0.00% |
$479.94
|
1,249
0.08% of 50 DAV
50 DAV is 1,496,000
|
$516.39
-8.84%
|
12/8/2023
|
$490.61
|
PP = $485.93
|
|
MB = $510.23
|
Most Recent Note - 1/16/2024 2:39:02 PM
Y - Slumping near its 50 DMA line ($464) which defines important near-term support to watch. Retreat below its 2021 high of $485 raised concerns, negating its recent breakout from a 2+ year base.
>>> FEATURED STOCK ARTICLE : Perched at All-Time High With Volume Totals Cooling - 12/27/2023 |
View all notes |
Set NEW NOTE alert |
Company Profile |
SEC
News |
Chart |
Request a new note
C
A
S
I |
Symbol/Exchange
Company Name
Industry Group |
PRICE |
CHANGE
(%Change) |
Day High |
Volume
(% DAV)
(% 50 day avg vol) |
52 Wk Hi
% From Hi |
Featured
Date |
Price
Featured |
Pivot Featured |
|
Max Buy |
CRWD
-
NASDAQ
CrowdStrike Holdings
Computer Sftwr-Security
|
$286.29
|
+0.00
0.00% |
$287.20
|
14,249
0.44% of 50 DAV
50 DAV is 3,255,000
|
$290.33
-1.39%
|
1/2/2024
|
$246.42
|
PP = $261.91
|
|
MB = $275.01
|
Most Recent Note - 1/16/2024 2:34:14 PM
G - Stubbornly holding its ground near its 52-week high with volume totals cooling. Faces no resistance due to overhead supply. Prior high in the $261 area defines initial support to watch on pullbacks. Fundamentals remain strong.
>>> FEATURED STOCK ARTICLE : CrowdStrike Holdings Pulling Back After "3-Weeks Tight" Pattern - 1/3/2024 |
View all notes |
Set NEW NOTE alert |
Company Profile |
SEC
News |
Chart |
Request a new note
C
A
S
I |
ELF
-
NYSE
e.l.f. Beauty
Cosmetics/Personal Care
|
$163.93
|
+0.00
0.00% |
$164.71
|
1,662
0.12% of 50 DAV
50 DAV is 1,410,000
|
$161.06
1.78%
|
1/2/2024
|
$138.23
|
PP = $153.63
|
|
MB = $161.31
|
Most Recent Note - 1/16/2024 2:36:31 PM
G - Wedging to yet another new high and above its "max buy" level with today's gain adding to a spurt of gains backed by below-average volume and its color code is changed to green. Fundamentals remain strong.
>>> FEATURED STOCK ARTICLE : Pulled Back After Closing 3 Weeks Tight - 1/2/2024 |
View all notes |
Set NEW NOTE alert |
Company Profile |
SEC
News |
Chart |
Request a new note
C
A
S
I |
KOF
-
NYSE
Coca-Cola Femsa ADR
Beverages-Non-Alcoholic
|
$91.34
|
+0.00
0.00% |
$92.25
|
1
0.00% of 50 DAV
50 DAV is 141,000
|
$99.34
-8.05%
|
1/12/2024
|
$93.38
|
PP = $99.34
|
|
MB = $104.31
|
Most Recent Note - 1/12/2024 5:00:19 PM
Y - Posted a solid volume-driven gaink today. Color code was changed to yellow as a valid secondary buy point was noted up to +5% above the recent high since finding support at its 10 WMA line after an earlier breakout. Found prompt support near prior highs in the $90 area and above its 50 DMA line. Its Relative Strength Rating is currently 81, just above the 80+ minimum guideline for buy candidates. See the latest FSU analysis for more details and a new annotated graph.
>>> FEATURED STOCK ARTICLE : Secondary Buy Point Noted After Finding Support - 1/12/2024 |
View all notes |
Set NEW NOTE alert |
Company Profile |
SEC
News |
Chart |
Request a new note
C
A
S
I |
|
|
|
THESE ARE NOT BUY RECOMMENDATIONS!
Comments contained in the body of this report are technical
opinions only. The material herein has been obtained
from sources believed to be reliable and accurate, however,
its accuracy and completeness cannot be guaranteed.
This site is not an investment advisor, hence it does
not endorse or recommend any securities or other investments.
Any recommendation contained in this report may not
be suitable for all investors and it is not to be deemed
an offer or solicitation on our part with respect to
the purchase or sale of any securities. All trademarks,
service marks and trade names appearing in this report
are the property of their respective owners, and are
likewise used for identification purposes only.
This report is a service available
only to active Paid Premium Members.
You may opt-out of receiving report notifications
at any time. Questions or comments may be submitted
by writing to Premium Membership Services 665 S.E. 10 Street, Suite 201 Deerfield Beach, FL 33441-5634 or by calling 1-800-965-8307
or 954-785-1121.
|
|
|