You are not logged in.
This means you
CAN ONLY VIEW reports that were published prior to Thursday, March 20, 2025.
You
MUST UPGRADE YOUR MEMBERSHIP if you want to see any current reports.
AFTER MARKET UPDATE - THURSDAY, FEBRUARY 22ND, 2024
Previous After Market Report Next After Market Report >>>
|
|
|
|
DOW |
+456.87 |
39,069.11 |
+1.18% |
|
Volume |
964,896,765 |
+7% |
|
Volume |
5,685,729,500 |
+16% |
|
NASDAQ |
+460.75 |
16,041.62 |
+2.96% |
|
Advancers |
1,692 |
62% |
|
Advancers |
2,264 |
54% |
|
S&P 500 |
+105.23 |
5,087.03 |
+2.11% |
|
Decliners |
1,051 |
38% |
|
Decliners |
1,965 |
46% |
|
Russell 2000 |
+19.09 |
2,013.84 |
+0.96% |
|
52 Wk Highs |
210 |
|
|
52 Wk Highs |
251 |
|
|
S&P 600 |
+3.79 |
1,291.60 |
+0.29% |
|
52 Wk Lows |
38 |
|
|
52 Wk Lows |
111 |
|
|
 |
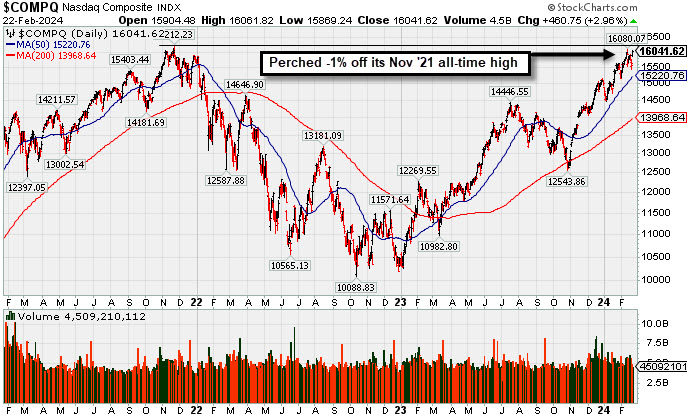
Indices Rose With Higher Volume Totals and Greater Leadership
Kenneth J. Gruneisen - Passed the CAN SLIM® Master's Exam
The S&P 500 (+2.1%) and Dow Jones Industrials Average (+1.2%) set new record closing highs while the Nasdaq Composite logged a 3.0% gain. Volume was reported higher than the prior session totals on the NYSE and on the Nasdaq exchange, action indicative of an increase in institutional buying demand. Advancers led decliners by an 8-5 margin on the NYSE and by just an 11-10 margin on the Nasdaq exchange. There were 119 high-ranked companies from the Leaders List that hit new 52-week highs and were listed on the BreakOuts Page, up solidly from the total of 36 on the prior session. New 52-week highs totals expanded and outnumbered new 52-week lows totals on the NYSE and on the Nasdaq exchange. The major indices are in a confirmed uptrend (M criteria). New buying efforts should be only made in stocks fitting all key criteria of the fact-based investment system.
PICTURED: The Nasdaq Composite Index is perched -1% off its November 2021 all-time high.
Thanks to NVIDIA's (NVDA +16.4%) much better than expected earnings results the market had a very positive session. Enthusiasm returned to AI-related stocks and semiconductor shares. Ten of the 11 S&P 500 sectors closed with gains. The information technology sector saw a +4.4% increase while the consumer discretionary (+2.2%) and communication services (+1.6%) sectors followed. The utilities sector (-0.8%) was alone as it finished in negative territory.
Fed Vice Chair Jefferson said that it will likely be appropriate to begin cutting rates later this year, adding that he is cautiously optimistic about the way inflation is evolving. Also, Philadelphia Fed President Harker (not an FOMC voter) said he believes the Fed may be in a position to see the fed funds rate decrease this year, but cautions anyone looking for it right now and right away.
Etsy (ETSY -8.44%) saw the largest decline in the S&P 500 after disappointing quarterly results. EV makers Rivian Automotive (RIVN -25.60%) and Lucid Group (LCID -16.76%) both fell following disappointing results.
The 2-yr note yield climbed five basis points to 4.72% and the 10-yr note yield settled unchanged at 4.33%. There was little reaction to the release of another low initial jobless claims reading (201,000).
|
 Kenneth J. Gruneisen started out as a licensed stockbroker in August 1987, a couple of months prior to the historic stock market crash that took the Dow Jones Industrial Average down -22.6% in a single day. He has published daily fact-based fundamental and technical analysis on high-ranked stocks online for two decades. Through FACTBASEDINVESTING.COM, Kenneth provides educational articles, news, market commentary, and other information regarding proven investment systems that work in good times and bad.
Comments contained in the body of this report are technical opinions only and are not necessarily those of Gruneisen Growth Corp. The material herein has been obtained from sources believed to be reliable and accurate, however, its accuracy and completeness cannot be guaranteed. Our firm, employees, and customers may effect transactions, including transactions contrary to any recommendation herein, or have positions in the securities mentioned herein or options with respect thereto. Any recommendation contained in this report may not be suitable for all investors and it is not to be deemed an offer or solicitation on our part with respect to the purchase or sale of any securities. |
|
 |
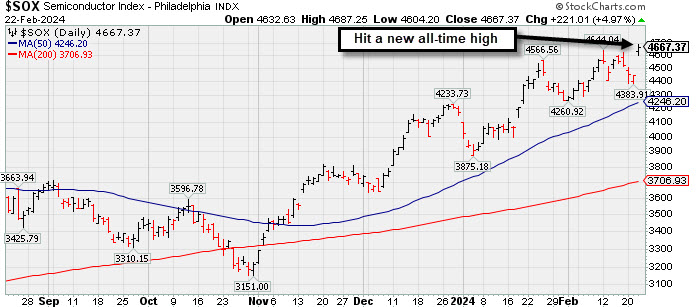
Semiconductor and Retail Indexes Led Gainers; Gold & Silver Index Fell
Kenneth J. Gruneisen - Passed the CAN SLIM® Master's Exam
The Retail Index ($RLX +2.74%) posted a solid gain. The Broker/Dealer Index ($XBD +1.15%) outpaced the Bank Index ($BKX +0.30%). The tech sector had a positive bias as the Semiconductor Index ($SOX +4.97%) posted a standout gain while the Networking Index ($NWX+2.03%) followed and the Biotech Index ($BTK +0.95%) posted a smaller gain. The Oil Services Index ($OSX +0.51%) and Integrated Oil Index ($XOI +0.34%) both posted small gains. Meanwhile, the Gold & Silver Index ($XAU -2.05%) clearly was a laggard as it lost ground.
![]() PICTURED: The Semiconductor Index ($SOX +4.97%) gapped up and hit a new all-time high thanks to a huge gain from NVIDIA.
| Oil Services |
$OSX |
81.52 |
+0.42 |
+0.51% |
-2.81% |
| Integrated Oil |
$XOI |
1,941.54 |
+6.63 |
+0.34% |
+4.25% |
| Semiconductor |
$SOX |
4,667.37 |
+221.01 |
+4.97% |
+11.78% |
| Networking |
$NWX |
816.31 |
+16.21 |
+2.03% |
-1.98% |
| Broker/Dealer |
$XBD |
563.45 |
+6.38 |
+1.15% |
+1.11% |
| Retail |
$RLX |
4,330.86 |
+115.30 |
+2.74% |
+11.37% |
| Gold & Silver |
$XAU |
104.85 |
-2.20 |
-2.05% |
-16.58% |
| Bank |
$BKX |
95.49 |
+0.37 |
+0.39% |
-0.56% |
| Biotech |
$BTK |
5,156.58 |
+48.73 |
+0.95% |
-4.84% |
|
|
|
 |
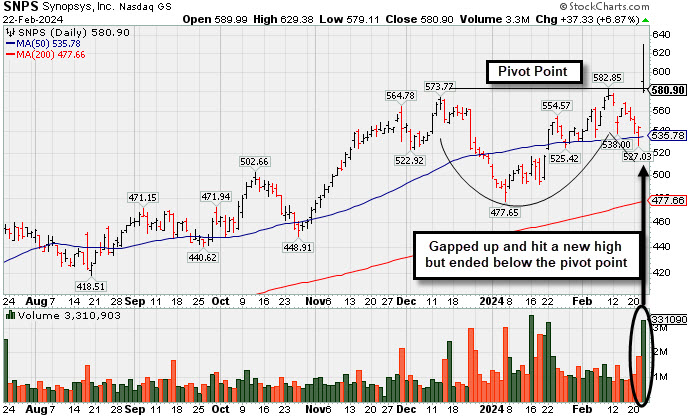
Gapped Up for New High But Ended Near Session Low
Kenneth J. Gruneisen - Passed the CAN SLIM® Master's Exam
Synopsys Inc (SNPS +$36.99 or +6.81% top $580.56) posted a volume-driven gain but ended near the session low. It closed below the pivot point cited after highlighted in yellow in the earlier mid-day report (read here) with pivot point cited based on its 2/09/24 high after a cup-with-handle base. Members were cautioned - "A strong close above the pivot point is needed to clinch a proper technical buy signal." It had gapped up hitting a new all-time high, however its afternoon slump and weak close on the session was action indicative of distributional pressure. Confirming volume-driven gains and a close above the pivot point would be a reassuring sign of fresh institutional buying demand that could lead to a sustained and meanful advance in price. SNPS found prompt support recently at its 50-day moving average (DMA) line ($536).
SNPS reported Jan '24 quarterly earnings +36% on +21% sales revenues versus the year ago period, its 3rd strong quarter above the +25% minimum earnings guideline (C criteria). Annual earnings growth (A criteria) has been strong and steady. It has a 99 Earnings Per Share Rating.
The number of top-rated funds owning its shares rose from 2,896 in Mar '23 to 3,315 in Dec '23, a reassuring sign concerning the I criteria. Its current Up/Down Volume Ratio of 0.9 is an unbiased indication its shares have been under slight distributiojnal pressure over the past 50 days. It has a Timeliness Rating of A and Sponsorship Rating of B. |
|
|
Color Codes Explained :
Y - Better candidates highlighted by our
staff of experts.
G - Previously featured
in past reports as yellow but may no longer be buyable under the
guidelines.
***Last / Change / Volume data in this table is the closing quote data***
Symbol/Exchange
Company Name
Industry Group |
PRICE |
CHANGE
(%Change) |
Day High |
Volume
(% DAV)
(% 50 day avg vol) |
52 Wk Hi
% From Hi |
Featured
Date |
Price
Featured |
Pivot Featured |
|
Max Buy |
 ANET
-
NYSE
ANET
-
NYSE
Arista Networks
Computer-Networking
|
$268.76
|
+14.27
5.61% |
$270.18
|
3,619,894
167.36% of 50 DAV
50 DAV is 2,163,000
|
$292.66
-8.17%
|
10/31/2023
|
$188.84
|
PP = $198.80
|
|
MB = $208.74
|
 Most Recent Note - 2/22/2024 5:56:51 PM
G - Posted a solid volume-driven gain today. Extended from any sound base. Its 50 DMA line ($252) defines important near-term support to watch on pullbacks.
>>> FEATURED STOCK ARTICLE : Pulled Back From All Time High With Gap Down on Prior Session - 2/1/2024 |
View all notes |
Set NEW NOTE alert |
Company Profile |
SEC
News |
Chart |
Request a new note
C
A
S
I |
NVO
-
NYSE
Novo Nordisk ADR
Medical-Ethical Drugs
|
$124.52
|
+3.59
2.97% |
$124.87
|
3,582,656
77.63% of 50 DAV
50 DAV is 4,615,000
|
$124.76
-0.19%
|
11/2/2023
|
$100.97
|
PP = $104.10
|
|
MB = $109.31
|
Most Recent Note - 2/16/2024 1:04:42 PM
G - extended from any sound base and hitting yet another new all-time high with today's gain. Its 50 DMA line ($107.53) defines important near-term support to watch on pullbacks.
>>> FEATURED STOCK ARTICLE : Extended From Any Sound Base After Volume-Driven Gains - 2/8/2024 |
View all notes |
Set NEW NOTE alert |
Company Profile |
SEC
News |
Chart |
Request a new note
C
A
S
I |
AXON
-
NASDAQ
Axon Enterprise
Security/Sfty
|
$271.42
|
+7.69
2.92% |
$272.31
|
281,322
75.83% of 50 DAV
50 DAV is 371,000
|
$274.78
-1.22%
|
11/8/2023
|
$127.84
|
PP = $223.30
|
|
MB = $234.47
|
Most Recent Note - 2/20/2024 7:06:12 PM
G - Hovering near its all-time high. Prior highs in the $260-262 area define initial support to watch above its 50-day moving average (DMA) line ($254.91).
>>> FEATURED STOCK ARTICLE : Reversal at All-Time High After 7 Consecutive Gains - 2/12/2024 |
View all notes |
Set NEW NOTE alert |
Company Profile |
SEC
News |
Chart |
Request a new note
C
A
S
I |
TDG
-
NYSE
TransDigm Group
Aerospace/Defense
|
$1,192.95
|
+28.60
2.46% |
$1,195.47
|
261,721
122.87% of 50 DAV
50 DAV is 213,000
|
$1,165.08
2.39%
|
12/12/2023
|
$1,000.39
|
PP = $1,013.18
|
|
MB = $1,063.84
|
Most Recent Note - 2/21/2024 4:44:38 PM
G - Inched higher with below-average volume for a best-ever close today. Its 50 DMA line ($1,053) defines near-term support to watch above prior highs in the $1,013-1,015 area.
>>> FEATURED STOCK ARTICLE : Transdigm Perched Near All-Time High - 2/14/2024 |
View all notes |
Set NEW NOTE alert |
Company Profile |
SEC
News |
Chart |
Request a new note
C
A
S
I |
TBBK
-
NASDAQ
The Bancorp
Banks-Northeast
|
$43.18
|
-0.42
-0.96% |
$43.83
|
261,726
56.65% of 50 DAV
50 DAV is 462,000
|
$47.11
-8.34%
|
1/22/2024
|
$40.87
|
PP = $42.56
|
|
MB = $44.69
|
Most Recent Note - 2/16/2024 1:06:20 PM
Y - Consolidating well above prior highs in the $42 area and its 50 DMA liner which define near-term support to watch. Fundamentals remain strong.
>>> FEATURED STOCK ARTICLE : Volume-Driven Breakout Triggered Buy Signal After Earnings Report - 1/26/2024 |
View all notes |
Set NEW NOTE alert |
Company Profile |
SEC
News |
Chart |
Request a new note
C
A
S
I |
Symbol/Exchange
Company Name
Industry Group |
PRICE |
CHANGE
(%Change) |
Day High |
Volume
(% DAV)
(% 50 day avg vol) |
52 Wk Hi
% From Hi |
Featured
Date |
Price
Featured |
Pivot Featured |
|
Max Buy |
LULU
-
NASDAQ
lululemon athletica
Retail-Apparel/Shoes/Acc
|
$455.26
|
+11.80
2.66% |
$457.36
|
1,092,653
76.95% of 50 DAV
50 DAV is 1,420,000
|
$516.39
-11.84%
|
12/8/2023
|
$490.61
|
PP = $485.93
|
|
MB = $510.23
|
Most Recent Note - 2/22/2024 6:03:00 PM
G - Posted a gain today with below-average volume. Still lingering below its 50 DMA line ($481) which is now downward sloping and may act as resistance. A rebound above the 50 DMA line is needed to help its outlook improve.
>>> FEATURED STOCK ARTICLE : Violation of 50-Day Moving Average Hurt Outlook - 2/2/2024 |
View all notes |
Set NEW NOTE alert |
Company Profile |
SEC
News |
Chart |
Request a new note
C
A
S
I |
CRWD
-
NASDAQ
CrowdStrike Holdings
Computer Sftwr-Security
|
$310.80
|
+18.44
6.31% |
$313.66
|
4,741,973
149.49% of 50 DAV
50 DAV is 3,172,000
|
$338.45
-8.17%
|
1/2/2024
|
$246.42
|
PP = $261.91
|
|
MB = $275.01
|
Most Recent Note - 2/22/2024 5:58:58 PM
G - Gapped up today and posted a volume-driven gain, recovering much of the prior session's volume-driven loss after testing support near its 50 DMA line ($284). Fundamentals remain strong.
>>> FEATURED STOCK ARTICLE : Volume Totals Cooking While Stubbornly Perched at All-Time High - 2/6/2024 |
View all notes |
Set NEW NOTE alert |
Company Profile |
SEC
News |
Chart |
Request a new note
C
A
S
I |
ELF
-
NYSE
e.l.f. Beauty
Cosmetics/Personal Care
|
$182.37
|
+10.04
5.83% |
$183.62
|
1,160,549
78.79% of 50 DAV
50 DAV is 1,473,000
|
$179.58
1.55%
|
1/2/2024
|
$138.23
|
PP = $153.63
|
|
MB = $161.31
|
Most Recent Note - 2/22/2024 6:00:05 PM
G - Posted a gain today with below-average volume for a new all-time high. Reported Dec '23 quarterly earnings +54% on +85% sales revenues versus the year-ago period, continuing its strong earnings track record. Its 50 DMA line ($156) defines important near-term support to watch.
>>> FEATURED STOCK ARTICLE : Peched at All-Time High With Earnings News Due - 2/5/2024 |
View all notes |
Set NEW NOTE alert |
Company Profile |
SEC
News |
Chart |
Request a new note
C
A
S
I |
KOF
-
NYSE
Coca-Cola Femsa ADR
Beverages-Non-Alcoholic
|
$100.41
|
-0.29
-0.29% |
$101.45
|
141,245
90.54% of 50 DAV
50 DAV is 156,000
|
$104.38
-3.80%
|
1/12/2024
|
$93.38
|
PP = $99.34
|
|
MB = $104.31
|
Most Recent Note - 2/21/2024 5:20:45 PM
Y - Held its ground today following a "negative reversal" at its all-time high on the prior session. Due to report Dec '23 quarterly results on 2/22/24. Volume and volatility often increase near earnings news. Its 50 DMA line ($94.41) defines important near-term support to watch on pullbacks. See the latest FSU analysis for more details and a new annotated graph.
>>> FEATURED STOCK ARTICLE : Perched at High With Earnings News Due - 2/21/2024 |
View all notes |
Set NEW NOTE alert |
Company Profile |
SEC
News |
Chart |
Request a new note
C
A
S
I |
PCAR
-
NASDAQ
Paccar
Trucks and Parts-Hvy Duty
|
$110.52
|
+1.85
1.70% |
$110.67
|
1,875,488
82.44% of 50 DAV
50 DAV is 2,275,000
|
$108.71
1.66%
|
1/23/2024
|
$100.35
|
PP = $98.57
|
|
MB = $103.50
|
Most Recent Note - 2/20/2024 7:10:03 PM
G - Hovering near its all-time high, extended from any sound base. Reported Dec '23 quarterly earnings +53% on +11% sales revenues versus the year-ago period, its 9th quarterly comparison with better than the +25% minimum earnings guideline (C criteria). There was a downturn in FY' 20 annual earnings (A criteria) like many companies during the pandemic.
>>> FEATURED STOCK ARTICLE : Volume-Driven Breakout for Paccar - 1/23/2024 |
View all notes |
Set NEW NOTE alert |
Company Profile |
SEC
News |
Chart |
Request a new note
C
A
S
I |
Symbol/Exchange
Company Name
Industry Group |
PRICE |
CHANGE
(%Change) |
Day High |
Volume
(% DAV)
(% 50 day avg vol) |
52 Wk Hi
% From Hi |
Featured
Date |
Price
Featured |
Pivot Featured |
|
Max Buy |
HUBB
-
NYSE
Hubbell
Electrical-Power/Equipmt
|
$364.72
|
+10.57
2.98% |
$365.47
|
675,161
172.23% of 50 DAV
50 DAV is 392,000
|
$364.76
-0.01%
|
1/30/2024
|
$343.26
|
PP = $336.83
|
|
MB = $353.67
|
Most Recent Note - 2/22/2024 6:01:17 PM
G - Posted a volume-driven gain today for a new all-time high, extended from the previously noted base. Prior high ($340) defines initial support to watch on pullbacks.
>>> FEATURED STOCK ARTICLE : Volume Heavy Behind Breakout Gain for Hubbell - 1/30/2024 |
View all notes |
Set NEW NOTE alert |
Company Profile |
SEC
News |
Chart |
Request a new note
C
A
S
I |
MANH
-
NASDAQ
Manhattan Associates
Computer Sftwr-Enterprse
|
$248.29
|
+6.71
2.78% |
$249.50
|
273,141
67.11% of 50 DAV
50 DAV is 407,000
|
$258.91
-4.10%
|
1/31/2024
|
$240.57
|
PP = $230.71
|
|
MB = $242.25
|
Most Recent Note - 2/20/2024 7:07:52 PM
G - Pulling back from its all-time high with light volume behind today's 3rd consecutive loss. Prior highs in the $230 area define near-term support to watch on pullbacks.
>>> FEATURED STOCK ARTICLE : Big Volume Behind Breakout Gain - 1/31/2024 |
View all notes |
Set NEW NOTE alert |
Company Profile |
SEC
News |
Chart |
Request a new note
C
A
S
I |
TENB
-
NASDAQ
Tenable Holdings
Internet-Content
|
$47.20
|
+0.55
1.18% |
$48.05
|
1,240,769
120.26% of 50 DAV
50 DAV is 1,031,700
|
$53.50
-11.78%
|
2/7/2024
|
$49.50
|
PP = $49.87
|
|
MB = $52.36
|
Most Recent Note - 2/21/2024 12:52:23 PM
G - Gapped down today and violated its 50 DMA line with a volume-driven loss triggering a technical sell signal and its color code is changed to green. A prompt rebound above the 50 DMA line ($46.67) is needed for its outlook to improve. Fundamentals remain strong.
>>> FEATURED STOCK ARTICLE : Gap Up Gain Followed Latest Earnings Report - 2/7/2024 |
View all notes |
Set NEW NOTE alert |
Company Profile |
SEC
News |
Chart |
Request a new note
C
A
S
I |
USLM
-
NASDAQ
U.S. Lime & Minerals
Bldg-Cement/Concrt/Ag
|
$250.27
|
+5.41
2.21% |
$250.27
|
7,928
44.04% of 50 DAV
50 DAV is 18,000
|
$266.88
-6.22%
|
2/9/2024
|
$254.68
|
PP = $265.09
|
|
MB = $278.34
|
Most Recent Note - 2/20/2024 7:04:04 PM
Y - Retreating from its all-time high with today's loss on average volume. Finished strong and managed a best-ever close after highlighted in yellow in the 2/09/24 mid-day report with pivot point cited based on its 1/24/24 high plus 10 cents. Subsequent gains and a close above the pivot point backed by at least +40% above average volume may trigger a conviciing new technical buy signal. Through Dec '23 its quarterly and annual earnings (C and A criteria) history has been strong, a good match with the fact-based investment system's guidelines. Thinly traded firm has only 5.7 million shares outstanding (S criteria), which can contribute to greater price volatility in the event of institutional buying or selling.
>>> FEATURED STOCK ARTICLE : Strong Finish for Thinly Traded U.S Lime & Minerals - 2/9/2024 |
View all notes |
Set NEW NOTE alert |
Company Profile |
SEC
News |
Chart |
Request a new note
C
A
S
I |
NOW
-
NYSE
ServiceNow
Computer Sftwr-Enterprse
|
$769.21
|
+21.27
2.84% |
$791.87
|
2,136,933
182.49% of 50 DAV
50 DAV is 1,171,000
|
$815.32
-5.66%
|
2/22/2024
|
$771.75
|
PP = $815.32
|
|
MB = $856.09
|
Most Recent Note - 2/22/2024 1:04:15 PM
Y - Color code is changed to yellow as a valid secondary buy point exists up to +5% above the latest high after finding support at its 10 WMA line following an earlier breakout. Reported Dec '23 quarterly earnings +36% on +26% sales revenues versus the year-ago period, its 6th quarterly comparison above the +25% minimum guideline (C criteria) of the fact-based investment system. Went through a deep consolidation since noted with caution in the 10/28/21 mid-day report near its all-time high.
>>> FEATURED STOCK ARTICLE : Hit New Highs With Latest Gains Backed by Light Volume - 2/5/2021 |
View all notes |
Set NEW NOTE alert |
Company Profile |
SEC
News |
Chart |
Request a new note
C
A
S
I |
Symbol/Exchange
Company Name
Industry Group |
PRICE |
CHANGE
(%Change) |
Day High |
Volume
(% DAV)
(% 50 day avg vol) |
52 Wk Hi
% From Hi |
Featured
Date |
Price
Featured |
Pivot Featured |
|
Max Buy |
SNPS
-
NASDAQ
Synopsys
Computer Sftwr-Design
|
$580.56
|
+36.99
6.81% |
$629.38
|
3,284,848
233.30% of 50 DAV
50 DAV is 1,408,000
|
$582.85
-0.39%
|
2/22/2024
|
$600.65
|
PP = $582.85
|
|
MB = $611.99
|
Most Recent Note - 2/22/2024 5:55:08 PM
Y - Gapped up and hit a new all-time high today but encountered distributional pressure and ended near the session low, closing below the pivot point cited based on its 2/09/24 high after a cup-with-handle base. A strong close above the pivot point is needed to clinch a proper technical buy signal. Found support recently at its 50 DMA line ($536). Reported Jan '24 quarterly earnings +36% on +21% sales revenues versus the year-ago period, its 3rd strong quarter above the +25% minimum earnings guideline (C criteria). Annual earnings growth (A criteria) has been strong and steady. See the latest FSU analysis for more details and a new annotated graph.
>>> FEATURED STOCK ARTICLE : Gapped Up for New High But Ended Near Session Low - 2/22/2024 |
View all notes |
Set NEW NOTE alert |
Company Profile |
SEC
News |
Chart |
Request a new note
C
A
S
I |
|
|
|
THESE ARE NOT BUY RECOMMENDATIONS!
Comments contained in the body of this report are technical
opinions only. The material herein has been obtained
from sources believed to be reliable and accurate, however,
its accuracy and completeness cannot be guaranteed.
This site is not an investment advisor, hence it does
not endorse or recommend any securities or other investments.
Any recommendation contained in this report may not
be suitable for all investors and it is not to be deemed
an offer or solicitation on our part with respect to
the purchase or sale of any securities. All trademarks,
service marks and trade names appearing in this report
are the property of their respective owners, and are
likewise used for identification purposes only.
This report is a service available
only to active Paid Premium Members.
You may opt-out of receiving report notifications
at any time. Questions or comments may be submitted
by writing to Premium Membership Services 665 S.E. 10 Street, Suite 201 Deerfield Beach, FL 33441-5634 or by calling 1-800-965-8307
or 954-785-1121.
|
|
|