You are not logged in.
This means you
CAN ONLY VIEW reports that were published prior to Tuesday, March 25, 2025.
You
MUST UPGRADE YOUR MEMBERSHIP if you want to see any current reports.
AFTER MARKET UPDATE - FRIDAY, FEBRUARY 2ND, 2024
Previous After Market Report Next After Market Report >>>
|
|
|
|
DOW |
-54.11 |
38,465.73 |
-0.14% |
|
Volume |
321,231,571 |
-68% |
|
Volume |
2,765,615,600 |
-46% |
|
NASDAQ |
+270.81 |
15,632.45 |
+1.76% |
|
Advancers |
660 |
24% |
|
Advancers |
1,219 |
30% |
|
S&P 500 |
+51.99 |
4,958.18 |
+1.06% |
|
Decliners |
2,103 |
76% |
|
Decliners |
2,912 |
70% |
|
Russell 2000 |
-14.05 |
1,960.37 |
-0.71% |
|
52 Wk Highs |
113 |
|
|
52 Wk Highs |
120 |
|
|
S&P 600 |
-12.57 |
1,267.12 |
-0.98% |
|
52 Wk Lows |
43 |
|
|
52 Wk Lows |
147 |
|
|
 |
Major Indices Rallied for Solid Gains
Kenneth J. Gruneisen - Passed the CAN SLIM® Master's Exam
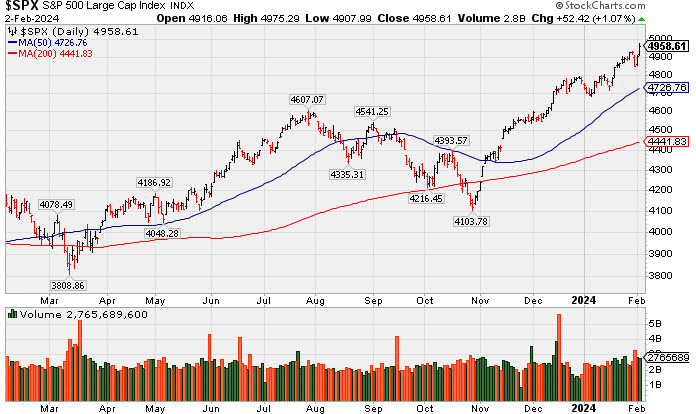
The S&P 500 (+1.1%) and Dow Jones Industrial Average (+0.4%) set fresh record closing highs on Friday while the Nasdaq Composite logged a 1.7% gain. Volume was reported lighter than the prior session totals on the NYSE and on the Nasdaq exchange. Breadth was negative as decliners led advancers by more than a 3-1 margin on the NYSE and by more than a 2-1 margin on the Nasdaq exchange. There were 79 high-ranked companies from the Leaders List that hit new 52-week highs and were listed on the BreakOuts Page versus 67 on the prior session. New 52-week highs totals outnumbered new lows on the NYSE while new lows outnumbered new highs on the Nasdaq exchange. The major indices are in a confirmed uptrend (M criteria). New buying efforts should be only made in stocks fitting all key criteria of the fact-based investment system.
PICTURED: The S&P 500 Index rallied to a new all-time high.
There was a much stronger than expected Employment Situation Report for January with a big upside surprise in payroll growth accompanied by a larger than expected increase in average hourly earnings. The jobs report sent Treasury yields higher as the 10-yr note yield rose 17 basis points to 4.03%. The 2-yr note yield rose 19 basis points to 4.38%. Rate-sensitive S&P 500 sectors faced pressure as the real estate (-1.3%) and utilities (-1.8%) sectors saw the steepest declines among the five sectors to finish lower. Communication services jumped 4.7%, consumer discretionary rose +2.5% and information technology +1.3% sectors were the best gainers. The industrial (+0.7%), financial (+0.5%), and energy (+0.2%) sectors also registered gains.
Big gains in shares of Meta Platforms (META +20.3%) and Amazon.com (AMZN +7.9%) followed earnings news. NVIDIA (NVDA +5.0%) also rose. Meanwhile, Apple (AAPL -0.5%) ended lower but improved after being down as much as -4% early following a relatively disappointing outlook for fiscal Q2 iPhone sales.
|
 Kenneth J. Gruneisen started out as a licensed stockbroker in August 1987, a couple of months prior to the historic stock market crash that took the Dow Jones Industrial Average down -22.6% in a single day. He has published daily fact-based fundamental and technical analysis on high-ranked stocks online for two decades. Through FACTBASEDINVESTING.COM, Kenneth provides educational articles, news, market commentary, and other information regarding proven investment systems that work in good times and bad.
Comments contained in the body of this report are technical opinions only and are not necessarily those of Gruneisen Growth Corp. The material herein has been obtained from sources believed to be reliable and accurate, however, its accuracy and completeness cannot be guaranteed. Our firm, employees, and customers may effect transactions, including transactions contrary to any recommendation herein, or have positions in the securities mentioned herein or options with respect thereto. Any recommendation contained in this report may not be suitable for all investors and it is not to be deemed an offer or solicitation on our part with respect to the purchase or sale of any securities. |
|
 |
Retail, Financial, and Semiconductor Indexes Rose
Kenneth J. Gruneisen - Passed the CAN SLIM® Master's Exam
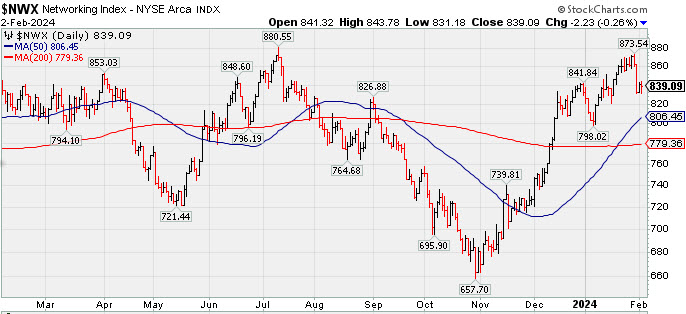
The Retail Index ($RLX +4.74%) posted a solid gain while the Broker/Dealer Index ($XBD +1.88%) and the Bank Index ($BKX +0.72%) also posted gains. The tech sector was mixed as the Semiconductor Index ($SOX +1.31%) rose while the Biotech Index ($BTK -1.17%) lost groud and the Networking Index ($NWX -0.26%) also edged lower. The Gold & Silver Index ($XAU -2.96%) and the Oil Services Index ($OSX -3.11%) both suffered large losses and the Integrated Oil Index ($XOI -0.39%) ended slightly lower.
![]() PICTURED: The Networking Index ($NWX -0.26%) is consolidating above its 50-day moving average (DMA) line.
| Oil Services |
$OSX |
78.67 |
-1.83 |
-2.28% |
-6.21% |
| Integrated Oil |
$XOI |
1,879.76 |
+6.46 |
+0.34% |
+0.93% |
| Semiconductor |
$SOX |
4,334.78 |
+54.30 |
+1.27% |
+3.82% |
| Networking |
$NWX |
837.57 |
-3.75 |
-0.45% |
+0.57% |
| Broker/Dealer |
$XBD |
549.60 |
+10.16 |
+1.88% |
-1.38% |
| Retail |
$RLX |
4,217.65 |
+170.35 |
+4.21% |
+8.46% |
| Gold & Silver |
$XAU |
113.25 |
-4.29 |
-3.65% |
-9.90% |
| Bank |
$BKX |
94.61 |
+0.55 |
+0.58% |
-1.46% |
| Biotech |
$BTK |
5,080.80 |
-81.25 |
-1.57% |
-6.24% |
|
|
|
 |
Violation of 50-Day Moving Average Hurt Outlook
Kenneth J. Gruneisen - Passed the CAN SLIM® Master's Exam
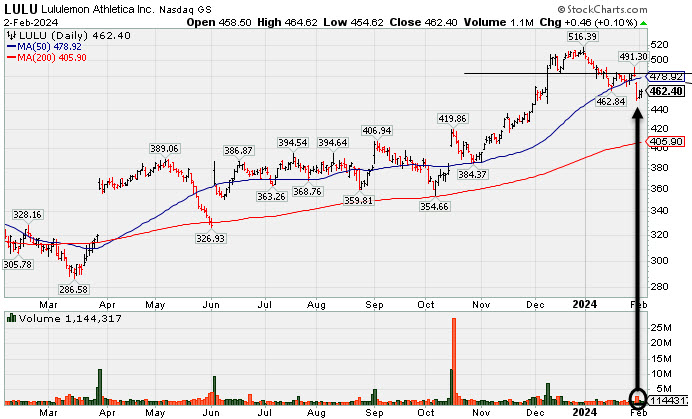
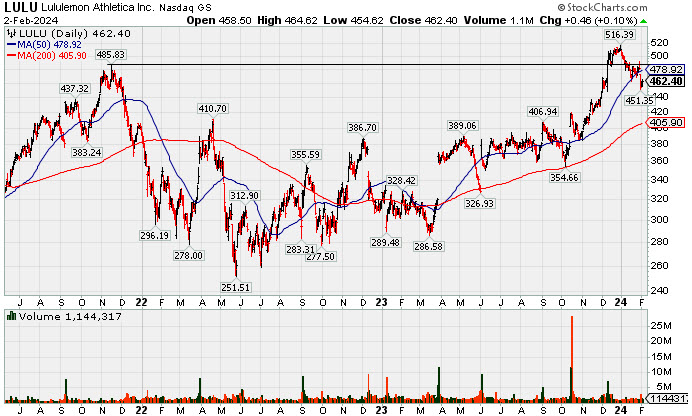
Lululemon Athletica (LULU -$0.59 or -0.13% to $461.35) held its ground for the past 2 sessions after gapping down on 1/31/24 violating its 50-day moving average (DMA) line ($478.92) triggering a technical sell signal. The technical damage hurt the near-term outlook after it had already been sputtering. Only a prompt rebound above the 50 DMA line would help its outlook improve. LULU was highlighted in yellow in the 12/08/23 mid-day report (read here) with pivot point cited based on its Nov '21 high plus 10 cents. It was shown in greater detail in this FSU section on 12/27/23 with an annotated graph on under the headline, "Perched at All-Time High With Volume Totals Cooling". Subsequent losses negated the breakout from a 2+ year base and raised noted concerns as it slumped back below $485. LULU reported Oct '23 quarterly earnings +27% on +19% sales revenues versus the year-ago period. Three of the 4 latest quarterly comparisons were above the +25% minimum earnings guideline (C criteria). Annual earnings (A criteria) had a downturn in FY '21. It currently has a 98 Earnings Per Share Rating. Its Timeliness rating is A and Sponsorship rating is C. The current Up/Down Volume Ratio of 1.4 is an unbiased indication its shares have been under accumulation over the past 50 days. The number of top-rated funds owning its shares rose from 2,104 in Mar '23 to 2,491 in Dec '23, a good sign concerning the I criteria.
Charts courtesy of www.stockcharts.com
 |
|
|
Color Codes Explained :
Y - Better candidates highlighted by our
staff of experts.
G - Previously featured
in past reports as yellow but may no longer be buyable under the
guidelines.
***Last / Change / Volume data in this table is the closing quote data***
Symbol/Exchange
Company Name
Industry Group |
PRICE |
CHANGE
(%Change) |
Day High |
Volume
(% DAV)
(% 50 day avg vol) |
52 Wk Hi
% From Hi |
Featured
Date |
Price
Featured |
Pivot Featured |
|
Max Buy |
 ANET
-
NYSE
ANET
-
NYSE
Arista Networks
Computer-Networking
|
$276.69
|
+13.71
5.21% |
$276.99
|
2,023,089
123.13% of 50 DAV
50 DAV is 1,643,000
|
$272.90
1.39%
|
10/31/2023
|
$188.84
|
PP = $198.80
|
|
MB = $208.74
|
 Most Recent Note - 2/2/2024 1:13:26 PM
G - Gapped up today rallying to a new all-time high. Extended from any sound base, its 50 DMA line ($239) defines near-term support above the prior low ($226.60 on 1/04/24) area. Fundamentals remain strong.
>>> FEATURED STOCK ARTICLE : Pulled Back From All Time High With Gap Down on Prior Session - 2/1/2024 |
View all notes |
Set NEW NOTE alert |
Company Profile |
SEC
News |
Chart |
Request a new note
C
A
S
I |
NVO
-
NYSE
Novo Nordisk ADR
Medical-Ethical Drugs
|
$114.09
|
-1.71
-1.47% |
$114.60
|
3,125,777
75.23% of 50 DAV
50 DAV is 4,155,000
|
$116.12
-1.75%
|
11/2/2023
|
$100.97
|
PP = $104.10
|
|
MB = $109.31
|
Most Recent Note - 1/31/2024 12:27:20 PM
G - Gapped up today rallying to a new all-time high above its "max buy" level, and its color code is changed to green. The recent low ($103.38 on 1/23/24) defines important near-term support nearly coinciding with its 50 DMA line ($103.39).
>>> FEATURED STOCK ARTICLE : Gap Up Gain on Prior Session Triggered Technical Buy Signal - 1/5/2024 |
View all notes |
Set NEW NOTE alert |
Company Profile |
SEC
News |
Chart |
Request a new note
C
A
S
I |
QLYS
-
NASDAQ
Qualys
Computer Sftwr-Security
|
$189.05
|
-1.35
-0.71% |
$190.67
|
90,044
24.81% of 50 DAV
50 DAV is 363,000
|
$206.35
-8.39%
|
1/24/2024
|
$196.27
|
PP = $206.45
|
|
MB = $216.77
|
Most Recent Note - 1/31/2024 5:52:39 PM
G - Sputtering below its 50 DMA line ($191) with today's loss backed by average volume. Only a prompt rebound above the 50 DMA line would help its outlook improve.
>>> FEATURED STOCK ARTICLE : Posted Light Volume Gain Finding Support at 50-Day Moving Average - 1/8/2024 |
View all notes |
Set NEW NOTE alert |
Company Profile |
SEC
News |
Chart |
Request a new note
C
A
S
I |
AXON
-
NASDAQ
Axon Enterprise
Security/Sfty
|
$257.21
|
+4.51
1.78% |
$258.34
|
134,353
35.73% of 50 DAV
50 DAV is 376,000
|
$262.95
-2.18%
|
11/8/2023
|
$127.84
|
PP = $223.30
|
|
MB = $234.47
|
Most Recent Note - 2/2/2024 1:49:12 PM
G - Posting a gain with below-average volume today while finding support above its 50-day moving average (DMA) line ($246.74). The 50 DMA line defines near-term support above prior low ($241.72 on 1/05/24).
>>> FEATURED STOCK ARTICLE : Consolidating Well Above Near-Term Support - 1/9/2024 |
View all notes |
Set NEW NOTE alert |
Company Profile |
SEC
News |
Chart |
Request a new note
C
A
S
I |
TDG
-
NYSE
TransDigm Group
Aerospace/Defense
|
$1,122.54
|
+8.86
0.80% |
$1,125.27
|
70,276
36.60% of 50 DAV
50 DAV is 192,000
|
$1,116.93
0.50%
|
12/12/2023
|
$1,000.39
|
PP = $1,013.18
|
|
MB = $1,063.84
|
Most Recent Note - 1/31/2024 5:49:30 PM
G - Posted a gain today for a new all-time high with above average volume. Prior highs in the $1,013-1,015 area define near-term support to watch on pullbacks.
>>> FEATURED STOCK ARTICLE : Inching to New Highs With 6th Consecutive Gain - 1/11/2024 |
View all notes |
Set NEW NOTE alert |
Company Profile |
SEC
News |
Chart |
Request a new note
C
A
S
I |
Symbol/Exchange
Company Name
Industry Group |
PRICE |
CHANGE
(%Change) |
Day High |
Volume
(% DAV)
(% 50 day avg vol) |
52 Wk Hi
% From Hi |
Featured
Date |
Price
Featured |
Pivot Featured |
|
Max Buy |
PANW
-
NASDAQ
Palo Alto Networks
Computer Sftwr-Security
|
$345.39
|
+5.42
1.59% |
$345.39
|
1,218,418
32.67% of 50 DAV
50 DAV is 3,729,000
|
$350.60
-1.49%
|
1/10/2024
|
$313.65
|
PP = $318.00
|
|
MB = $333.90
|
Most Recent Note - 1/31/2024 12:47:32 PM
G - Gapped down today yet still perched near its all-time high. Color code is changed to green after recently getting extended beyond the "max buy" level.
>>> FEATURED STOCK ARTICLE : Paused After 6 Gains to a New All-Time High - 1/17/2024 |
View all notes |
Set NEW NOTE alert |
Company Profile |
SEC
News |
Chart |
Request a new note
C
A
S
I |
URI
-
NYSE
United Rentals
Comml Svcs-Leasing
|
$653.81
|
+8.44
1.31% |
$656.21
|
199,373
28.00% of 50 DAV
50 DAV is 712,000
|
$658.51
-0.71%
|
1/24/2024
|
$576.90
|
PP = $585.60
|
|
MB = $614.88
|
Most Recent Note - 2/1/2024 5:55:07 PM
C - Posted a solid gain today with below-average volume. Prior high ($585.50) defines initial support to watch. Reported Dec '23 quarterly earnings +16% on +13% sales revenues versus the year-ago period, below the +25% minimum earnings guideline (C criteria) raising fundamental concerns.
>>> FEATURED STOCK ARTICLE : Negative Reversal After New High for United Rentals - 1/24/2024 |
View all notes |
Set NEW NOTE alert |
Company Profile |
SEC
News |
Chart |
Request a new note
C
A
S
I |
AMPH
-
NASDAQ
Amphastar Pharm
Medical-Biomed/Biotech
|
$52.76
|
-0.73
-1.36% |
$53.41
|
134,482
28.31% of 50 DAV
50 DAV is 475,000
|
$67.66
-22.02%
|
12/4/2023
|
$60.84
|
PP = $58.35
|
|
MB = $61.27
|
Most Recent Note - 1/31/2024 5:48:16 PM
G - Quietly slumped further below its 50 DMA line toward its 200 DMA line. A rebound above the 50 DMA line ($57.64) is needed for its outlook to improve. Fundamentals remain strong.
>>> FEATURED STOCK ARTICLE : Quietly Sinking Toward 200-Day Moving Average Line - 1/25/2024 |
View all notes |
Set NEW NOTE alert |
Company Profile |
SEC
News |
Chart |
Request a new note
C
A
S
I |
TBBK
-
NASDAQ
The Bancorp
Banks-Northeast
|
$42.77
|
+0.41
0.97% |
$43.29
|
177,783
39.60% of 50 DAV
50 DAV is 449,000
|
$47.11
-9.21%
|
1/22/2024
|
$40.87
|
PP = $42.56
|
|
MB = $44.69
|
Most Recent Note - 2/1/2024 5:49:03 PM
G - Pulled back today for a 2nd volume-driven loss. Prior highs in the $42 area define near-term support to watch. Reported Dec '23 quarterly earnings +34% on +16% sales revenues versus the year-ago period. Volume and volatility often increase near earnings news.
>>> FEATURED STOCK ARTICLE : Volume-Driven Breakout Triggered Buy Signal After Earnings Report - 1/26/2024 |
View all notes |
Set NEW NOTE alert |
Company Profile |
SEC
News |
Chart |
Request a new note
C
A
S
I |
LULU
-
NASDAQ
lululemon athletica
Retail-Apparel/Shoes/Acc
|
$461.35
|
-0.59
-0.13% |
$461.72
|
495,689
32.25% of 50 DAV
50 DAV is 1,537,000
|
$516.39
-10.66%
|
12/8/2023
|
$490.61
|
PP = $485.93
|
|
MB = $510.23
|
Most Recent Note - 1/31/2024 12:45:22 PM
G - Color code is changed to green after gapping down today and violating its 50 DMA line ($477) triggering a technical sell signal. Only a prompt rebound above the 50 DMA line would help its outlook improve.
>>> FEATURED STOCK ARTICLE : Violation of 50-Day Moving Average Hurt Outlook - 2/2/2024 |
View all notes |
Set NEW NOTE alert |
Company Profile |
SEC
News |
Chart |
Request a new note
C
A
S
I |
Symbol/Exchange
Company Name
Industry Group |
PRICE |
CHANGE
(%Change) |
Day High |
Volume
(% DAV)
(% 50 day avg vol) |
52 Wk Hi
% From Hi |
Featured
Date |
Price
Featured |
Pivot Featured |
|
Max Buy |
CRWD
-
NASDAQ
CrowdStrike Holdings
Computer Sftwr-Security
|
$304.56
|
+5.19
1.73% |
$305.21
|
1,168,857
34.63% of 50 DAV
50 DAV is 3,375,000
|
$307.55
-0.97%
|
1/2/2024
|
$246.42
|
PP = $261.91
|
|
MB = $275.01
|
Most Recent Note - 1/31/2024 12:50:16 PM
G - Hovering near its all-time high. Prior high in the $261 area defines initial support to watch above its 50 DMA line ($256). Fundamentals remain strong.
>>> FEATURED STOCK ARTICLE : CrowdStrike Holdings Pulling Back After "3-Weeks Tight" Pattern - 1/3/2024 |
View all notes |
Set NEW NOTE alert |
Company Profile |
SEC
News |
Chart |
Request a new note
C
A
S
I |
ELF
-
NYSE
e.l.f. Beauty
Cosmetics/Personal Care
|
$166.53
|
+4.03
2.48% |
$167.12
|
520,866
38.61% of 50 DAV
50 DAV is 1,349,000
|
$164.71
1.10%
|
1/2/2024
|
$138.23
|
PP = $153.63
|
|
MB = $161.31
|
Most Recent Note - 2/2/2024 1:44:54 PM
G - Hitting a new high and its color code is changed to green after rising above its "max buy" level. Fundamentals remain strong.
>>> FEATURED STOCK ARTICLE : Pulled Back After Closing 3 Weeks Tight - 1/2/2024 |
View all notes |
Set NEW NOTE alert |
Company Profile |
SEC
News |
Chart |
Request a new note
C
A
S
I |
KOF
-
NYSE
Coca-Cola Femsa ADR
Beverages-Non-Alcoholic
|
$102.00
|
+4.12
4.21% |
$102.30
|
137,277
96.00% of 50 DAV
50 DAV is 143,000
|
$99.34
2.68%
|
1/12/2024
|
$93.38
|
PP = $99.34
|
|
MB = $104.31
|
Most Recent Note - 2/2/2024 1:43:12 PM
Y - Powering to a new 52-week high with today's 7th consecutive gain. Found support above its 50 DMA line ($91.36). Color code was changed to yellow as a valid secondary buy point was noted up to +5% above the recent high since finding support at its 10 WMA line after an earlier breakout. Its Relative Strength Rating is currently 86, well above the 80+ minimum guideline for buy candidates.
>>> FEATURED STOCK ARTICLE : Secondary Buy Point Noted After Finding Support - 1/12/2024 |
View all notes |
Set NEW NOTE alert |
Company Profile |
SEC
News |
Chart |
Request a new note
C
A
S
I |
PCAR
-
NASDAQ
Paccar
Trucks and Parts-Hvy Duty
|
$102.89
|
+0.87
0.85% |
$103.06
|
478,008
20.95% of 50 DAV
50 DAV is 2,282,000
|
$103.40
-0.50%
|
1/23/2024
|
$100.35
|
PP = $98.57
|
|
MB = $103.50
|
Most Recent Note - 1/31/2024 12:49:01 PM
Y - Volume totals have been cooling while consolidating near its all-time high after volume-driven gains. Reported Dec '23 quarterly earnings +53% on +11% sales revenues versus the year-ago period, its 9th quarterly comparison with better than the +25% minimum earnings guideline (C criteria). There was a downturn in FY' 20 annual earnings (A criteria) like many companies during the pandemic.
>>> FEATURED STOCK ARTICLE : Volume-Driven Breakout for Paccar - 1/23/2024 |
View all notes |
Set NEW NOTE alert |
Company Profile |
SEC
News |
Chart |
Request a new note
C
A
S
I |
HUBB
-
NYSE
Hubbell
Electrical-Power/Equipmt
|
$353.77
|
+10.06
2.93% |
$354.33
|
288,361
75.69% of 50 DAV
50 DAV is 381,000
|
$347.28
1.87%
|
1/30/2024
|
$343.26
|
PP = $336.83
|
|
MB = $353.67
|
Most Recent Note - 2/2/2024 1:46:41 PM
Y - Hitting another new all-time high with today's volume-driven gain. Finished strong after highlighted in yellow in the 1/30/24 mid-day report with pivot point cited based on its 1/22/24 high after a cup-with-handle base.
>>> FEATURED STOCK ARTICLE : Volume Heavy Behind Breakout Gain for Hubbell - 1/30/2024 |
View all notes |
Set NEW NOTE alert |
Company Profile |
SEC
News |
Chart |
Request a new note
C
A
S
I |
Symbol/Exchange
Company Name
Industry Group |
PRICE |
CHANGE
(%Change) |
Day High |
Volume
(% DAV)
(% 50 day avg vol) |
52 Wk Hi
% From Hi |
Featured
Date |
Price
Featured |
Pivot Featured |
|
Max Buy |
MANH
-
NASDAQ
Manhattan Associates
Computer Sftwr-Enterprse
|
$251.26
|
+2.19
0.88% |
$252.66
|
125,393
28.76% of 50 DAV
50 DAV is 436,000
|
$258.91
-2.95%
|
1/31/2024
|
$240.57
|
PP = $230.71
|
|
MB = $242.25
|
Most Recent Note - 2/1/2024 5:54:02 PM
Y - Posted another solid gain today, Highlighted in yellow in the 1/31/24 mid-day report with pivot point cited based on its 11/29/23 high plus 10 cents.
>>> FEATURED STOCK ARTICLE : Big Volume Behind Breakout Gain - 1/31/2024 |
View all notes |
Set NEW NOTE alert |
Company Profile |
SEC
News |
Chart |
Request a new note
C
A
S
I |
|
|
|
THESE ARE NOT BUY RECOMMENDATIONS!
Comments contained in the body of this report are technical
opinions only. The material herein has been obtained
from sources believed to be reliable and accurate, however,
its accuracy and completeness cannot be guaranteed.
This site is not an investment advisor, hence it does
not endorse or recommend any securities or other investments.
Any recommendation contained in this report may not
be suitable for all investors and it is not to be deemed
an offer or solicitation on our part with respect to
the purchase or sale of any securities. All trademarks,
service marks and trade names appearing in this report
are the property of their respective owners, and are
likewise used for identification purposes only.
This report is a service available
only to active Paid Premium Members.
You may opt-out of receiving report notifications
at any time. Questions or comments may be submitted
by writing to Premium Membership Services 665 S.E. 10 Street, Suite 201 Deerfield Beach, FL 33441-5634 or by calling 1-800-965-8307
or 954-785-1121.
|
|
|