You are not logged in.
This means you
CAN ONLY VIEW reports that were published prior to Tuesday, March 25, 2025.
You
MUST UPGRADE YOUR MEMBERSHIP if you want to see any current reports.
AFTER MARKET UPDATE - TUESDAY, JANUARY 23RD, 2024
Previous After Market Report Next After Market Report >>>
|
|
|
|
DOW |
-93.88 |
37,907.93 |
-0.25% |
|
Volume |
432,254,791 |
-58% |
|
Volume |
4,412,923,300 |
-20% |
|
NASDAQ |
+58.20 |
15,418.48 |
+0.38% |
|
Advancers |
1,333 |
48% |
|
Advancers |
2,111 |
50% |
|
S&P 500 |
+13.60 |
4,864.03 |
+0.28% |
|
Decliners |
1,418 |
52% |
|
Decliners |
2,107 |
50% |
|
Russell 2000 |
-0.23 |
1,983.15 |
-0.01% |
|
52 Wk Highs |
84 |
|
|
52 Wk Highs |
134 |
|
|
S&P 600 |
-4.16 |
1,290.48 |
-0.32% |
|
52 Wk Lows |
7 |
|
|
52 Wk Lows |
94 |
|
|
 |
Breadth Even as Major Indices Showed Little Conviction
Kenneth J. Gruneisen - Passed the CAN SLIM® Master's Exam
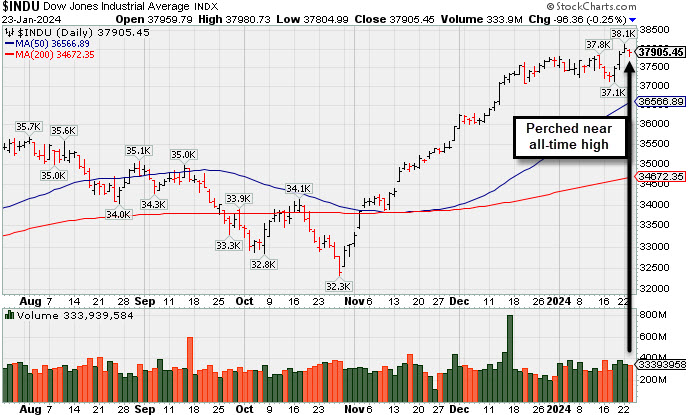
The S&P 500 Index hit a fresh all-time high as the major averages each edged higher. Volume was reported lighter than the prior session total on the NYSE and on the Nasdaq exchange. Advancers and decliners were evenly matched on the NYSE and on the Nasdaq exchange. There were 139 high-ranked companies from the Leaders List that hit new 52-week highs and were listed on the BreakOuts Page. New 52-week highs totals contracted yet still outnumbered new lows on the NYSE and on the Nasdaq exchange. The major indices are in a confirmed uptrend (M criteria). New buying efforts should be only made in stocks fitting all key criteria of the fact-based investment system.
PICTURED: The Dow Jones Industrial Average is perched near its all-time high.
The Dow Jones Industrial Average is also sitting near its all-time high. 3M (MMM -11.03%) weighed on the DJIA. A post-earnings decline in Johnson & Johnson (JNJ -1.64%) also created a drag. Meanwhile, United Airlines (UAL +5.31%), Verizon (VZ +6.70%), and Procter & Gamble (PG +4.14%) logged sizable gains following their quarterly results. NVIDIA (NVDA +0.37%) ended slightly higher after being down as much as -1.8%. Microsoft (MSFT +0.60%) and Tesla (TSLA +0.16%) were down as much as -0.7% and -0.5%, but both settled higher.
The S&P 500 consumer staples sector posted a +1.1% gain. The real estate sector was the worst performer with a -0.5% loss. The 10-yr note yield climbed five basis points to 4.14% and the 2-yr note yield fell two basis points to 4.36% after a fresh $60 billion 2-yr note sale met strong demand.
|
 Kenneth J. Gruneisen started out as a licensed stockbroker in August 1987, a couple of months prior to the historic stock market crash that took the Dow Jones Industrial Average down -22.6% in a single day. He has published daily fact-based fundamental and technical analysis on high-ranked stocks online for two decades. Through FACTBASEDINVESTING.COM, Kenneth provides educational articles, news, market commentary, and other information regarding proven investment systems that work in good times and bad.
Comments contained in the body of this report are technical opinions only and are not necessarily those of Gruneisen Growth Corp. The material herein has been obtained from sources believed to be reliable and accurate, however, its accuracy and completeness cannot be guaranteed. Our firm, employees, and customers may effect transactions, including transactions contrary to any recommendation herein, or have positions in the securities mentioned herein or options with respect thereto. Any recommendation contained in this report may not be suitable for all investors and it is not to be deemed an offer or solicitation on our part with respect to the purchase or sale of any securities. |
|
 |
Gold & Silver Index Outpaced Tech and Oil Services Indexes
Kenneth J. Gruneisen - Passed the CAN SLIM® Master's Exam
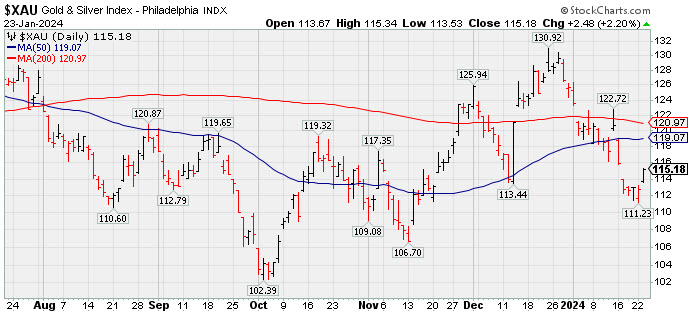
The Broker/Dealer Index ($XBD +0.33%) posted a small gain while the Bank Index ($BKX +0.00%) and the Retail Index ($RLX +0.03%) both finished flat. The tech sector had a slightly positive bias as the Semiconductor Index ($SOX +0.65%) and the Biotech Index ($BTK +0.55%) both edged higher while the Networking Index ($NWX +0.02%) finished flat. The Gold & Silver Index ($XAU +2.20%) posted a solid gain while the Oil Services Index ($OSX +0.51%) edged higher and the Integrated Oil Index ($XOI +0.05%) was little changed.
PICTURED: The Gold & Silver Index ($XAU +2.20%) posted a solid gain while rebounding toward its 50-day and 200-day moving average lines.
| Oil Services |
$OSX |
80.45 |
+0.73 |
+0.91% |
-4.09% |
| Integrated Oil |
$XOI |
1,795.12 |
+1.35 |
+0.08% |
-3.62% |
| Semiconductor |
$SOX |
4,415.83 |
+29.23 |
+0.67% |
+5.76% |
| Networking |
$NWX |
860.53 |
+0.69 |
+0.08% |
+3.33% |
| Broker/Dealer |
$XBD |
546.71 |
+2.27 |
+0.42% |
-1.90% |
| Retail |
$RLX |
3,956.64 |
-3.12 |
-0.08% |
+1.75% |
| Gold & Silver |
$XAU |
115.04 |
+2.34 |
+2.08% |
-8.47% |
| Bank |
$BKX |
95.03 |
+0.18 |
+0.19% |
-1.03% |
| Biotech |
$BTK |
5,244.01 |
+25.28 |
+0.48% |
-3.23% |
|
|
|
 |
Volume-Driven Breakout for Paccar
Kenneth J. Gruneisen - Passed the CAN SLIM® Master's Exam
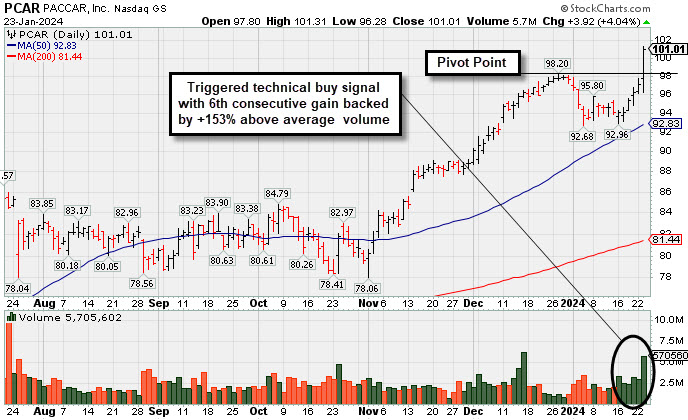
Paccar (PCAR +$3.26 or +3.36% to $100.35) finished strong after highlighted in yellow in the earlier mid-day report (read here). Today's gain backed by +153% above average volume for a new 52-week high cleared the pivot point based on its 12/13/23 high plus 10 cents triggering a technical buy signal.
PCAR has a 93 Earnings Per Share rating. It reported Dec '23 quarterly earnings +53% on +11% sales revenues versus the year-ago period, its 9th quarterly comparison with better than the +25% minimum earnings guideline (C criteria). There was a downturn in FY' 20 annual earnings (A criteria) like many companies during the pandemic.
The number of top-rated funds owning its shares rose from 2,052 in Mar '23 to 2,147 in Dec '23, a reassuring sign concerning the I criteria. Its current Up/Down Volume Ratio of 1.5 is an unbiased indication its shares have been under accumulation over the past 50 days. It has a Timeliness rating of A and an Accumulation/Distribution rating of A-. |
|
|
Color Codes Explained :
Y - Better candidates highlighted by our
staff of experts.
G - Previously featured
in past reports as yellow but may no longer be buyable under the
guidelines.
***Last / Change / Volume data in this table is the closing quote data***
Symbol/Exchange
Company Name
Industry Group |
PRICE |
CHANGE
(%Change) |
Day High |
Volume
(% DAV)
(% 50 day avg vol) |
52 Wk Hi
% From Hi |
Featured
Date |
Price
Featured |
Pivot Featured |
|
Max Buy |
 ANET
-
NYSE
ANET
-
NYSE
Arista Networks
Computer-Networking
|
$262.00
|
-4.60
-1.73% |
$266.00
|
1,216,832
73.75% of 50 DAV
50 DAV is 1,650,000
|
$270.63
-3.19%
|
10/31/2023
|
$188.84
|
PP = $198.80
|
|
MB = $208.74
|
Most Recent Note - 1/18/2024 4:54:35 PM
G - Hit another new all-time high with average volume behind today's gain. Its 50 DMA line ($227) defines near-term support above the prior low in the $210 area. Fundamentals remain strong.
>>> FEATURED STOCK ARTICLE : Extended From Base and Hovering at All-Time High - 12/26/2023 |
View all notes |
Set NEW NOTE alert |
Company Profile |
SEC
News |
Chart |
Request a new note
C
A
S
I |
NVO
-
NYSE
Novo Nordisk ADR
Medical-Ethical Drugs
|
$105.21
|
-0.28
-0.27% |
$105.29
|
5,243,312
126.13% of 50 DAV
50 DAV is 4,157,000
|
$108.98
-3.46%
|
11/2/2023
|
$100.97
|
PP = $104.10
|
|
MB = $109.31
|
Most Recent Note - 1/17/2024 5:21:06 PM
Y - Volume has been cooling after recently challenging its all-time high. Prior highs in the $105 area define initial support above its 50 DMA line ($101.85).
>>> FEATURED STOCK ARTICLE : Gap Up Gain on Prior Session Triggered Technical Buy Signal - 1/5/2024 |
View all notes |
Set NEW NOTE alert |
Company Profile |
SEC
News |
Chart |
Request a new note
C
A
S
I |
QLYS
-
NASDAQ
Qualys
Computer Sftwr-Security
|
$196.88
|
-1.08
-0.55% |
$199.25
|
102,909
28.27% of 50 DAV
50 DAV is 364,000
|
$206.35
-4.59%
|
11/3/2023
|
$167.50
|
PP = $165.03
|
|
MB = $173.28
|
Most Recent Note - 1/17/2024 5:17:03 PM
G - Still finding support above its 50 DMA line ($186.53). The 1/05/24 low ($180.01) defines important near-term support where more damaging losses would raise concerns.
>>> FEATURED STOCK ARTICLE : Posted Light Volume Gain Finding Support at 50-Day Moving Average - 1/8/2024 |
View all notes |
Set NEW NOTE alert |
Company Profile |
SEC
News |
Chart |
Request a new note
C
A
S
I |
AXON
-
NASDAQ
Axon Enterprise
Security/Sfty
|
$255.65
|
-4.01
-1.54% |
$261.28
|
132,303
30.41% of 50 DAV
50 DAV is 435,000
|
$262.95
-2.78%
|
11/8/2023
|
$127.84
|
PP = $223.30
|
|
MB = $234.47
|
Most Recent Note - 1/22/2024 5:46:57 PM
G - Posted a 4th consecutive gain with below-average volume and hit a new all-time high. Its 50-day moving average (DMA) line ($241) defines near-term support above prior highs in the $229-231 area.
>>> FEATURED STOCK ARTICLE : Consolidating Well Above Near-Term Support - 1/9/2024 |
View all notes |
Set NEW NOTE alert |
Company Profile |
SEC
News |
Chart |
Request a new note
C
A
S
I |
TDG
-
NYSE
TransDigm Group
Aerospace/Defense
|
$1,073.76
|
+1.55
0.14% |
$1,077.54
|
93,305
43.20% of 50 DAV
50 DAV is 216,000
|
$1,074.25
-0.05%
|
12/12/2023
|
$1,000.39
|
PP = $1,013.18
|
|
MB = $1,063.84
|
Most Recent Note - 1/17/2024 5:18:18 PM
Y - Hit another new all-time high with a small gain today with below-average volume. Recently wedging higher without great volume conviction.
>>> FEATURED STOCK ARTICLE : Inching to New Highs With 6th Consecutive Gain - 1/11/2024 |
View all notes |
Set NEW NOTE alert |
Company Profile |
SEC
News |
Chart |
Request a new note
C
A
S
I |
Symbol/Exchange
Company Name
Industry Group |
PRICE |
CHANGE
(%Change) |
Day High |
Volume
(% DAV)
(% 50 day avg vol) |
52 Wk Hi
% From Hi |
Featured
Date |
Price
Featured |
Pivot Featured |
|
Max Buy |
PANW
-
NASDAQ
Palo Alto Networks
Computer Sftwr-Security
|
$342.32
|
-3.33
-0.96% |
$346.00
|
2,087,218
48.03% of 50 DAV
50 DAV is 4,346,000
|
$350.60
-2.36%
|
1/10/2024
|
$313.65
|
PP = $318.00
|
|
MB = $333.90
|
Most Recent Note - 1/17/2024 5:15:47 PM
Y - Paused today after 6 consecutive gains with below-average volume for new all-time highs.A valid secondary buy point exists up to 5% above the prior high after finding support at its 10 WMA line since the prior breakout. Fundamentals remain strong. See the latest FSU analysis for more details and a new annotated graph.
>>> FEATURED STOCK ARTICLE : Paused After 6 Gains to a New All-Time High - 1/17/2024 |
View all notes |
Set NEW NOTE alert |
Company Profile |
SEC
News |
Chart |
Request a new note
C
A
S
I |
URI
-
NYSE
United Rentals
Comml Svcs-Leasing
|
$581.19
|
+2.31
0.40% |
$584.95
|
412,571
62.89% of 50 DAV
50 DAV is 656,000
|
$585.94
-0.81%
|
12/1/2023
|
$499.51
|
PP = $488.73
|
|
MB = $513.17
|
Most Recent Note - 1/17/2024 5:22:21 PM
G - Pulled back today with higher (near average) volume. Still consolidating near its all-time high. Its 50 DMA line ($512) defines near-term support to watch above prior highs.
>>> FEATURED STOCK ARTICLE : Perched Near All-Time High Following Volume-Driven Gains - 12/19/2023 |
View all notes |
Set NEW NOTE alert |
Company Profile |
SEC
News |
Chart |
Request a new note
C
A
S
I |
AMPH
-
NASDAQ
Amphastar Pharm
Medical-Biomed/Biotech
|
$55.54
|
-0.38
-0.68% |
$56.77
|
103,461
20.49% of 50 DAV
50 DAV is 505,000
|
$67.66
-17.91%
|
12/4/2023
|
$60.84
|
PP = $58.35
|
|
MB = $61.27
|
 Most Recent Note - 1/23/2024 8:10:27 PM
G - Volume totals have been cooling while still lingering below its 50 DMA line. A rebound above the 50 DMA line ($57.69) is needed for its outlook to improve. Fundamentals remain strong.
>>> FEATURED STOCK ARTICLE : Consolidating Above Pivot Point With Volume Cooling - 12/21/2023 |
View all notes |
Set NEW NOTE alert |
Company Profile |
SEC
News |
Chart |
Request a new note
C
A
S
I |
TBBK
-
NASDAQ
The Bancorp
Banks-Northeast
|
$41.19
|
+0.32
0.78% |
$41.41
|
275,938
70.04% of 50 DAV
50 DAV is 394,000
|
$42.46
-2.99%
|
1/22/2024
|
$40.87
|
PP = $42.56
|
|
MB = $44.69
|
Most Recent Note - 1/22/2024 5:56:39 PM
Y - With today's big volume-driven gain it rebounded above the 50 DMA line ($39.11) helping its outlook to improve. Its color code is changed to yellow and a new pivot point is cited based on its 12/20/23 high plus 10 cents. Subsequent gains above the pivot point backed by at least +40% above average volume may trigger a technical buy signal.
>>> FEATURED STOCK ARTICLE : Negative Reversals are Signs of Distributional Pressure - 12/22/2023 |
View all notes |
Set NEW NOTE alert |
Company Profile |
SEC
News |
Chart |
Request a new note
C
A
S
I |
LULU
-
NASDAQ
lululemon athletica
Retail-Apparel/Shoes/Acc
|
$476.05
|
-5.84
-1.21% |
$481.89
|
569,951
37.87% of 50 DAV
50 DAV is 1,505,000
|
$516.39
-7.81%
|
12/8/2023
|
$490.61
|
PP = $485.93
|
|
MB = $510.23
|
Most Recent Note - 1/23/2024 8:11:28 PM
Y - Still consolidating just above its 50 DMA line ($471) which defines important near-term support to watch. Retreat below its 2021 high of $485 raised concerns, negating its recent breakout from a 2+ year base.
>>> FEATURED STOCK ARTICLE : Perched at All-Time High With Volume Totals Cooling - 12/27/2023 |
View all notes |
Set NEW NOTE alert |
Company Profile |
SEC
News |
Chart |
Request a new note
C
A
S
I |
Symbol/Exchange
Company Name
Industry Group |
PRICE |
CHANGE
(%Change) |
Day High |
Volume
(% DAV)
(% 50 day avg vol) |
52 Wk Hi
% From Hi |
Featured
Date |
Price
Featured |
Pivot Featured |
|
Max Buy |
CRWD
-
NASDAQ
CrowdStrike Holdings
Computer Sftwr-Security
|
$296.08
|
-2.59
-0.87% |
$299.70
|
1,895,272
57.05% of 50 DAV
50 DAV is 3,322,000
|
$302.00
-1.96%
|
1/2/2024
|
$246.42
|
PP = $261.91
|
|
MB = $275.01
|
Most Recent Note - 1/22/2024 12:24:18 PM
G - Extended from any sound base and hitting another new all-time high with today's 3rd consecutive gain. Prior high in the $261 area defines initial support to watch on pullbacks. Fundamentals remain strong.
>>> FEATURED STOCK ARTICLE : CrowdStrike Holdings Pulling Back After "3-Weeks Tight" Pattern - 1/3/2024 |
View all notes |
Set NEW NOTE alert |
Company Profile |
SEC
News |
Chart |
Request a new note
C
A
S
I |
ELF
-
NYSE
e.l.f. Beauty
Cosmetics/Personal Care
|
$154.09
|
+0.23
0.15% |
$158.02
|
634,434
42.41% of 50 DAV
50 DAV is 1,496,000
|
$164.71
-6.45%
|
1/2/2024
|
$138.23
|
PP = $153.63
|
|
MB = $161.31
|
Most Recent Note - 1/22/2024 12:28:29 PM
Y - Rebounded from the early low today but pulled back below the pivot point with recent losses raising some concerns. Fundamentals remain strong.
>>> FEATURED STOCK ARTICLE : Pulled Back After Closing 3 Weeks Tight - 1/2/2024 |
View all notes |
Set NEW NOTE alert |
Company Profile |
SEC
News |
Chart |
Request a new note
C
A
S
I |
KOF
-
NYSE
Coca Cola Femsa Sab Ads
FOOD and BEVERAGE - Beverages - Soft Drinks
|
$90.95
|
+1.20
1.34% |
$90.99
|
70,423
50.19% of 50 DAV
50 DAV is 140,300
|
$99.34
-8.45%
|
1/12/2024
|
$93.38
|
PP = $99.34
|
|
MB = $104.31
|
Most Recent Note - 1/22/2024 5:52:23 PM
Y - Pulled back with light volume testing its 50 DMA line ($89.56). Color code was changed to yellow as a valid secondary buy point was noted up to +5% above the recent high since finding support at its 10 WMA line after an earlier breakout. Its Relative Strength Rating is currently 80, right at the 80+ minimum guideline for buy candidates.
>>> FEATURED STOCK ARTICLE : Secondary Buy Point Noted After Finding Support - 1/12/2024 |
View all notes |
Set NEW NOTE alert |
Company Profile |
SEC
News |
Chart |
Request a new note
C
A
S
I |
PCAR
-
NASDAQ
Paccar
Trucks and Parts-Hvy Duty
|
$100.35
|
+3.26
3.36% |
$100.37
|
4,071,304
187.44% of 50 DAV
50 DAV is 2,172,000
|
$98.47
1.91%
|
1/23/2024
|
$100.35
|
PP = $98.57
|
|
MB = $103.50
|
Most Recent Note - 1/23/2024 8:09:10 PM
Y - Color code was changed to yellow with pivot point cited based on its 12/13/23 high plus 10 cents. It triggered a technical buy signal with a considerable 6th consecutive gain backed by +153% above average volume. Reported Dec '23 quarterly earnings +53% on +11% sales revenues versus the year-ago period, its 9th quarterly comparison with better than the +25% minimum earnings guideline (C criteria). There was a downturn in FY' 20 annual earnings (A criteria) like many companies during the pandemic. See the latest FSU analysis for more details and a new annotated graph.
>>> FEATURED STOCK ARTICLE : Volume-Driven Breakout for Paccar - 1/23/2024 |
View all notes |
Set NEW NOTE alert |
Company Profile |
SEC
News |
Chart |
Request a new note
C
A
S
I |
|
|
|
THESE ARE NOT BUY RECOMMENDATIONS!
Comments contained in the body of this report are technical
opinions only. The material herein has been obtained
from sources believed to be reliable and accurate, however,
its accuracy and completeness cannot be guaranteed.
This site is not an investment advisor, hence it does
not endorse or recommend any securities or other investments.
Any recommendation contained in this report may not
be suitable for all investors and it is not to be deemed
an offer or solicitation on our part with respect to
the purchase or sale of any securities. All trademarks,
service marks and trade names appearing in this report
are the property of their respective owners, and are
likewise used for identification purposes only.
This report is a service available
only to active Paid Premium Members.
You may opt-out of receiving report notifications
at any time. Questions or comments may be submitted
by writing to Premium Membership Services 665 S.E. 10 Street, Suite 201 Deerfield Beach, FL 33441-5634 or by calling 1-800-965-8307
or 954-785-1121.
|
|
|