You are not logged in.
This means you
CAN ONLY VIEW reports that were published prior to Tuesday, March 25, 2025.
You
MUST UPGRADE YOUR MEMBERSHIP if you want to see any current reports.
AFTER MARKET UPDATE - THURSDAY, FEBRUARY 8TH, 2024
Previous After Market Report Next After Market Report >>>
|
|
|
|
DOW |
+48.97 |
38,726.33 |
+0.13% |
|
Volume |
949,210,719 |
-4% |
|
Volume |
5,782,688,700 |
+26% |
|
NASDAQ |
+37.07 |
15,793.71 |
+0.24% |
|
Advancers |
1,659 |
60% |
|
Advancers |
2,579 |
61% |
|
S&P 500 |
+2.85 |
4,997.91 |
+0.06% |
|
Decliners |
1,091 |
40% |
|
Decliners |
1,640 |
39% |
|
Russell 2000 |
+29.34 |
1,979.70 |
+1.50% |
|
52 Wk Highs |
142 |
|
|
52 Wk Highs |
239 |
|
|
S&P 600 |
+16.43 |
1,273.96 |
+1.31% |
|
52 Wk Lows |
25 |
|
|
52 Wk Lows |
110 |
|
|
 |
Breadth Positive and Leadership Solid as Major Indices Rise Further
Kenneth J. Gruneisen - Passed the CAN SLIM® Master's Exam
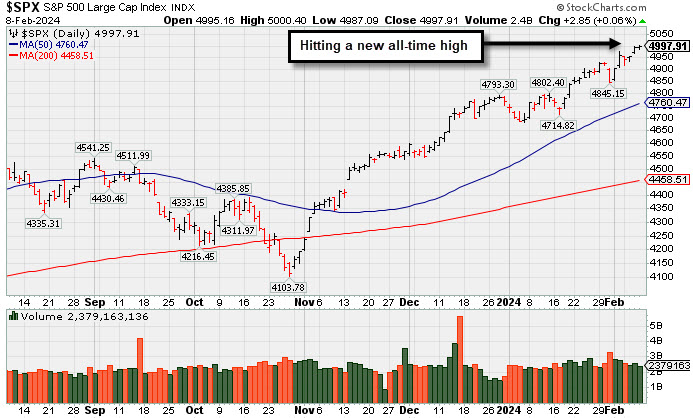
The Russell 2000 outperformed other indices throughout the session, gaining 1.4% by the close. Volume was reported mixed, lighter than the prior session total on the NYSE and higher on the Nasdaq exchange. Advancers led decliners by an 8-5 margin on the NYSE and by about a 5-3 margin on the Nasdaq exchange. Leadership improved as there were 99 high-ranked companies from the Leaders List that hit new 52-week highs and were listed on the BreakOuts Page, versus the total of 93 on the prior session. New 52-week highs outnumbered shrinking new 52-week lows totals on the NYSE and on the Nasdaq exchange. The major indices are in a confirmed uptrend (M criteria). New buying efforts should be only made in stocks fitting all key criteria of the fact-based investment system.
PICTURED: The S&P 500 Index managed a new high close.
Outsized moves were connected with some of the latest earnings reports. Arm Holdings (ARM +47.89%) jumped considerably after reporting earnings. Dow component Walt Disney (DIS +11.50%) also gapped higher following quarterly results. Meanwhile, PayPal (PYPL -11.2%) faced selling pressure after disappointing with below-consensus guidance.
Nine of the 11 S&P 500 sectors moved less than 0.6% in either direction. The energy sector jumped +1.1% amid rising oil prices ($76.24/bbl, +2.46, +3.3%). The utilities sector declined -0.8%.
There was strong demand for a new $25 billion 30-yr bond offering, meanwhile the 10-yr note yield rose six basis points to 4.17% and the 2-yr note yield rose three basis points to 4.45%. |
 Kenneth J. Gruneisen started out as a licensed stockbroker in August 1987, a couple of months prior to the historic stock market crash that took the Dow Jones Industrial Average down -22.6% in a single day. He has published daily fact-based fundamental and technical analysis on high-ranked stocks online for two decades. Through FACTBASEDINVESTING.COM, Kenneth provides educational articles, news, market commentary, and other information regarding proven investment systems that work in good times and bad.
Comments contained in the body of this report are technical opinions only and are not necessarily those of Gruneisen Growth Corp. The material herein has been obtained from sources believed to be reliable and accurate, however, its accuracy and completeness cannot be guaranteed. Our firm, employees, and customers may effect transactions, including transactions contrary to any recommendation herein, or have positions in the securities mentioned herein or options with respect thereto. Any recommendation contained in this report may not be suitable for all investors and it is not to be deemed an offer or solicitation on our part with respect to the purchase or sale of any securities. |
|
 |
Energy, Semiconductor, and Broker/Dealer Indexes Posted Gains
Kenneth J. Gruneisen - Passed the CAN SLIM® Master's Exam
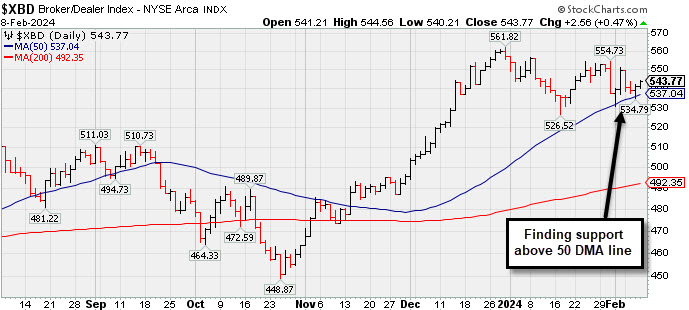
The Broker/Dealer Index ($XBD +0.47%) edged higher while the Bank Index ($BKX -0.07%) finished flat and the Retail Index ($RLX -0.35%) edged lower. The tech sector was led by the Semiconductor Index ($SOX +1.57%) while the Biotech Index ($BTK -0.02%) finished flat and the Networking Index ($NWX -0.29%) edged lower. The Gold & Silver Index ($XAU -1.06%) fell while the Oil Services Index ($OSX +1.22%) and the Integrated Oil Index ($XOI +0.72%) both posted gains.
![]() PICTURED: The Broker/Dealer Index ($XBD +0.47%) posted a small gain and has been finding support above its 50-day moving average (DMA) line.
| Oil Services |
$OSX |
79.63 |
+0.96 |
+1.22% |
-5.07% |
| Integrated Oil |
$XOI |
1,894.06 |
+13.50 |
+0.72% |
+1.70% |
| Semiconductor |
$SOX |
4,478.01 |
+69.29 |
+1.57% |
+7.25% |
| Networking |
$NWX |
827.42 |
-2.41 |
-0.29% |
-0.65% |
| Broker/Dealer |
$XBD |
543.77 |
+2.56 |
+0.47% |
-2.43% |
| Retail |
$RLX |
4,220.27 |
-14.80 |
-0.35% |
+8.52% |
| Gold & Silver |
$XAU |
110.51 |
-1.19 |
-1.06% |
-12.08% |
| Bank |
$BKX |
93.40 |
-0.07 |
-0.07% |
-2.73% |
| Biotech |
$BTK |
5,089.11 |
-0.85 |
-0.02% |
-6.08% |
|
|
|
 |
Extended From Any Sound Base After Volume-Driven Gains
Kenneth J. Gruneisen - Passed the CAN SLIM® Master's Exam
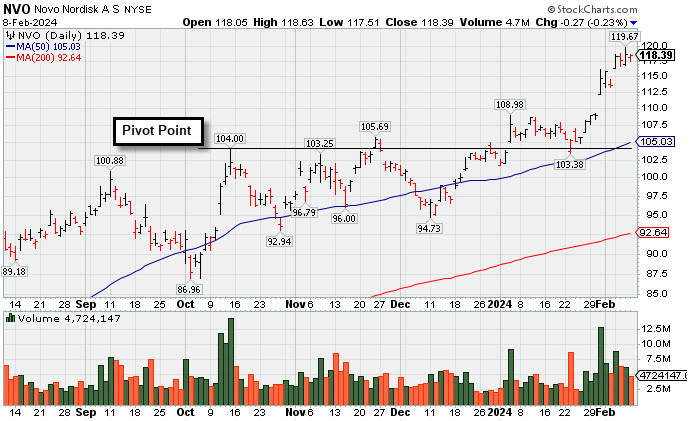
Novo Nordisk (NVO -$0.27 or -0.23% to $118.39) is stubbornly holding its ground and extended from any sound base after a recent spurt of volume-driven gains. Its 50-day moving average (DMA) line ($105) and recent low ($103.38 on 1/23/24) define important near-term support to watch on pullbacks.
NVO was highlighted in yellow in the 11/02/23 mid-day report (read here) with pivot point cited based on its 10/13/23 high plus 10 cents while building on an advanced ascending base. It was last shown in detail in this FSU section on 1/05/24 with an annotated graph under the headline, "Gap Up Gain on Prior Session Triggered Technical Buy Signal".
This Denmark-based Medical - Ethical Drugs firm's shares split 2-1 on 9/20/23. NVO reported Dec '23 quarterly earnings +68% on +41% sales revenues versus the year-ago period, its 4th strong quarter well above the +25% minimum earnings guideline (C criteria). Annual earnings growth has been strong and steady. It has a 98 Earnings Per Share Rating, well above the 80+ minimum for buy candidates.
The number of top-rated funds owning its shares rose from 372 in Dec '22 to 478 in Dec '23, a reassuring sign concerning the I criteria. Its current Up/Down Volume Ratio of 1.2 is an unbiased indication its shares have been under slight accumulation over the past 50 days. It has a Timeliness Rating of A and an Accumulation/Distribution Rating of B. |
|
|
Color Codes Explained :
Y - Better candidates highlighted by our
staff of experts.
G - Previously featured
in past reports as yellow but may no longer be buyable under the
guidelines.
***Last / Change / Volume data in this table is the closing quote data***
Symbol/Exchange
Company Name
Industry Group |
PRICE |
CHANGE
(%Change) |
Day High |
Volume
(% DAV)
(% 50 day avg vol) |
52 Wk Hi
% From Hi |
Featured
Date |
Price
Featured |
Pivot Featured |
|
Max Buy |
 ANET
-
NYSE
ANET
-
NYSE
Arista Networks
Computer-Networking
|
$275.89
|
+8.84
3.31% |
$278.88
|
2,430,411
139.36% of 50 DAV
50 DAV is 1,744,000
|
$276.99
-0.40%
|
10/31/2023
|
$188.84
|
PP = $198.80
|
|
MB = $208.74
|
 Most Recent Note - 2/8/2024 6:36:23 PM
G - Posted a 2nd consecutive volume-driven gain today hitting another new all-time high, extended from any sound base. Its 50 DMA line ($243) defines important near-term support to watch on pullbacks.
>>> FEATURED STOCK ARTICLE : Pulled Back From All Time High With Gap Down on Prior Session - 2/1/2024 |
View all notes |
Set NEW NOTE alert |
Company Profile |
SEC
News |
Chart |
Request a new note
C
A
S
I |
NVO
-
NYSE
Novo Nordisk ADR
Medical-Ethical Drugs
|
$118.39
|
-0.27
-0.23% |
$118.63
|
4,536,125
103.99% of 50 DAV
50 DAV is 4,362,000
|
$119.67
-1.07%
|
11/2/2023
|
$100.97
|
PP = $104.10
|
|
MB = $109.31
|
Most Recent Note - 2/8/2024 6:28:55 PM
G - Holding its ground stubbornly and extended from any sound base after a spurt of volume-driven gains. Its 50 DMA line ($105) and recent low ($103.38 on 1/23/24) define important near-term support to watch on pullbacks. See the latest FSU analysis for more details and a new annotated graph.
>>> FEATURED STOCK ARTICLE : Extended From Any Sound Base After Volume-Driven Gains - 2/8/2024 |
View all notes |
Set NEW NOTE alert |
Company Profile |
SEC
News |
Chart |
Request a new note
C
A
S
I |
AXON
-
NASDAQ
Axon Enterprise
Security/Sfty
|
$268.99
|
+3.52
1.33% |
$269.50
|
306,083
78.48% of 50 DAV
50 DAV is 390,000
|
$270.95
-0.72%
|
11/8/2023
|
$127.84
|
PP = $223.30
|
|
MB = $234.47
|
Most Recent Note - 2/7/2024 7:04:14 PM
G - Posted a 5th consecutive gain today backed by above-average volume for a new all-time high. Recently found support above its 50-day moving average (DMA) line ($248.72).
>>> FEATURED STOCK ARTICLE : Consolidating Well Above Near-Term Support - 1/9/2024 |
View all notes |
Set NEW NOTE alert |
Company Profile |
SEC
News |
Chart |
Request a new note
C
A
S
I |
TDG
-
NYSE
TransDigm Group
Aerospace/Defense
|
$1,128.57
|
-18.44
-1.61% |
$1,155.24
|
442,607
221.30% of 50 DAV
50 DAV is 200,000
|
$1,150.15
-1.88%
|
12/12/2023
|
$1,000.39
|
PP = $1,013.18
|
|
MB = $1,063.84
|
Most Recent Note - 2/8/2024 1:00:40 PM
G - Extended from any sound base today's 8th consecutive gain with above-average volume has it hitting yet another new all-time high. Its 50 DMA line ($1,025) defines near-term support to watch above prior highs in the $1,013-1,015 area.
>>> FEATURED STOCK ARTICLE : Inching to New Highs With 6th Consecutive Gain - 1/11/2024 |
View all notes |
Set NEW NOTE alert |
Company Profile |
SEC
News |
Chart |
Request a new note
C
A
S
I |
PANW
-
NASDAQ
Palo Alto Networks
Computer Sftwr-Security
|
$367.02
|
+2.52
0.69% |
$371.72
|
2,948,134
79.38% of 50 DAV
50 DAV is 3,714,000
|
$366.14
0.24%
|
1/10/2024
|
$313.65
|
PP = $318.00
|
|
MB = $333.90
|
Most Recent Note - 2/7/2024 1:14:46 PM
G - Volume is heavier behind today's gain for a new all-time high, getting very extended from any sound base. Prior high ($318) and its 50 DMA line ($312) define important support to watch on pullbacks.
>>> FEATURED STOCK ARTICLE : Paused After 6 Gains to a New All-Time High - 1/17/2024 |
View all notes |
Set NEW NOTE alert |
Company Profile |
SEC
News |
Chart |
Request a new note
C
A
S
I |
Symbol/Exchange
Company Name
Industry Group |
PRICE |
CHANGE
(%Change) |
Day High |
Volume
(% DAV)
(% 50 day avg vol) |
52 Wk Hi
% From Hi |
Featured
Date |
Price
Featured |
Pivot Featured |
|
Max Buy |
URI
-
NYSE
United Rentals
Comml Svcs-Leasing
|
$647.00
|
-5.73
-0.88% |
$656.12
|
609,558
86.10% of 50 DAV
50 DAV is 708,000
|
$658.86
-1.80%
|
1/24/2024
|
$576.90
|
PP = $585.60
|
|
MB = $614.88
|
Most Recent Note - 2/6/2024 6:14:10 PM
G - Volume totals cooling while stubbornly holding its ground near its all-time high. Prior high ($585.50) defines initial support to watch. Reported Dec '23 quarterly earnings +16% on +13% sales revenues versus the year-ago period, below the +25% minimum earnings guideline (C criteria) raising fundamental concerns.
>>> FEATURED STOCK ARTICLE : Negative Reversal After New High for United Rentals - 1/24/2024 |
View all notes |
Set NEW NOTE alert |
Company Profile |
SEC
News |
Chart |
Request a new note
C
A
S
I |
TBBK
-
NASDAQ
The Bancorp
Banks-Northeast
|
$42.63
|
+0.51
1.21% |
$42.70
|
463,064
96.07% of 50 DAV
50 DAV is 482,000
|
$47.11
-9.51%
|
1/22/2024
|
$40.87
|
PP = $42.56
|
|
MB = $44.69
|
Most Recent Note - 2/6/2024 6:10:06 PM
Y - Posted a volume-driven gain today while testing prior highs in the $42 area and its color code is changed to yellow. Fundamentals remain strong.
>>> FEATURED STOCK ARTICLE : Volume-Driven Breakout Triggered Buy Signal After Earnings Report - 1/26/2024 |
View all notes |
Set NEW NOTE alert |
Company Profile |
SEC
News |
Chart |
Request a new note
C
A
S
I |
LULU
-
NASDAQ
lululemon athletica
Retail-Apparel/Shoes/Acc
|
$472.98
|
+15.23
3.33% |
$476.62
|
1,506,244
95.63% of 50 DAV
50 DAV is 1,575,000
|
$516.39
-8.41%
|
12/8/2023
|
$490.61
|
PP = $485.93
|
|
MB = $510.23
|
Most Recent Note - 2/8/2024 6:31:48 PM
G - Posted a solid gain today with average volume, rebounding toward its 50 DMA line ($481) which may act as resistance. A rebound above the 50 DMA line is needed to help its outlook improve.
>>> FEATURED STOCK ARTICLE : Violation of 50-Day Moving Average Hurt Outlook - 2/2/2024 |
View all notes |
Set NEW NOTE alert |
Company Profile |
SEC
News |
Chart |
Request a new note
C
A
S
I |
CRWD
-
NASDAQ
CrowdStrike Holdings
Computer Sftwr-Security
|
$323.08
|
+5.30
1.67% |
$323.93
|
2,516,561
73.45% of 50 DAV
50 DAV is 3,426,000
|
$321.07
0.63%
|
1/2/2024
|
$246.42
|
PP = $261.91
|
|
MB = $275.01
|
Most Recent Note - 2/7/2024 7:01:04 PM
G - Volume was +19% above average behind today's big gain for another new all-time high. Its 50 DMA line ($266) defines near-term support to watch on pullbacks. Fundamentals remain strong.
>>> FEATURED STOCK ARTICLE : Volume Totals Cooking While Stubbornly Perched at All-Time High - 2/6/2024 |
View all notes |
Set NEW NOTE alert |
Company Profile |
SEC
News |
Chart |
Request a new note
C
A
S
I |
ELF
-
NYSE
e.l.f. Beauty
Cosmetics/Personal Care
|
$171.54
|
+6.72
4.08% |
$174.20
|
1,909,714
130.00% of 50 DAV
50 DAV is 1,469,000
|
$174.65
-1.78%
|
1/2/2024
|
$138.23
|
PP = $153.63
|
|
MB = $161.31
|
Most Recent Note - 2/8/2024 6:30:19 PM
G - Perched near its all-time high today after another big volume-driven gain. Reported Dec '23 quarterly earnings +54% on +85% sales revenues versus the year-ago period, continuing its strong earnings track record. Volume and volatility often increase near earnings news. Its 50 DMA line ($147) defines important near-term support to watch.
>>> FEATURED STOCK ARTICLE : Peched at All-Time High With Earnings News Due - 2/5/2024 |
View all notes |
Set NEW NOTE alert |
Company Profile |
SEC
News |
Chart |
Request a new note
C
A
S
I |
Symbol/Exchange
Company Name
Industry Group |
PRICE |
CHANGE
(%Change) |
Day High |
Volume
(% DAV)
(% 50 day avg vol) |
52 Wk Hi
% From Hi |
Featured
Date |
Price
Featured |
Pivot Featured |
|
Max Buy |
KOF
-
NYSE
Coca-Cola Femsa ADR
Beverages-Non-Alcoholic
|
$97.72
|
+0.13
0.13% |
$98.55
|
84,440
54.48% of 50 DAV
50 DAV is 155,000
|
$102.94
-5.07%
|
1/12/2024
|
$93.38
|
PP = $99.34
|
|
MB = $104.31
|
Most Recent Note - 2/8/2024 6:40:59 PM
Y - Holding its ground with volume totals cooling after abruptly reversing from its high this week and undercutting its prior high raising concerns. Its 50 DMA line ($92.34) recently acted as support. A valid secondary buy point was noted up to +5% above the 12/19/23 high since finding support at its 10 WMA line after an earlier breakout. Its Relative Strength Rating is currently 82, above the 80+ minimum guideline for buy candidates.
>>> FEATURED STOCK ARTICLE : Secondary Buy Point Noted After Finding Support - 1/12/2024 |
View all notes |
Set NEW NOTE alert |
Company Profile |
SEC
News |
Chart |
Request a new note
C
A
S
I |
PCAR
-
NASDAQ
Paccar
Trucks and Parts-Hvy Duty
|
$105.61
|
+0.55
0.52% |
$106.23
|
2,223,524
95.43% of 50 DAV
50 DAV is 2,330,000
|
$105.61
0.00%
|
1/23/2024
|
$100.35
|
PP = $98.57
|
|
MB = $103.50
|
Most Recent Note - 2/6/2024 6:05:11 PM
G - Hit a new all-time high with today's 4th consecutive gain and its color code is changed to green after wedging above its "max buy" level. Reported Dec '23 quarterly earnings +53% on +11% sales revenues versus the year-ago period, its 9th quarterly comparison with better than the +25% minimum earnings guideline (C criteria). There was a downturn in FY' 20 annual earnings (A criteria) like many companies during the pandemic.
>>> FEATURED STOCK ARTICLE : Volume-Driven Breakout for Paccar - 1/23/2024 |
View all notes |
Set NEW NOTE alert |
Company Profile |
SEC
News |
Chart |
Request a new note
C
A
S
I |
HUBB
-
NYSE
Hubbell
Electrical-Power/Equipmt
|
$358.21
|
+3.08
0.87% |
$359.04
|
308,302
78.85% of 50 DAV
50 DAV is 391,000
|
$358.12
0.03%
|
1/30/2024
|
$343.26
|
PP = $336.83
|
|
MB = $353.67
|
Most Recent Note - 2/8/2024 6:38:20 PM
G - Hit yet another new all-time high with today's gain backed by below-average volume, wedging above its "max buy" level, and its color code is changed to green. Prior high ($340) defines initial support to watch on pullbacks.
>>> FEATURED STOCK ARTICLE : Volume Heavy Behind Breakout Gain for Hubbell - 1/30/2024 |
View all notes |
Set NEW NOTE alert |
Company Profile |
SEC
News |
Chart |
Request a new note
C
A
S
I |
MANH
-
NASDAQ
Manhattan Associates
Computer Sftwr-Enterprse
|
$247.02
|
+1.29
0.52% |
$249.12
|
377,643
86.62% of 50 DAV
50 DAV is 436,000
|
$258.91
-4.59%
|
1/31/2024
|
$240.57
|
PP = $230.71
|
|
MB = $242.25
|
Most Recent Note - 2/6/2024 6:17:29 PM
G - Color code is changed to green while stubbornly holding its ground above its "max buy" level near its all-time high with volume totals cooling. Prior highs in the $230 area define near-term support to watch on pullbacks.
>>> FEATURED STOCK ARTICLE : Big Volume Behind Breakout Gain - 1/31/2024 |
View all notes |
Set NEW NOTE alert |
Company Profile |
SEC
News |
Chart |
Request a new note
C
A
S
I |
TENB
-
NASDAQ
Tenable Holdings
Computer Sftwr-Security
|
$50.72
|
+0.57
1.14% |
$51.36
|
2,226,747
228.85% of 50 DAV
50 DAV is 973,000
|
$53.50
-5.20%
|
2/7/2024
|
$49.50
|
PP = $49.87
|
|
MB = $52.36
|
Most Recent Note - 2/7/2024 7:32:51 PM
Y - Finished in the lower third of its intra-day range but above the pivot point after it was highlighted in yellow in the mid-day report. The gain backed by +225% above average volume triggered a technical buy signal. Bullish action came after it reported earnings for the Dec '23 quarter +108% on +16% sales revenues versus the year-ago period. Volume and volatility often increase near earnings news. Prior quarterly and annual earnings history is a good match with the fact-based investment system's fundamental guidelines. See the latest FSU analysis for more details and an annotated graph.
>>> FEATURED STOCK ARTICLE : Gap Up Gain Followed Latest Earnings Report - 2/7/2024 |
View all notes |
Set NEW NOTE alert |
Company Profile |
SEC
News |
Chart |
Request a new note
C
A
S
I |
Symbol/Exchange
Company Name
Industry Group |
PRICE |
CHANGE
(%Change) |
Day High |
Volume
(% DAV)
(% 50 day avg vol) |
52 Wk Hi
% From Hi |
Featured
Date |
Price
Featured |
Pivot Featured |
|
Max Buy |
|
|
|
THESE ARE NOT BUY RECOMMENDATIONS!
Comments contained in the body of this report are technical
opinions only. The material herein has been obtained
from sources believed to be reliable and accurate, however,
its accuracy and completeness cannot be guaranteed.
This site is not an investment advisor, hence it does
not endorse or recommend any securities or other investments.
Any recommendation contained in this report may not
be suitable for all investors and it is not to be deemed
an offer or solicitation on our part with respect to
the purchase or sale of any securities. All trademarks,
service marks and trade names appearing in this report
are the property of their respective owners, and are
likewise used for identification purposes only.
This report is a service available
only to active Paid Premium Members.
You may opt-out of receiving report notifications
at any time. Questions or comments may be submitted
by writing to Premium Membership Services 665 S.E. 10 Street, Suite 201 Deerfield Beach, FL 33441-5634 or by calling 1-800-965-8307
or 954-785-1121.
|
|
|