You are not logged in.
This means you
CAN ONLY VIEW reports that were published prior to Tuesday, March 25, 2025.
You
MUST UPGRADE YOUR MEMBERSHIP if you want to see any current reports.
AFTER MARKET UPDATE - TUESDAY, FEBRUARY 6TH, 2024
Previous After Market Report Next After Market Report >>>
|
|
|
|
DOW |
+141.24 |
38,521.36 |
+0.37% |
|
Volume |
934,767,309 |
-2% |
|
Volume |
4,792,209,700 |
-3% |
|
NASDAQ |
+11.32 |
15,609.00 |
+0.07% |
|
Advancers |
1,982 |
71% |
|
Advancers |
2,706 |
64% |
|
S&P 500 |
+11.42 |
4,954.23 |
+0.23% |
|
Decliners |
818 |
29% |
|
Decliners |
1,505 |
36% |
|
Russell 2000 |
+16.39 |
1,953.63 |
+0.85% |
|
52 Wk Highs |
83 |
|
|
52 Wk Highs |
109 |
|
|
S&P 600 |
+6.92 |
1,260.02 |
+0.55% |
|
52 Wk Lows |
33 |
|
|
52 Wk Lows |
125 |
|
|
 |
Breadth Was Positive as Major Indices Rose
Kenneth J. Gruneisen - Passed the CAN SLIM® Master's Exam
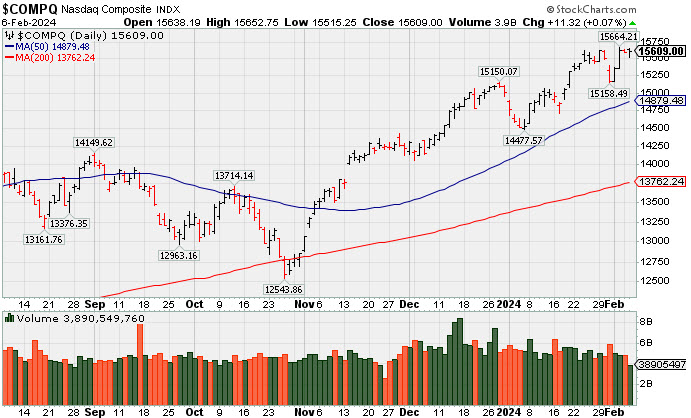
The Nasdaq Composite (+0.1%) and the S&P 500 (+0.2%) were both outpaced by larger gains from the Dow Jones Industrial Average (+0.4%) and Russell 2000 (+0.8%). Volume was reported lighter than the prior session totals on the NYSE and on the Nasdaq exchange. Breadth was positive as advancers led decliners by more than a 2-1 margin on the NYSE and by more than a 5-3 margin on the Nasdaq exchange. There were 36 high-ranked companies from the Leaders List that hit new 52-week highs and were listed on the BreakOuts Page versus 40 on the prior session. New 52-week highs outnumbered new lows on the NYSE but new lows outnumbered new highs on the Nasdaq exchange. The major indices are in a confirmed uptrend (M criteria). New buying efforts should be only made in stocks fitting all key criteria of the fact-based investment system.
PICTURED: The Nasdaq Composite Index is perched near its 2024 high and only -3.7% off its Nov '21 all-time high.
NVIDIA (NVDA -1.6%) was among the influential laggards along Meta Platforms (META -1.02%). Both the Information technology (-0.5%) and the communication services (-0.2%) sectors fell - the info tech sector is still up +6.8% this year and the communication services sector has risen +9.6% gain. New York Community Bank (NYCB -22.22%) dove lower. Bloomberg reported that the bank was pressured by regulator to cut its dividend. Coherent (COHR +17.36%) went against the grain in the SOX with a big earnings-related move higher. Amkor (AMKR -5.01%) traded down after reporting quarterly results. The materials sector's +1.7% gain was the largest increase among the nine sectors that finished higher. DuPont (DD +7.40%) rose after earnings while Eli Lilly (LLY -0.17%) finished little changed following its latest results.
There was a new $54 billion 3-yr note auction met with strong demand. The 10-yr note yield declined seven basis points to 4.09% and the 2-yr note yield fell six basis points to 4.40%.
|
 Kenneth J. Gruneisen started out as a licensed stockbroker in August 1987, a couple of months prior to the historic stock market crash that took the Dow Jones Industrial Average down -22.6% in a single day. He has published daily fact-based fundamental and technical analysis on high-ranked stocks online for two decades. Through FACTBASEDINVESTING.COM, Kenneth provides educational articles, news, market commentary, and other information regarding proven investment systems that work in good times and bad.
Comments contained in the body of this report are technical opinions only and are not necessarily those of Gruneisen Growth Corp. The material herein has been obtained from sources believed to be reliable and accurate, however, its accuracy and completeness cannot be guaranteed. Our firm, employees, and customers may effect transactions, including transactions contrary to any recommendation herein, or have positions in the securities mentioned herein or options with respect thereto. Any recommendation contained in this report may not be suitable for all investors and it is not to be deemed an offer or solicitation on our part with respect to the purchase or sale of any securities. |
|
 |
Commodity-Linked Groups Biotech and Networking Indexes Rose
Kenneth J. Gruneisen - Passed the CAN SLIM® Master's Exam
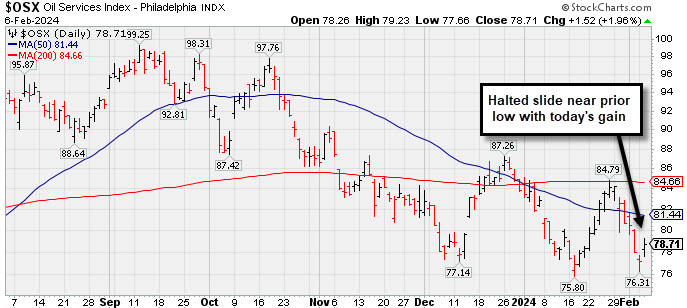
The Broker/Dealer Index ($XBD -0.25%), Bank Index ($BKX -0.10%), and the Retail Index ($RLX -0.29%) each posted small losses. The tech sector was mixed as the Semiconductor Index ($SOX -1.14%) fell while the Biotech Index ($BTK +1.96%) and the Networking Index ($NWX +0.69%) both posted gains. Commodity-linked groups had a positive bias as the Gold & Silver Index ($XAU +1.26%) and Oil Services Index ($OSX +1.96%) both outpaced the Integrated Oil Index ($XOI +0.42%).
![]() PICTURED: The Oil Services Index ($OSX +1.96%) posted a gain halting its slide near its 2024 low. In recent weeks it met resistance at its 200-day moving average (DMA) line and slumped.
| Oil Services |
$OSX |
78.71 |
+1.52 |
+1.96% |
-6.17% |
| Integrated Oil |
$XOI |
1,877.39 |
+7.89 |
+0.42% |
+0.80% |
| Semiconductor |
$SOX |
4,338.27 |
-49.83 |
-1.14% |
+3.90% |
| Networking |
$NWX |
831.96 |
+5.72 |
+0.69% |
-0.10% |
| Broker/Dealer |
$XBD |
539.20 |
-1.35 |
-0.25% |
-3.25% |
| Retail |
$RLX |
4,192.52 |
-12.27 |
-0.29% |
+7.81% |
| Gold & Silver |
$XAU |
112.90 |
+1.41 |
+1.26% |
-10.18% |
| Bank |
$BKX |
93.44 |
-0.09 |
-0.10% |
-2.69% |
| Biotech |
$BTK |
5,193.65 |
+99.66 |
+1.96% |
-4.16% |
|
|
|
 |
Volume Totals Cooking While Stubbornly Perched at All-Time High
Kenneth J. Gruneisen - Passed the CAN SLIM® Master's Exam
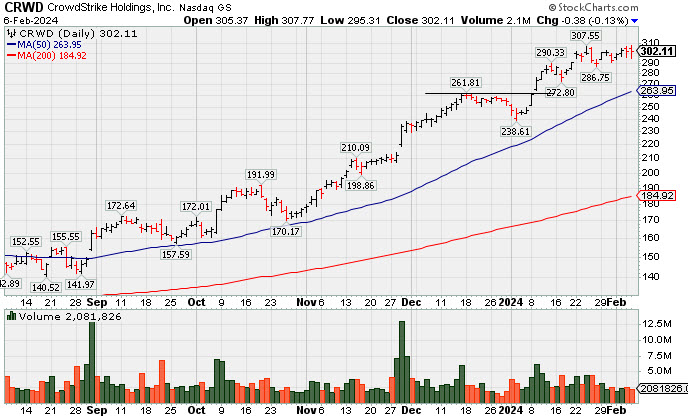
CrowdStrike Holdings (CRWD -$0.38 or -0.13% to $302.11) has seen volume totals cooling while still hovering near its all-time high, stubbornly holding its ground. Its 50-day moving average (DMA) line ($264) defines near-term support above the prior high in the $261 area. Fundamentals remain strong.
CRWD has a highest possible 99 Earnings Per Share rating. It reported Oct '23 quarterly earnings +105% on +35% sales revenues versus the year-ago period, extending its streak of strong earnings increases well above the +25% minimum guideline (C criteria) in quarterly comparisons. Its annual earnings (A criteria) history has been strong. Completed its $34 IPO on 6/12/19.
The number of top-rated funds owning its shares rose from 1,880 in Jun 23 to 2,055 in Dec '23, a reassuring sign concerning the I criteria. Its current Up/Down Volume Ratio of 2.3 is an unbiased indication its shares have been under accumulation over the past 50 days. |
|
|
Color Codes Explained :
Y - Better candidates highlighted by our
staff of experts.
G - Previously featured
in past reports as yellow but may no longer be buyable under the
guidelines.
***Last / Change / Volume data in this table is the closing quote data***
Symbol/Exchange
Company Name
Industry Group |
PRICE |
CHANGE
(%Change) |
Day High |
Volume
(% DAV)
(% 50 day avg vol) |
52 Wk Hi
% From Hi |
Featured
Date |
Price
Featured |
Pivot Featured |
|
Max Buy |
 ANET
-
NYSE
ANET
-
NYSE
Arista Networks
Computer-Networking
|
$264.89
|
-8.08
-2.96% |
$273.27
|
2,480,761
146.19% of 50 DAV
50 DAV is 1,697,000
|
$276.99
-4.37%
|
10/31/2023
|
$188.84
|
PP = $198.80
|
|
MB = $208.74
|
 Most Recent Note - 2/6/2024 6:01:29 PM
G - Extended from any sound base and retreating from its all-time high with today's volume-driven loss. Its 50 DMA line ($241) defines near-term support above the prior low ($226.60 on 1/04/24) area. Fundamentals remain strong.
>>> FEATURED STOCK ARTICLE : Pulled Back From All Time High With Gap Down on Prior Session - 2/1/2024 |
View all notes |
Set NEW NOTE alert |
Company Profile |
SEC
News |
Chart |
Request a new note
C
A
S
I |
NVO
-
NYSE
Novo Nordisk ADR
Medical-Ethical Drugs
|
$117.61
|
-0.65
-0.55% |
$118.70
|
6,267,995
147.17% of 50 DAV
50 DAV is 4,259,000
|
$118.60
-0.83%
|
11/2/2023
|
$100.97
|
PP = $104.10
|
|
MB = $109.31
|
Most Recent Note - 2/6/2024 12:36:38 PM
G - Holding its ground stubbornly and extended from any sound base after a spurt of volume-driven gains. Its 50 DMA line ($104) and recent low ($103.38 on 1/23/24) define important near-term support to watch on pullbacks.
>>> FEATURED STOCK ARTICLE : Gap Up Gain on Prior Session Triggered Technical Buy Signal - 1/5/2024 |
View all notes |
Set NEW NOTE alert |
Company Profile |
SEC
News |
Chart |
Request a new note
C
A
S
I |
AXON
-
NASDAQ
Axon Enterprise
Security/Sfty
|
$259.64
|
+2.17
0.84% |
$259.69
|
226,011
60.11% of 50 DAV
50 DAV is 376,000
|
$262.95
-1.26%
|
11/8/2023
|
$127.84
|
PP = $223.30
|
|
MB = $234.47
|
Most Recent Note - 2/2/2024 1:49:12 PM
G - Posting a gain with below-average volume today while finding support above its 50-day moving average (DMA) line ($246.74). The 50 DMA line defines near-term support above prior low ($241.72 on 1/05/24).
>>> FEATURED STOCK ARTICLE : Consolidating Well Above Near-Term Support - 1/9/2024 |
View all notes |
Set NEW NOTE alert |
Company Profile |
SEC
News |
Chart |
Request a new note
C
A
S
I |
TDG
-
NYSE
TransDigm Group
Aerospace/Defense
|
$1,140.60
|
+5.52
0.49% |
$1,142.55
|
287,066
150.30% of 50 DAV
50 DAV is 191,000
|
$1,139.82
0.07%
|
12/12/2023
|
$1,000.39
|
PP = $1,013.18
|
|
MB = $1,063.84
|
Most Recent Note - 2/6/2024 6:11:21 PM
G - Posted a 6th consecutive gain today with above-average volume for a new all-time high. Prior highs in the $1,013-1,015 area define near-term support to watch on pullbacks.
>>> FEATURED STOCK ARTICLE : Inching to New Highs With 6th Consecutive Gain - 1/11/2024 |
View all notes |
Set NEW NOTE alert |
Company Profile |
SEC
News |
Chart |
Request a new note
C
A
S
I |
PANW
-
NASDAQ
Palo Alto Networks
Computer Sftwr-Security
|
$341.49
|
-2.99
-0.87% |
$347.75
|
2,630,948
72.78% of 50 DAV
50 DAV is 3,615,000
|
$350.60
-2.60%
|
1/10/2024
|
$313.65
|
PP = $318.00
|
|
MB = $333.90
|
Most Recent Note - 2/6/2024 6:02:47 PM
G - Volume totals have been cooling while stubbornly holding its ground near its all-time high. Color code is changed to green after recently getting extended beyond the "max buy" level.
>>> FEATURED STOCK ARTICLE : Paused After 6 Gains to a New All-Time High - 1/17/2024 |
View all notes |
Set NEW NOTE alert |
Company Profile |
SEC
News |
Chart |
Request a new note
C
A
S
I |
Symbol/Exchange
Company Name
Industry Group |
PRICE |
CHANGE
(%Change) |
Day High |
Volume
(% DAV)
(% 50 day avg vol) |
52 Wk Hi
% From Hi |
Featured
Date |
Price
Featured |
Pivot Featured |
|
Max Buy |
URI
-
NYSE
United Rentals
Comml Svcs-Leasing
|
$654.54
|
+8.97
1.39% |
$654.54
|
478,347
67.85% of 50 DAV
50 DAV is 705,000
|
$658.63
-0.62%
|
1/24/2024
|
$576.90
|
PP = $585.60
|
|
MB = $614.88
|
Most Recent Note - 2/6/2024 6:14:10 PM
G - Volume totals cooling while stubbornly holding its ground near its all-time high. Prior high ($585.50) defines initial support to watch. Reported Dec '23 quarterly earnings +16% on +13% sales revenues versus the year-ago period, below the +25% minimum earnings guideline (C criteria) raising fundamental concerns.
>>> FEATURED STOCK ARTICLE : Negative Reversal After New High for United Rentals - 1/24/2024 |
View all notes |
Set NEW NOTE alert |
Company Profile |
SEC
News |
Chart |
Request a new note
C
A
S
I |
TBBK
-
NASDAQ
The Bancorp
Banks-Northeast
|
$42.45
|
+0.08
0.19% |
$43.38
|
675,679
146.57% of 50 DAV
50 DAV is 461,000
|
$47.11
-9.89%
|
1/22/2024
|
$40.87
|
PP = $42.56
|
|
MB = $44.69
|
Most Recent Note - 2/6/2024 6:10:06 PM
Y - Posted a volume-driven gain today while testing prior highs in the $42 area and its color code is changed to yellow. Fundamentals remain strong.
>>> FEATURED STOCK ARTICLE : Volume-Driven Breakout Triggered Buy Signal After Earnings Report - 1/26/2024 |
View all notes |
Set NEW NOTE alert |
Company Profile |
SEC
News |
Chart |
Request a new note
C
A
S
I |
LULU
-
NASDAQ
lululemon athletica
Retail-Apparel/Shoes/Acc
|
$456.54
|
-0.19
-0.04% |
$459.66
|
1,525,576
98.55% of 50 DAV
50 DAV is 1,548,000
|
$516.39
-11.59%
|
12/8/2023
|
$490.61
|
PP = $485.93
|
|
MB = $510.23
|
Most Recent Note - 2/5/2024 6:57:11 PM
G - Halted its slide after gapping down on 1/31/24 violating its 50 DMA line ($479) triggering a technical sell signal. A rebound above the 50 DMA line is needed to help its outlook improve.
>>> FEATURED STOCK ARTICLE : Violation of 50-Day Moving Average Hurt Outlook - 2/2/2024 |
View all notes |
Set NEW NOTE alert |
Company Profile |
SEC
News |
Chart |
Request a new note
C
A
S
I |
CRWD
-
NASDAQ
CrowdStrike Holdings
Computer Sftwr-Security
|
$302.11
|
-0.38
-0.13% |
$307.77
|
2,041,789
60.37% of 50 DAV
50 DAV is 3,382,000
|
$307.77
-1.84%
|
1/2/2024
|
$246.42
|
PP = $261.91
|
|
MB = $275.01
|
Most Recent Note - 2/6/2024 5:56:16 PM
G - Volume totals have been cooling while hovering near its all-time high. Its 50 DMA line ($264) defines support above the prior high in the $261 area. Fundamentals remain strong. See the latest FSU analysis for more details and a new annotated graph.
>>> FEATURED STOCK ARTICLE : Volume Totals Cooking While Stubbornly Perched at All-Time High - 2/6/2024 |
View all notes |
Set NEW NOTE alert |
Company Profile |
SEC
News |
Chart |
Request a new note
C
A
S
I |
ELF
-
NYSE
e.l.f. Beauty
Cosmetics/Personal Care
|
$173.32
|
+3.58
2.11% |
$174.65
|
2,321,584
170.83% of 50 DAV
50 DAV is 1,359,000
|
$174.32
-0.57%
|
1/2/2024
|
$138.23
|
PP = $153.63
|
|
MB = $161.31
|
Most Recent Note - 2/6/2024 5:59:02 PM
G - Hit another new all-time high today with a volume-driven gain. Reported Dec '23 quarterly earnings +54% on +85% sales revenues versus the year-ago period, continuing its strong earnings track record. Volume and volatility often increase near earnings news. Its 50 DMA line ($145) defines important near-term support to watch.
>>> FEATURED STOCK ARTICLE : Peched at All-Time High With Earnings News Due - 2/5/2024 |
View all notes |
Set NEW NOTE alert |
Company Profile |
SEC
News |
Chart |
Request a new note
C
A
S
I |
Symbol/Exchange
Company Name
Industry Group |
PRICE |
CHANGE
(%Change) |
Day High |
Volume
(% DAV)
(% 50 day avg vol) |
52 Wk Hi
% From Hi |
Featured
Date |
Price
Featured |
Pivot Featured |
|
Max Buy |
KOF
-
NYSE
Coca-Cola Femsa ADR
Beverages-Non-Alcoholic
|
$98.01
|
+0.76
0.78% |
$100.48
|
321,857
216.01% of 50 DAV
50 DAV is 149,000
|
$102.94
-4.79%
|
1/12/2024
|
$93.38
|
PP = $99.34
|
|
MB = $104.31
|
Most Recent Note - 2/5/2024 7:02:40 PM
Y - Abruptly reversed the prior session's gain and undercut its prior high today raising concerns while retreating from its 52-week high. Its 50 DMA line ($91.61) recently acted as support. Color code was changed to yellow as a valid secondary buy point was noted up to +5% above the recent high since finding support at its 10 WMA line after an earlier breakout. Its Relative Strength Rating is currently 84, well above the 80+ minimum guideline for buy candidates.
>>> FEATURED STOCK ARTICLE : Secondary Buy Point Noted After Finding Support - 1/12/2024 |
View all notes |
Set NEW NOTE alert |
Company Profile |
SEC
News |
Chart |
Request a new note
C
A
S
I |
PCAR
-
NASDAQ
Paccar
Trucks and Parts-Hvy Duty
|
$104.26
|
+0.10
0.10% |
$105.00
|
2,120,844
92.45% of 50 DAV
50 DAV is 2,294,000
|
$104.37
-0.11%
|
1/23/2024
|
$100.35
|
PP = $98.57
|
|
MB = $103.50
|
Most Recent Note - 2/6/2024 6:05:11 PM
G - Hit a new all-time high with today's 4th consecutive gain and its color code is changed to green after wedging above its "max buy" level. Reported Dec '23 quarterly earnings +53% on +11% sales revenues versus the year-ago period, its 9th quarterly comparison with better than the +25% minimum earnings guideline (C criteria). There was a downturn in FY' 20 annual earnings (A criteria) like many companies during the pandemic.
>>> FEATURED STOCK ARTICLE : Volume-Driven Breakout for Paccar - 1/23/2024 |
View all notes |
Set NEW NOTE alert |
Company Profile |
SEC
News |
Chart |
Request a new note
C
A
S
I |
HUBB
-
NYSE
Hubbell
Electrical-Power/Equipmt
|
$350.25
|
-0.74
-0.21% |
$355.06
|
478,896
123.75% of 50 DAV
50 DAV is 387,000
|
$356.38
-1.72%
|
1/30/2024
|
$343.26
|
PP = $336.83
|
|
MB = $353.67
|
Most Recent Note - 2/2/2024 1:46:41 PM
Y - Hitting another new all-time high with today's volume-driven gain. Finished strong after highlighted in yellow in the 1/30/24 mid-day report with pivot point cited based on its 1/22/24 high after a cup-with-handle base.
>>> FEATURED STOCK ARTICLE : Volume Heavy Behind Breakout Gain for Hubbell - 1/30/2024 |
View all notes |
Set NEW NOTE alert |
Company Profile |
SEC
News |
Chart |
Request a new note
C
A
S
I |
MANH
-
NASDAQ
Manhattan Associates
Computer Sftwr-Enterprse
|
$247.39
|
-1.76
-0.71% |
$250.84
|
287,664
66.74% of 50 DAV
50 DAV is 431,000
|
$258.91
-4.45%
|
1/31/2024
|
$240.57
|
PP = $230.71
|
|
MB = $242.25
|
Most Recent Note - 2/6/2024 6:17:29 PM
G - Color code is changed to green while stubbornly holding its ground above its "max buy" level near its all-time high with volume totals cooling. Prior highs in the $230 area define near-term support to watch on pullbacks.
>>> FEATURED STOCK ARTICLE : Big Volume Behind Breakout Gain - 1/31/2024 |
View all notes |
Set NEW NOTE alert |
Company Profile |
SEC
News |
Chart |
Request a new note
C
A
S
I |
|
|
|
THESE ARE NOT BUY RECOMMENDATIONS!
Comments contained in the body of this report are technical
opinions only. The material herein has been obtained
from sources believed to be reliable and accurate, however,
its accuracy and completeness cannot be guaranteed.
This site is not an investment advisor, hence it does
not endorse or recommend any securities or other investments.
Any recommendation contained in this report may not
be suitable for all investors and it is not to be deemed
an offer or solicitation on our part with respect to
the purchase or sale of any securities. All trademarks,
service marks and trade names appearing in this report
are the property of their respective owners, and are
likewise used for identification purposes only.
This report is a service available
only to active Paid Premium Members.
You may opt-out of receiving report notifications
at any time. Questions or comments may be submitted
by writing to Premium Membership Services 665 S.E. 10 Street, Suite 201 Deerfield Beach, FL 33441-5634 or by calling 1-800-965-8307
or 954-785-1121.
|
|
|