You are not logged in.
This means you
CAN ONLY VIEW reports that were published prior to Wednesday, March 26, 2025.
You
MUST UPGRADE YOUR MEMBERSHIP if you want to see any current reports.
AFTER MARKET UPDATE - WEDNESDAY, JANUARY 17TH, 2018
Previous After Market Report Next After Market Report >>>
|
|
|
|
DOW |
+322.79 |
26,115.65 |
+1.25% |
|
Volume |
913,152,980 |
-17% |
|
Volume |
2,237,618,290 |
-6% |
|
NASDAQ |
+74.59 |
7,298.28 |
+1.03% |
|
Advancers |
1,910 |
65% |
|
Advancers |
1,375 |
58% |
|
S&P 500 |
+26.14 |
2,802.56 |
+0.94% |
|
Decliners |
1,027 |
35% |
|
Decliners |
979 |
42% |
|
Russell 2000 |
+13.69 |
1,586.66 |
+0.87% |
|
52 Wk Highs |
184 |
|
|
52 Wk Highs |
189 |
|
|
S&P 600 |
+9.19 |
969.31 |
+0.96% |
|
52 Wk Lows |
56 |
|
|
52 Wk Lows |
39 |
|
|
 |
Indices Notched Big Gains With Less Leadership and Lighter Volume
Kenneth J. Gruneisen - Passed the CAN SLIM® Master's Exam
U.S. equities closed higher Wednesday. The Dow surged 322 points to 26115. The S&P 500 added 26 points to 2802. The Nasdaq Composite gained 74 points to 7298. Volume totals reported were lighter than the prior session totals on the NYSE and on the Nasdaq exchange. Advancers led decliners by nearly a 2-1 margin on the NYSE and 7-5 on the Nasdaq exchange. New 52-week highs totals contracted yet still solidly outnumbered new 52-week lows totals on the NYSE and on the Nasdaq exchange. There were only 70 high-ranked companies from the Leaders List that made new 52-week highs and were listed on the BreakOuts Page, versus the total of 153 on the prior session. On Tuesday we noted that only 50 stocks from the higher total actually finished that session with a gain, but most had "negative reversals" and ended lower. The Featured Stocks Page provides the latest analysis on noteworthy high-ranked leaders. Charts used courtesy of www.stockcharts.com
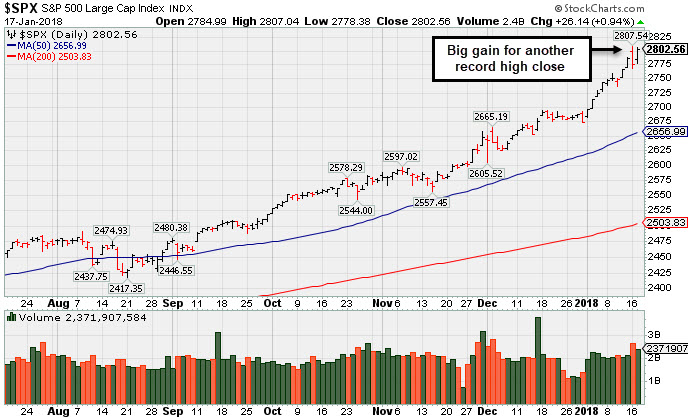 PICTURED: The S&P 500 Index posted a solid gain a new record high close on Wednesday. The major averages (M criteria) are in a confirmed uptrend. Investors should only consider stocks meeting all key criteria of the fact-based investment system as they trigger technical buy signals.
The Dow closed above 26,000 for the first time as investors focused on positive economic releases and strong corporate earnings reports. On the data front, a release showed U.S. industrial production jumped 0.9% in December, surpassing expectations of a 0.4% increase. Industrial output rose 1.8% in 2017, the largest annual increase since 2014. In the central bank sphere, the Fed’s Beige Book revealed 11 of 12 Federal Reserve districts experienced “modest to moderate” gains in economic activity. The 12th district, Dallas reported “robust” growth.
All 11 S&P 500 sectors finished higher. Technology shares paced the gains with International Business Machines (IBM +2.9%) up following a ratings upgrade ahead of Thursday’s earnings report. Apple (AAPL +1.65%) rose after announcing plans to repatriate billions in overseas cash. Consumer Staples also outperformed with Wal-Mart (WMT +2.00%) rising. In earnings news, shares of Goldman Sachs (GS -1.86%) fell as quarterly profits topped forecasts but trading revenue declined 50% in the most recent period.
Treasuries were mostly weaker, with the yield on the 10-year note rising three basis points to 2.57%. In commodities, NYMEX WTI crude gained 0.3% to $63.92/barrel. COMEX gold was off 0.6% to $1328.50/ounce amid a stronger dollar. |
 Kenneth J. Gruneisen started out as a licensed stockbroker in August 1987, a couple of months prior to the historic stock market crash that took the Dow Jones Industrial Average down -22.6% in a single day. He has published daily fact-based fundamental and technical analysis on high-ranked stocks online for two decades. Through FACTBASEDINVESTING.COM, Kenneth provides educational articles, news, market commentary, and other information regarding proven investment systems that work in good times and bad.
Comments contained in the body of this report are technical opinions only and are not necessarily those of Gruneisen Growth Corp. The material herein has been obtained from sources believed to be reliable and accurate, however, its accuracy and completeness cannot be guaranteed. Our firm, employees, and customers may effect transactions, including transactions contrary to any recommendation herein, or have positions in the securities mentioned herein or options with respect thereto. Any recommendation contained in this report may not be suitable for all investors and it is not to be deemed an offer or solicitation on our part with respect to the purchase or sale of any securities. |
|
 |
Tech Sector Gains Outpaced Financial, Retail, and Energy Groups
Kenneth J. Gruneisen - Passed the CAN SLIM® Master's Exam
The Retail Index ($RLX +0.31%), Bank Index ($BKX +0.51%), and the Broker/Dealer Index ($XBD +0.61%) each posted gains on Wednesday. The tech sector was led by big gains from the Semiconductor Index ($SOX +2.89%) and the Biotechnology Index ($BTK +2.25%), and the Networking Index ($NWX +0.90%) posted a smaller gain. The Integrated Oil Index ($XOI +0.98%) and the Oil Services Index ($OSX +0.49%) both posted gains while the Gold & Silver Index ($XAU -1.27) was a standout decliner. Charts courtesy wwwstockcharts.com
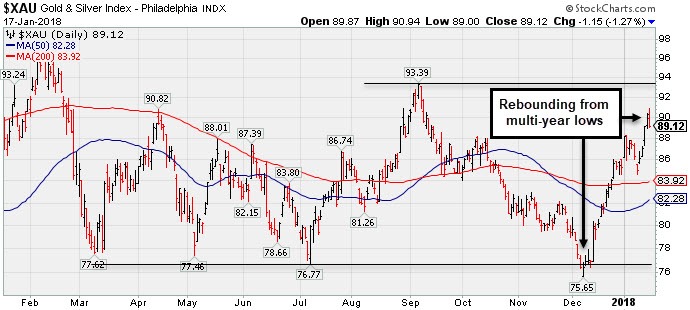 PICTURED: The Gold & Silver Index ($XAU -1.27) has been rebounding from multi-year lows hit in early December.
| Oil Services |
$OSX |
161.48 |
+0.80 |
+0.50% |
+7.98% |
| Integrated Oil |
$XOI |
1,425.09 |
+13.84 |
+0.98% |
+6.70% |
| Semiconductor |
$SOX |
1,364.29 |
+38.32 |
+2.89% |
+8.88% |
| Networking |
$NWX |
515.69 |
+4.62 |
+0.90% |
+5.13% |
| Broker/Dealer |
$XBD |
281.43 |
+1.71 |
+0.61% |
+6.10% |
| Retail |
$RLX |
1,885.00 |
+5.79 |
+0.31% |
+8.72% |
| Gold & Silver |
$XAU |
89.12 |
-1.15 |
-1.27% |
+4.52% |
| Bank |
$BKX |
113.18 |
+0.58 |
+0.52% |
+6.06% |
| Biotech |
$BTK |
4,490.44 |
+98.89 |
+2.25% |
+6.35% |
|
|
|
 |
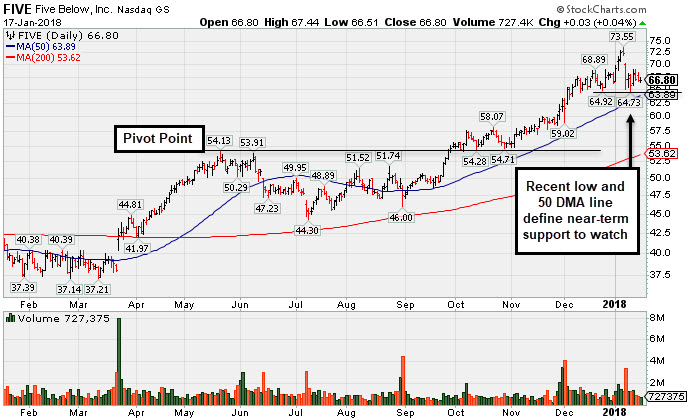
Consolidating After Negating Breakout From Advanced Base
Kenneth J. Gruneisen - Passed the CAN SLIM® Master's Exam
Five Below Inc (FIVE +$0.03 or +0.04% to $66.80) is consolidating after weak action on 1/08/18 negated a recent breakout from an advanced "3 weeks tight" base. The recent low ($64.73 on 1/10/18) defines important near term support above its 50-day moving average (DMA) line ($63.98) where damaging losses may trigger technical sell signals.
FIVE was last shown in this FSU section on 12/19/17 with an annotated graph under the headline, "Retail - Discount & Variety Firm Has Strong Fundamentals". It has traded up as much as +44.89% since highlighted in yellow with new pivot point cited based on its 5/19/17 high plus 10 cents in the 10/06/17 mid-day report (read here).
Fundamentals remain very strong as it reported earnings +80% on +29% sales revenues for the Oct '17 quarter, continuing its strong earnings track record. The Retail - Discount & Variety firm has a highest possible 99 Earnings Per Share Rating and matches the fact-based investment system's winning models with a good annual earnings (A criteria) track record. It has been showing acceleration in sales revenues and earnings in sequential quarterly comparisons.
FIVE had a choppy history since its $17 IPO in July 2012 and 3 subsequent Secondary Offerings. It has a small supply of 55.2 million shares outstanding (S criteria). Its current Timeliness Rating is A and its Sponsorship Rating is C. The number of top-rated funds owning its shares rose from 432 in Jun '16 to 460 in Dec '17, a reassuring sign concerning the I criteria. Its current Up/Down Volume Ratio of 1.5 is an unbiased indication its shares have been under slight accumulation over the past 50 days.
|
|
|
Color Codes Explained :
Y - Better candidates highlighted by our
staff of experts.
G - Previously featured
in past reports as yellow but may no longer be buyable under the
guidelines.
***Last / Change / Volume data in this table is the closing quote data***
Symbol/Exchange
Company Name
Industry Group |
PRICE |
CHANGE
(%Change) |
Day High |
Volume
(% DAV)
(% 50 day avg vol) |
52 Wk Hi
% From Hi |
Featured
Date |
Price
Featured |
Pivot Featured |
|
Max Buy |
THO
-
NYSE
Thor Industries Inc
AUTOMOTIVE - Recreational Vehicles
|
$155.41
|
+2.93
1.92% |
$155.92
|
400,797
67.14% of 50 DAV
50 DAV is 597,000
|
$159.17
-2.36%
|
12/19/2017
|
$153.92
|
PP = $156.96
|
|
MB = $164.81
|
Most Recent Note - 1/12/2018 7:13:56 PM
Y - Touched a new high today, but rather than rally it reversed into the red and ended the session with a loss on higher (near average) volume. Holding its ground in a tight range for the past 7 weeks. It has not yet produced gains above the pivot point backed by at least the +40% above average volume needed to trigger a new (or add-on) technical buy signal. Its 50 DMA line ($145.74) defines near-term support to watch above prior highs in the $138 area. Fundamentals remain very strong.
>>> FEATURED STOCK ARTICLE : Holding Ground in Tight Range Near High - 12/27/2017 |
View all notes |
Set NEW NOTE alert |
Company Profile |
SEC
News |
Chart |
Request a new note
C
A
S
I |
ROG
-
NYSE
Rogers Corp
CONSUMER NON-DURABLES - Rubber and Plastics
|
$175.74
|
+2.45
1.41% |
$176.15
|
76,345
41.72% of 50 DAV
50 DAV is 183,000
|
$184.00
-4.49%
|
12/29/2017
|
$162.92
|
PP = $168.17
|
|
MB = $176.58
|
Most Recent Note - 1/12/2018 7:19:50 PM
Y - Posted a gain with light volume today for its 2nd best close ever, consolidating after triggering a technical buy signal last week. Raised concerns after a big "negative reversal" at a new all-time high on 1/03/18. Disciplined investors avoid chasing stocks more than 5% above prior highs and always limit losses by selling any stock that falls more than -7% from their purchase price.
>>> FEATURED STOCK ARTICLE : Hovering Near Prior High After 3rd Strong Quarterly Earnings - 12/29/2017 |
View all notes |
Set NEW NOTE alert |
Company Profile |
SEC
News |
Chart |
Request a new note
C
A
S
I |
AVGO
-
NASDAQ
Avago Technologies Ltd
ELECTRONICS - Semiconductor - Broad Line
|
$265.81
|
+2.56
0.97% |
$266.53
|
3,727,323
112.48% of 50 DAV
50 DAV is 3,313,900
|
$285.68
-6.96%
|
1/5/2018
|
$271.62
|
PP = $285.78
|
|
MB = $300.07
|
Most Recent Note - 1/12/2018 7:16:30 PM
G - Color code is changed to green as its Relative Strength rating has slumped to 75, below the 80+ minimum guideline for buy candidates. Also sputtering below its 50 DMA line ($267.10) this week. The recent low ($254.20 on 12/06/17) defines important support below its short-term average. Damaging violations would raise greater concerns. Fundamentals remain strong.
>>> FEATURED STOCK ARTICLE : New Pivot Point Cited After Rebound Above 50-Day Moving Average - 1/5/2018 |
View all notes |
Set NEW NOTE alert |
Company Profile |
SEC
News |
Chart |
Request a new note
C
A
S
I |
TPL
-
NYSE
Texas Pacific Land Trust
FINANCIAL SERVICES - Diversified Investments
|
$534.99
|
+16.89
3.26% |
$537.07
|
15,847
105.65% of 50 DAV
50 DAV is 15,000
|
$546.45
-2.10%
|
12/21/2017
|
$419.50
|
PP = $435.09
|
|
MB = $456.84
|
 Most Recent Note - 1/17/2018 6:14:15 PM
G - Posted a gain with average volume today for its second best close. Very extended from the prior base. Disciplined investors avoid chasing stocks more than +5% above the prior high or pivot point. Prior highs in the $434 area define initial support to watch on pullbacks.
>>> FEATURED STOCK ARTICLE : Real Estate Trust Perched Within Striking Distance of Prior High - 12/21/2017 |
View all notes |
Set NEW NOTE alert |
Company Profile |
SEC
News |
Chart |
Request a new note
C
A
S
I |
YY
-
NASDAQ
YY Inc
INTERNET - Internet Service Providers
|
$134.94
|
+3.73
2.84% |
$135.94
|
1,190,686
80.40% of 50 DAV
50 DAV is 1,481,000
|
$141.95
-4.94%
|
12/29/2017
|
$113.06
|
PP = $123.58
|
|
MB = $129.76
|
Most Recent Note - 1/17/2018 6:16:29 PM
G - Perched near its all-time high, consolidating after rising well above its "max buy" level. Recent gains above the pivot point lacked the necessary minimum +40% above average volume needed to meet the guidelines for a proper technical buy signal. Its 50 DMA line ($110) defines support above the recent low ($98.50 on 12/06/17). This China-based Internet - Content firm's fundamentals remain strong.
>>> FEATURED STOCK ARTICLE : Touched a New High But Ended Below New Pivot Point Cited - 1/4/2018 |
View all notes |
Set NEW NOTE alert |
Company Profile |
SEC
News |
Chart |
Request a new note
C
A
S
I |
Symbol/Exchange
Company Name
Industry Group |
PRICE |
CHANGE
(%Change) |
Day High |
Volume
(% DAV)
(% 50 day avg vol) |
52 Wk Hi
% From Hi |
Featured
Date |
Price
Featured |
Pivot Featured |
|
Max Buy |
HTHT
-
NASDAQ
China Lodging Group Ads
LEISURE - Lodging
|
$148.92
|
+1.57
1.07% |
$150.74
|
785,117
118.06% of 50 DAV
50 DAV is 665,000
|
$159.35
-6.55%
|
12/22/2017
|
$138.07
|
PP = $142.90
|
|
MB = $150.05
|
Most Recent Note - 1/16/2018 3:43:38 PM
Y - Encountering distributional pressure with today's big loss on above average volume. Color code is changed to yellow after retreating below its "max buy" level. Important near term chart support is defined by the prior high $142.80.
>>> FEATURED STOCK ARTICLE : Sales Revenues Growth Rate Shows Acceleration - 12/22/2017 |
View all notes |
Set NEW NOTE alert |
Company Profile |
SEC
News |
Chart |
Request a new note
C
A
S
I |
PATK
-
NASDAQ
Patrick Industries Inc
Bldg-Mobile/Mfg and RV
|
$65.10
|
-1.60
-2.40% |
$66.15
|
367,449
258.77% of 50 DAV
50 DAV is 142,000
|
$71.13
-8.47%
|
10/26/2017
|
$90.90
|
PP = $87.90
|
|
MB = $92.30
|
Most Recent Note - 1/17/2018 6:04:22 PM
G - Gapped down today for a volume-driven loss testing prior highs in the $64 area and its 50 DMA line ($64.78) while undercutting last week's low. More damaging losses would raise greater concerns. Fundamentals remain strong. Shares split 3/2 effective 12/11/17.
>>> FEATURED STOCK ARTICLE : Pulled Back From Record High With Higher Volume - 1/10/2018 |
View all notes |
Set NEW NOTE alert |
Company Profile |
SEC
News |
Chart |
Request a new note
C
A
S
I |
ESNT
-
NYSE
Essent Group Ltd
Finance-MrtgandRel Svc
|
$47.89
|
+0.11
0.23% |
$48.23
|
617,509
72.65% of 50 DAV
50 DAV is 850,000
|
$48.57
-1.40%
|
10/9/2017
|
$39.75
|
PP = $41.54
|
|
MB = $43.62
|
Most Recent Note - 1/12/2018 7:21:39 PM
G - extended from any sound base, it hit a new all-time high with today's 7th consecutive gain. Recent lows in the $43.00 area define important support where more damaging losses would raise greater concerns.
>>> FEATURED STOCK ARTICLE : Perched Near High After Brief Consolidation Below 50 DMA Line - 1/9/2018 |
View all notes |
Set NEW NOTE alert |
Company Profile |
SEC
News |
Chart |
Request a new note
C
A
S
I |
FIVE
-
NASDAQ
Five Below Inc
Retail-DiscountandVariety
|
$66.80
|
+0.03
0.04% |
$67.44
|
725,190
62.90% of 50 DAV
50 DAV is 1,153,000
|
$73.55
-9.18%
|
1/2/2018
|
$69.16
|
PP = $68.99
|
|
MB = $72.44
|
Most Recent Note - 1/12/2018 7:29:19 PM
Y - Recent low ($64.73 on 1/10/18) defines important near term support above its 50 DMA line ($63.46) while consolidating. Weak action on 1/08/18 negated a recent breakout from an advanced "3 weeks tight" base. Fundamentals remain very strong.
>>> FEATURED STOCK ARTICLE : Consolidating After Negating Breakout From Advanced Base - 1/17/2018 |
View all notes |
Set NEW NOTE alert |
Company Profile |
SEC
News |
Chart |
Request a new note
C
A
S
I |
OLED
-
NASDAQ
Universal Display Corp
Elec-Misc Products
|
$203.45
|
+5.05
2.55% |
$205.00
|
1,010,087
104.89% of 50 DAV
50 DAV is 963,000
|
$203.30
0.07%
|
1/8/2018
|
$191.68
|
PP = $192.85
|
|
MB = $202.49
|
Most Recent Note - 1/17/2018 6:10:26 PM
G - Color code is changed to green after quietly rising above its "max buy" level. Stubbornly held its ground since its gain on 1/08/18 triggered a convincing new (or add-on) technical buy signal. Near term support is at its 50 DMA line ($178.23). Subsequent losses leading to a violation may trigger a technical sell signal. Fundamentals remain very strong.
>>> FEATURED STOCK ARTICLE : Technical Breakout With Volume-Driven Gain For New High - 1/8/2018 |
View all notes |
Set NEW NOTE alert |
Company Profile |
SEC
News |
Chart |
Request a new note
C
A
S
I |
Symbol/Exchange
Company Name
Industry Group |
PRICE |
CHANGE
(%Change) |
Day High |
Volume
(% DAV)
(% 50 day avg vol) |
52 Wk Hi
% From Hi |
Featured
Date |
Price
Featured |
Pivot Featured |
|
Max Buy |
ANET
-
NYSE
Arista Networks Inc
TELECOMMUNICATIONS - Communication Equipment
|
$262.81
|
+10.04
3.97% |
$264.61
|
895,980
97.81% of 50 DAV
50 DAV is 916,000
|
$262.84
-0.01%
|
1/8/2018
|
$248.88
|
PP = $245.75
|
|
MB = $258.04
|
Most Recent Note - 1/17/2018 6:12:26 PM
G - Color code is changed to green after rising back above its "max buy" level. Prior highs in the $245 area define initial support to watch above its 50 DMA line ($232).
>>> FEATURED STOCK ARTICLE : Encountering Distributional Pressure After Wedging Near Prior High - 1/2/2018 |
View all notes |
Set NEW NOTE alert |
Company Profile |
SEC
News |
Chart |
Request a new note
C
A
S
I |
PAYC
-
NYSE
Paycom Software Inc
COMPUTER SOFTWARE and SERVICES - Application Software
|
$88.35
|
+1.40
1.61% |
$88.71
|
463,066
85.91% of 50 DAV
50 DAV is 539,000
|
$90.92
-2.82%
|
1/12/2018
|
$87.93
|
PP = $86.20
|
|
MB = $90.51
|
Most Recent Note - 1/16/2018 6:39:48 PM
Y - There was a "negative reversal" today for a loss with above average volume after hitting a new all-time high. Prior highs near $86 define initial support to watch. See the latest FSU analysis for more details and an annotated graph.
>>> FEATURED STOCK ARTICLE : Finished Strong With Big Gain on +118% Above Average Volume - 1/12/2018 |
View all notes |
Set NEW NOTE alert |
Company Profile |
SEC
News |
Chart |
Request a new note
C
A
S
I |
GRUB
-
NYSE
Grubhub Inc
COMPUTER SOFTWARE and SERVICES - Technical and System Software
|
$70.80
|
+0.96
1.37% |
$71.05
|
1,109,882
92.95% of 50 DAV
50 DAV is 1,194,000
|
$74.81
-5.35%
|
6/21/2017
|
$47.33
|
PP = $46.94
|
|
MB = $49.29
|
Most Recent Note - 1/12/2018 6:58:09 PM
G - Found prompt support near its 50 DMA line ($68.06) this week and rose further today on higher volume helping its outlook improve. Subsequent losses undercutting the latest low ($66.28) would raise greater concerns. See the latest FSU for additional details and an annotated graph.
>>> FEATURED STOCK ARTICLE : Prompt Rebound Above 50-Day Moving Average Helped Outlook - 1/11/2018 |
View all notes |
Set NEW NOTE alert |
Company Profile |
SEC
News |
Chart |
Request a new note
C
A
S
I |
IBP
-
NYSE
Installed Building Prod
DIVERSIFIED SERVICES - Business/Management Services
|
$74.30
|
+1.90
2.62% |
$75.05
|
334,051
167.03% of 50 DAV
50 DAV is 200,000
|
$79.40
-6.42%
|
12/26/2017
|
$75.00
|
PP = $79.50
|
|
MB = $83.48
|
Most Recent Note - 1/17/2018 6:08:34 PM
Y - Posted a solid gain on even higher volume today while consolidating in an orderly fashion above its 50 DMA line ($72.03). Volume-driven gains for new highs may trigger a new (or add-on) technical buy signal. Subsequent losses leading to violations of the 50 DMA line or recent low ($68.30 on 12/13/17) may trigger technical sell signals. Fundamentals remain very strong.
>>> FEATURED STOCK ARTICLE : Building on an Advanced Ascending Base Pattern - 12/26/2017 |
View all notes |
Set NEW NOTE alert |
Company Profile |
SEC
News |
Chart |
Request a new note
C
A
S
I |
OLLI
-
NASDAQ
Ollie's Bargain Outlet
Retail-DiscountandVariety
|
$54.60
|
-0.05
-0.09% |
$55.10
|
581,677
98.92% of 50 DAV
50 DAV is 588,000
|
$56.65
-3.62%
|
11/21/2017
|
$46.78
|
PP = $47.00
|
|
MB = $49.35
|
Most Recent Note - 1/12/2018 7:01:19 PM
G - Hit another new high with today's gain backed by +20% above average volume, getting more extended from any sound base. Its 50 DMA line ($48.88) defines important near-term support above prior highs in the $46 area. Fundamentals remain very strong.
>>> FEATURED STOCK ARTICLE : Extended From Latest Base and Perched Near Record High - 12/20/2017 |
View all notes |
Set NEW NOTE alert |
Company Profile |
SEC
News |
Chart |
Request a new note
C
A
S
I |
Symbol/Exchange
Company Name
Industry Group |
PRICE |
CHANGE
(%Change) |
Day High |
Volume
(% DAV)
(% 50 day avg vol) |
52 Wk Hi
% From Hi |
Featured
Date |
Price
Featured |
Pivot Featured |
|
Max Buy |
WB
-
NASDAQ
Weibo Corp Cl A Ads
INTERNET - Content
|
$129.20
|
+6.01
4.88% |
$130.89
|
1,893,299
100.02% of 50 DAV
50 DAV is 1,893,000
|
$128.37
0.65%
|
1/16/2018
|
$126.33
|
PP = $122.21
|
|
MB = $128.32
|
Most Recent Note - 1/17/2018 6:06:51 PM
G - Color code is changed to green after quickly rallying and closing above its "max buy" level. Gain on prior session was backed by +60% above average volume and it closed above the pivot point, clinching a technical buy signal. Highlighted in yellow on 1/16/18 in the mid-day report with pivot point cited based on its 1/08/18 high after an 8-week cup-with-handle base. Limited annual earnings (A criteria) history for this China-based Internet - Content firm remains a concern. See the latest FSU analysis and an annotated graph.
>>> FEATURED STOCK ARTICLE : Close in Session's Lower Third a Sign of Distributional Pressure - 1/16/2018 |
View all notes |
Set NEW NOTE alert |
Company Profile |
SEC
News |
Chart |
Request a new note
C
A
S
I |
HLI
-
NYSE
Houlihan Lokey Inc Cl A
Finance-Invest Bnk/Bkrs
|
$50.22
|
+0.08
0.16% |
$50.26
|
221,062
115.74% of 50 DAV
50 DAV is 191,000
|
$51.45
-2.39%
|
1/3/2018
|
$45.88
|
PP = $47.09
|
|
MB = $49.44
|
Most Recent Note - 1/12/2018 7:07:14 PM
G - Color code is changed to green after rallying above its "max buy" with +54% above average volume behind today's 5th consecutive gain. Its 50 DMA line ($44.55) defines near-term support to watch on pullbacks. On 10/26/17 it completed a Secondary Offering. Fundamentals remain strong.
>>> FEATURED STOCK ARTICLE : Tight Weekly Closes Formed Advanced Base Pattern - 1/3/2018 |
View all notes |
Set NEW NOTE alert |
Company Profile |
SEC
News |
Chart |
Request a new note
C
A
S
I |
|
|
|
THESE ARE NOT BUY RECOMMENDATIONS!
Comments contained in the body of this report are technical
opinions only. The material herein has been obtained
from sources believed to be reliable and accurate, however,
its accuracy and completeness cannot be guaranteed.
This site is not an investment advisor, hence it does
not endorse or recommend any securities or other investments.
Any recommendation contained in this report may not
be suitable for all investors and it is not to be deemed
an offer or solicitation on our part with respect to
the purchase or sale of any securities. All trademarks,
service marks and trade names appearing in this report
are the property of their respective owners, and are
likewise used for identification purposes only.
This report is a service available
only to active Paid Premium Members.
You may opt-out of receiving report notifications
at any time. Questions or comments may be submitted
by writing to Premium Membership Services 665 S.E. 10 Street, Suite 201 Deerfield Beach, FL 33441-5634 or by calling 1-800-965-8307
or 954-785-1121.
|
|
|