You are not logged in.
This means you
CAN ONLY VIEW reports that were published prior to Tuesday, March 25, 2025.
You
MUST UPGRADE YOUR MEMBERSHIP if you want to see any current reports.
AFTER MARKET UPDATE - TUESDAY, DECEMBER 22ND, 2020
Previous After Market Report Next After Market Report >>>
|
|
|
|
DOW |
-200.94 |
30,015.51 |
-0.67% |
|
Volume |
909,279,125 |
-21% |
|
Volume |
5,627,207,200 |
+11% |
|
NASDAQ |
+62.35 |
12,804.87 |
+0.49% |
|
Advancers |
1,330 |
43% |
|
Advancers |
2,024 |
55% |
|
S&P 500 |
-7.66 |
3,687.26 |
-0.21% |
|
Decliners |
1,790 |
57% |
|
Decliners |
1,684 |
45% |
|
Russell 2000 |
+19.55 |
1,989.88 |
+0.99% |
|
52 Wk Highs |
296 |
|
|
52 Wk Highs |
433 |
|
|
S&P 600 |
+4.85 |
1,109.45 |
+0.44% |
|
52 Wk Lows |
4 |
|
|
52 Wk Lows |
12 |
|
|
 |
Nasdaq Composite Index Outpaced Peers as Leadership Improved
Kenneth J. Gruneisen - Passed the CAN SLIM® Master's Exam
The S&P 500 fell for a third straight session, slipping 0.2%. The Dow fell 200 points, while the Nasdaq Composite bucked the downtrend with a 0.5% advance to close at a fresh record high. Tuesday's volume totals were mixed, lighter than the prior session on the NYSE and higher on the Nasdaq exchange. Decliners led advancers by almost a 3-2 margin on the NYSE while advancers led decliners by a 5-4 margin on the Nasdaq exchange. There were 74 high-ranked companies from the Leaders List that hit new 52-week highs and were listed on the BreakOuts Page, versus the total of 48 on the prior session. New 52-week highs totals expanded and solidly outnumbered new 52-week lows. The major indices are in a confirmed uptrend (M criteria). Investors are reminded to always make buying and selling decisions based based on the strict criteria and rules of the fact-based investment system. 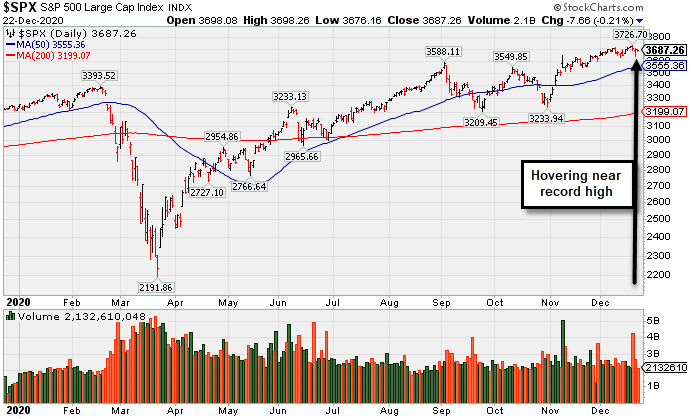 PICTURED: The S&P 500 Index is hovering near its record high.
Stocks ended mixed on Tuesday, as investors weighed lingering virus concerns and assessed the long-awaited passage of a $900 billion coronavirus relief package. Sentiment remained fragile on reports that a highly contagious strain of COVID-19 has likely spread to a number of countries. However, the CEO of BioNTech (BNTX -5.54%) said he was confident the company’s joint vaccine with Pfizer (PFE -1.71%) would be effective against the new variant.
Economic data was also in focus, with the Conference Board’s gauge of consumer confidence unexpectedly falling to a four month low in December, and the November reading downwardly revised to 92.9 from 96.1. Meanwhile, the final update of third quarter U.S. GDP showed the economy grew at an improved 33.4% annualized pace versus the prior 33.1% clip. Separately, existing home sales slipped for the first time in six months in November, as anticipated. Treasuries advanced, with the yield on the 10-year note down one basis point to 0.92%.
Nine of 11 S&P 500 sectors finished in negative territory, with Technology and Real Estate stocks the lone advancers. In corporate news, Apple (AAPL +2.85%) rose after a report showed the iPhone maker plans to develop a self-driving car that could be in production as soon as 2024. CarMax (KMX -8.09%) fell after noting demand and sales softened in the third quarter. Peloton (PTON +11.65%) gapped up for a new all-time high after announcing it will acquire commercial fitness equipment maker Precor for $420 million in cash. |
 Kenneth J. Gruneisen started out as a licensed stockbroker in August 1987, a couple of months prior to the historic stock market crash that took the Dow Jones Industrial Average down -22.6% in a single day. He has published daily fact-based fundamental and technical analysis on high-ranked stocks online for two decades. Through FACTBASEDINVESTING.COM, Kenneth provides educational articles, news, market commentary, and other information regarding proven investment systems that work in good times and bad.
Comments contained in the body of this report are technical opinions only and are not necessarily those of Gruneisen Growth Corp. The material herein has been obtained from sources believed to be reliable and accurate, however, its accuracy and completeness cannot be guaranteed. Our firm, employees, and customers may effect transactions, including transactions contrary to any recommendation herein, or have positions in the securities mentioned herein or options with respect thereto. Any recommendation contained in this report may not be suitable for all investors and it is not to be deemed an offer or solicitation on our part with respect to the purchase or sale of any securities. |
|
 |
Networking Index Rose; Commodity-Linked Groups Fell
Kenneth J. Gruneisen - Passed the CAN SLIM® Master's Exam
The Networking Index ($NWX +1.60%) led the tech sector while the Semiconductor Index ($SOX -0.12%) and Biotech Index ($BTK +0.04%) were little changed The Bank Index ($BKX -1.12%) lost ground while the Broker/Dealer Index ($XBD +0.16%) and Retail Index ($RLX -0.06%) also were little changed. Commodity-linked groups had a negative bias as the Gold & Silver Index ($XAU -3.31%) outpaced the Integrated Oil Index ($XOI -1.57%) and Oil Services Index ($OSX -0.95%) to the downside.
PICTURED: The Bank Index ($BKX -1.12%) is holding its ground in a tight range after rallying above its June high.
| Oil Services |
$OSX |
43.34 |
-0.42 |
-0.95% |
-44.64% |
| Integrated Oil |
$XOI |
772.89 |
-12.30 |
-1.57% |
-39.17% |
| Semiconductor |
$SOX |
2,744.11 |
-3.18 |
-0.12% |
+48.36% |
| Networking |
$NWX |
718.22 |
+11.32 |
+1.60% |
+23.11% |
| Broker/Dealer |
$XBD |
373.25 |
+0.58 |
+0.16% |
+28.54% |
| Retail |
$RLX |
3,529.92 |
-1.99 |
-0.06% |
+44.12% |
| Gold & Silver |
$XAU |
140.53 |
-4.81 |
-3.31% |
+31.43% |
| Bank |
$BKX |
94.11 |
-1.06 |
-1.12% |
-16.98% |
| Biotech |
$BTK |
5,940.43 |
+2.34 |
+0.04% |
+17.23% |
|
|
|
 |
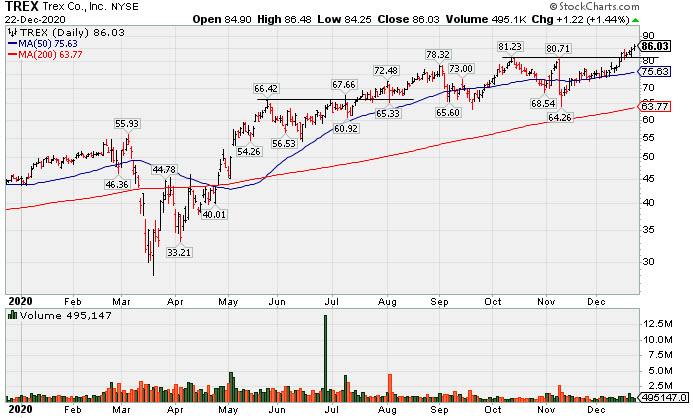
Hit New High With Light Volume Behind 4th Consecutive Gain
Kenneth J. Gruneisen - Passed the CAN SLIM® Master's Exam
Trex Company Inc (TREX +$1.22 or +1.44% to $86.03) hit yet another new 52-week high with today's 4th consecutive gain. Its 50-day moving average (DMA) line ($75.63) defines near-term support to watch. Volume-driven gains helped its technical stance and outlook improve.
Recently it reported Sep '20 quarterly earnings +14% on +19% sales revenues versus the year ago period, below the +25% minimum guideline (C criteria) raising fundamental concerns while breaking a streak of 4 consecutive quarterly comparisons above the +25% minimum earnings guideline (C criteria).
TREX last appeared in this FSU section on 12/01/20 with an annotated graph under the headline, "Consolidating Back Above 50-Day Moving Average Line". It has a 95 Earnings Per Share Rating. Annual earnings (A criteria) growth has been strong. The company hails from the General Building Materials industry group which currently has a Group Relative Strength Rating of (70) B+.
The company has a new CEO as of 4/29/20. After a 2:1 share split effective 9/15/20 it now has a supply (S criteria) of 115.8 million shares outstanding. The number of top-rated funds owning its shares rose from 540 in Jun '19 to 770 in Sep '20, a reassuring sign concerning the I criteria. Its current Up/Down Volume Ratio of 1.1 is an unbiased indication its shares have been under slight accumulation over the past 50 days. It has a Timeliness rating of B and a Sponsorship Rating of B.
|
|
|
Color Codes Explained :
Y - Better candidates highlighted by our
staff of experts.
G - Previously featured
in past reports as yellow but may no longer be buyable under the
guidelines.
***Last / Change / Volume data in this table is the closing quote data***
Symbol/Exchange
Company Name
Industry Group |
PRICE |
CHANGE
(%Change) |
Day High |
Volume
(% DAV)
(% 50 day avg vol) |
52 Wk Hi
% From Hi |
Featured
Date |
Price
Featured |
Pivot Featured |
|
Max Buy |
 CRL
-
NYSE
CRL
-
NYSE
Charles River Labs Intl
DRUGS - Biotechnology
|
$252.62
|
+1.90
0.76% |
$254.28
|
215,886
66.43% of 50 DAV
50 DAV is 325,000
|
$257.88
-2.04%
|
12/17/2020
|
$247.06
|
PP = $257.98
|
|
MB = $270.88
|
 Most Recent Note - 12/22/2020 5:14:13 PM
Y - Posted a 4th consecutive gain today with light volume for a best ever close. Color code was changed to yellow with new pivot point cited based on its 11/09/20 high plus 10 cents. Subsequent gains above its pivot point backed by at least +40% above average volume may trigger a new (or add-on) technical buy signal. Its 50 DMA line ($237) has been acting as support. Reported Sep '20 quarterly earnings +38% on +11% sales revenues versus the year ago period, above the +25% minimum earnings guideline (C criteria).
>>> FEATURED STOCK ARTICLE : CRL Consolidating Above 50-Day Moving Average Line - 12/14/2020 |
View all notes |
Set NEW NOTE alert |
Company Profile |
SEC
News |
Chart |
Request a new note
C
A
S
I |
AMD
-
NASDAQ
Advanced Micro Devices
ELECTRONICS - Semiconductor - Broad Line
|
$93.16
|
-0.07
-0.08% |
$93.55
|
35,588,409
75.30% of 50 DAV
50 DAV is 47,264,000
|
$97.98
-4.92%
|
11/18/2020
|
$82.54
|
PP = $88.72
|
|
MB = $93.16
|
Most Recent Note - 12/21/2020 5:37:53 PM
G - Pulled back from its all-time high, slumping near its "max buy" level with average volume behind today's 4th consecutive loss. Its 50 DMA line ($85.73) defines important near term support to watch on pullbacks. See the latest FSU anaylsys for more details and a new annotated graph.
>>> FEATURED STOCK ARTICLE : Pulling Back From its Record High Hit Last Week - 12/21/2020 |
View all notes |
Set NEW NOTE alert |
Company Profile |
SEC
News |
Chart |
Request a new note
C
A
S
I |
TER
-
NASDAQ
Teradyne Inc
ELECTRONICS - Semiconductor Equipment and Mate
|
$118.57
|
-1.16
-0.97% |
$120.13
|
1,633,032
104.28% of 50 DAV
50 DAV is 1,566,000
|
$122.37
-3.11%
|
10/21/2020
|
$92.22
|
PP = $93.54
|
|
MB = $98.22
|
Most Recent Note - 12/21/2020 5:40:45 PM
G - Perched near its all-time high, stubbornly holding its ground. Support to watch on pullbacks is its 50 DMA line ($102.70).
>>> FEATURED STOCK ARTICLE : Stubbornly Holding Ground and Rising for a New High - 12/7/2020 |
View all notes |
Set NEW NOTE alert |
Company Profile |
SEC
News |
Chart |
Request a new note
C
A
S
I |
AMRC
-
NYSE
Ameresco Inc Cl A
ENERGY - Alternative
|
$53.22
|
+2.12
4.15% |
$54.05
|
509,765
137.40% of 50 DAV
50 DAV is 371,000
|
$51.11
4.13%
|
12/15/2020
|
$46.72
|
PP = $47.10
|
|
MB = $49.46
|
Most Recent Note - 12/22/2020 3:19:04 PM
G - Color code is changed to green after rallying above its "max buy" level and hitting new all-time highs with today's 4th consecutive gain. Prior highs in the $46-47 area define initial support to watch on pullbacks.
>>> FEATURED STOCK ARTICLE : Gain From Ascending Base Pattern Backed by Above Average Volume - 12/15/2020 |
View all notes |
Set NEW NOTE alert |
Company Profile |
SEC
News |
Chart |
Request a new note
C
A
S
I |
TREX
-
NYSE
Trex Company Inc
MATERIALS and CONSTRUCTION - General Building Materials
|
$86.03
|
+1.22
1.44% |
$86.48
|
495,147
64.30% of 50 DAV
50 DAV is 770,000
|
$85.50
0.62%
|
6/26/2020
|
$54.53
|
PP = $66.47
|
|
MB = $69.79
|
Most Recent Note - 12/22/2020 5:07:10 PM
G - Hit yet another new 52-week high with light volume behind today's 4th gain. Its 50 DMA line ($75.63) defines near-term support. Recently noted that it reported Sep '20 quarterly earnings +14% on +19% sales revenues versus the year ago period, below the +25% minimum guideline (C criteria) raising fundamental concerns. See the latest FSU analysis for more details and a new annotated graph.
>>> FEATURED STOCK ARTICLE : Hit New High With Light Volume Behind 4th Consecutive Gain - 12/22/2020 |
View all notes |
Set NEW NOTE alert |
Company Profile |
SEC
News |
Chart |
Request a new note
C
A
S
I |
Symbol/Exchange
Company Name
Industry Group |
PRICE |
CHANGE
(%Change) |
Day High |
Volume
(% DAV)
(% 50 day avg vol) |
52 Wk Hi
% From Hi |
Featured
Date |
Price
Featured |
Pivot Featured |
|
Max Buy |
CLFD
-
NASDAQ
Clearfield Inc
TELECOMMUNICATIONS - Cables / Satalite Equipment
|
$25.15
|
-0.01
-0.04% |
$25.74
|
70,227
68.85% of 50 DAV
50 DAV is 102,000
|
$28.32
-11.19%
|
11/17/2020
|
$22.06
|
PP = $26.07
|
|
MB = $27.37
|
Most Recent Note - 12/22/2020 5:12:49 PM
Y - Sputtering below the pivot point after churning higher volume last week without making meaningful price progress. Near term support is defined by its 50 DMA line ($23.36) and an upward trendline.
>>> FEATURED STOCK ARTICLE : Perched Near Pivot Point in Need of Confirming Gain on Volume - 12/10/2020 |
View all notes |
Set NEW NOTE alert |
Company Profile |
SEC
News |
Chart |
Request a new note
C
A
S
I |
NOW
-
NYSE
Servicenow Inc
Computer Sftwr-Enterprse
|
$561.72
|
+10.90
1.98% |
$562.50
|
1,178,756
87.25% of 50 DAV
50 DAV is 1,351,000
|
$566.74
-0.89%
|
8/20/2020
|
$453.34
|
PP = $454.79
|
|
MB = $477.53
|
Most Recent Note - 12/22/2020 5:10:29 PM
G - Posted a gain today with light volume for its second best ever close. Found prompt support near its 50 DMA line and stubbornly held its ground in recent weeks. Recently reported Sep '20 quarterly earnings +22% on +30% sales revenues versus the year ago period, below the +25% minimum guideline (C criteria) of the fact-based investment system.
>>> FEATURED STOCK ARTICLE : Hit New Record High With Light Volume Behind Gain - 12/17/2020 |
View all notes |
Set NEW NOTE alert |
Company Profile |
SEC
News |
Chart |
Request a new note
C
A
S
I |
ALRM
-
NASDAQ
Alarm.com Holdings Inc
Security/Sfty
|
$100.30
|
+4.54
4.74% |
$100.51
|
437,989
114.96% of 50 DAV
50 DAV is 381,000
|
$96.39
4.06%
|
11/6/2020
|
$71.88
|
PP = $74.76
|
|
MB = $78.50
|
Most Recent Note - 12/22/2020 5:08:50 PM
G - Powered to yet another new all-time high with today's 7th consecutive gain, getting very extended from any sound base. Prior high ($74.66 on 7/23/20) defines initial support to watch above its 50 DMA line ($71).
>>> FEATURED STOCK ARTICLE : Alarm Hits a New Record High - 12/4/2020 |
View all notes |
Set NEW NOTE alert |
Company Profile |
SEC
News |
Chart |
Request a new note
C
A
S
I |
TEAM
-
NASDAQ
Atlassian Corp Plc Cl A
Comp Sftwr-Spec Enterprs
|
$247.01
|
-1.18
-0.48% |
$250.01
|
1,165,466
57.93% of 50 DAV
50 DAV is 2,012,000
|
$250.03
-1.21%
|
10/12/2020
|
$193.77
|
PP = $199.60
|
|
MB = $209.58
|
Most Recent Note - 12/22/2020 5:15:48 PM
G - Volume totals cooled while stubbornly holding its ground perched at its 52-week high. Showed resilience and strength after earnings rose +7% on +26% sales revenues for the Sep '20 quarter versus the year ago period, below the +25% minimum earnings guideline (C criteria), raising concerns.
>>> FEATURED STOCK ARTICLE : Extended From Any Base After Streak of Gains for New Highs - 12/18/2020 |
View all notes |
Set NEW NOTE alert |
Company Profile |
SEC
News |
Chart |
Request a new note
C
A
S
I |
SHOP
-
NYSE
Shopify Inc Cl A
Computer Sftwr-Enterprse
|
$1,277.08
|
+79.82
6.67% |
$1,285.19
|
2,466,926
167.48% of 50 DAV
50 DAV is 1,473,000
|
$1,206.90
5.81%
|
12/16/2020
|
$1,146.00
|
PP = $1,147.01
|
|
MB = $1,204.36
|
Most Recent Note - 12/22/2020 12:41:13 PM
G - Color code is changed to green after rallying above its "max buy" level for new all-time highs with today's big gain. Its 50 DMA line ($1,032) defines near-term support to watch above its 200 DMA line ($866). Reported Sep '20 quarterly earnings of $1.13 per share versus a loss of 29 cents per share on +96% sales revenues versus the year ago period. The Ontario, Canada-based Computer Software - Enterprise firm's prior quarters showed big earnings increases well above the +25% minimum guideline (C criteria) with very strong underlying sales revenues growth. After years of losses it had strong earnings growth in FY '17-19 (A criteria).
>>> FEATURED STOCK ARTICLE : Volume-Driven Gain for New High After Long Consolidation - 12/16/2020 |
View all notes |
Set NEW NOTE alert |
Company Profile |
SEC
News |
Chart |
Request a new note
C
A
S
I |
Symbol/Exchange
Company Name
Industry Group |
PRICE |
CHANGE
(%Change) |
Day High |
Volume
(% DAV)
(% 50 day avg vol) |
52 Wk Hi
% From Hi |
Featured
Date |
Price
Featured |
Pivot Featured |
|
Max Buy |
YETI
-
NYSE
Yeti Holdings Inc
Leisure-Products
|
$74.32
|
+2.09
2.89% |
$74.82
|
579,624
46.93% of 50 DAV
50 DAV is 1,235,000
|
$74.66
-0.46%
|
11/5/2020
|
$57.25
|
PP = $55.14
|
|
MB = $57.90
|
Most Recent Note - 12/22/2020 3:21:33 PM
G - Quietly wedging to new all-time highs with recent gains lacking great volume conviction. Its 50 DMA line ($59.54) defines initial support to watch above prior highs in the $55-54 area.
>>> FEATURED STOCK ARTICLE : Volume Totals Cooloing While Stubbornly Holding Ground at High - 12/2/2020 |
View all notes |
Set NEW NOTE alert |
Company Profile |
SEC
News |
Chart |
Request a new note
C
A
S
I |
AAXN
-
NASDAQ
Axon Enterprise Inc
Security/Sfty
|
$128.50
|
+0.63
0.49% |
$131.63
|
939,117
171.69% of 50 DAV
50 DAV is 547,000
|
$130.41
-1.46%
|
12/22/2020
|
$127.84
|
PP = $130.51
|
|
MB = $137.04
|
Most Recent Note - 12/22/2020 12:16:07 PM
Y - Color code is changed to yellow after a 4-week square box base pattern. Touched a new all-time high earlier with today's 4th consecutive gain. A solid gain and close above the pivot point backed by at least +40% above average volume may trigger a new (or add-on) technical buy signal. Its 50 DMA line ($116.42) defines near term support to watch on pullbacks. Recently reported Sep '20 quarterly earnings +43% on +27% sales revenues versus the year ago period.
>>> FEATURED STOCK ARTICLE : Volume Totals Cooling While Hovering Near All-Time High - 12/3/2020 |
View all notes |
Set NEW NOTE alert |
Company Profile |
SEC
News |
Chart |
Request a new note
C
A
S
I |
QTWO
-
NYSE
Q2 Holdings Inc
Computer Sftwr-Financial
|
$128.99
|
+3.13
2.49% |
$129.40
|
306,766
73.39% of 50 DAV
50 DAV is 418,000
|
$126.12
2.28%
|
11/12/2020
|
$105.14
|
PP = $106.54
|
|
MB = $111.87
|
Most Recent Note - 12/22/2020 3:23:05 PM
G - Posting a 4th consecutive gain today hitting another new all-time high. Prior high in the $106 area and its 50 DMA line ($107.20) define important near term support to watch on pullbacks.
>>> FEATURED STOCK ARTICLE : Computer Software - Financial Firm Hovering Near Record High - 12/8/2020 |
View all notes |
Set NEW NOTE alert |
Company Profile |
SEC
News |
Chart |
Request a new note
C
A
S
I |
|
|
|
THESE ARE NOT BUY RECOMMENDATIONS!
Comments contained in the body of this report are technical
opinions only. The material herein has been obtained
from sources believed to be reliable and accurate, however,
its accuracy and completeness cannot be guaranteed.
This site is not an investment advisor, hence it does
not endorse or recommend any securities or other investments.
Any recommendation contained in this report may not
be suitable for all investors and it is not to be deemed
an offer or solicitation on our part with respect to
the purchase or sale of any securities. All trademarks,
service marks and trade names appearing in this report
are the property of their respective owners, and are
likewise used for identification purposes only.
This report is a service available
only to active Paid Premium Members.
You may opt-out of receiving report notifications
at any time. Questions or comments may be submitted
by writing to Premium Membership Services 665 S.E. 10 Street, Suite 201 Deerfield Beach, FL 33441-5634 or by calling 1-800-965-8307
or 954-785-1121.
|
|
|