You are not logged in.
This means you
CAN ONLY VIEW reports that were published prior to Tuesday, March 25, 2025.
You
MUST UPGRADE YOUR MEMBERSHIP if you want to see any current reports.
AFTER MARKET UPDATE - THURSDAY, JANUARY 14TH, 2021
Previous After Market Report Next After Market Report >>>
|
|
|
|
DOW |
-68.95 |
30,991.52 |
-0.22% |
|
Volume |
1,042,167,648 |
+10% |
|
Volume |
6,622,725,000 |
-6% |
|
NASDAQ |
-12.52 |
13,116.43 |
-0.10% |
|
Advancers |
2,186 |
69% |
|
Advancers |
2,702 |
71% |
|
S&P 500 |
-13.10 |
3,796.74 |
-0.34% |
|
Decliners |
962 |
31% |
|
Decliners |
1,082 |
29% |
|
Russell 2000 |
+43.38 |
2,155.35 |
+2.05% |
|
52 Wk Highs |
350 |
|
|
52 Wk Highs |
607 |
|
|
S&P 600 |
+27.54 |
1,232.70 |
+2.29% |
|
52 Wk Lows |
3 |
|
|
52 Wk Lows |
6 |
|
|
 |
Leadership Strong But Major Indices Reversed Early Gains
Kenneth J. Gruneisen - Passed the CAN SLIM® Master's Exam
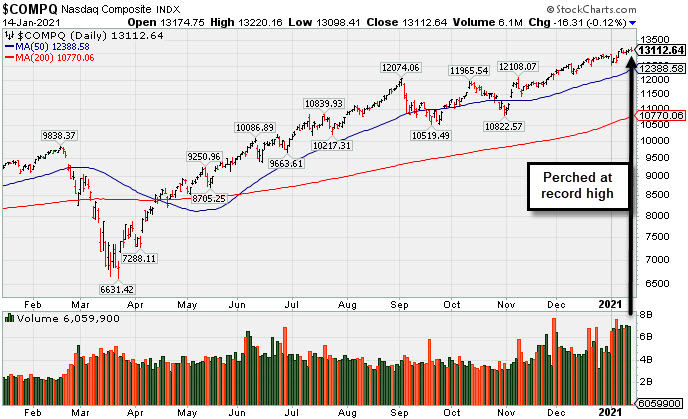
The Dow fell 68 points, retreating from a fresh record high reached near midday, while the S&P 500 slipped 0.4%. The Nasdaq Composite declined 0.1%. Small caps stocks outperformed, with the Russell 2000 jumping 2%. The volume totals were mixed, higher than the prior session on the NYSE and lighter the Nasdaq exchange. Breadth was positive as advancers led decliners by more than a 2-1 margin on the NYSE by a 13-5 margin on the Nasdaq exchange. Leadership improved as there were 142 high-ranked companies from the Leaders List that hit new 52-week highs and were listed on the BreakOuts Page, versus the total of 79 on the prior session. New 52-week highs totals expanded and easily outnumbered the new 52-week lows totals which were again in the single digits on both exchanges. The major indices are in a confirmed uptrend (M criteria). Investors are reminded to always make buying and selling decisions based based on the strict criteria and rules of the fact-based investment system. PICTURED: The Nasdaq Composite Index is perched near its record high.
The three U.S. major averages reversed early session gains on Thursday, ahead of a speech from President-elect Joe Biden at 7:15 pm ET. He plans to outline an economic plan, which is widely expected to include additional coronavirus relief aid of around $2 trillion.
Underscoring the need for additional fiscal stimulus was new initial jobless claims data, which showed 965,000 Americans filed for unemployment in the week ending January 9. The figure touched a five-month high and came in well above consensus estimates of 789,000. Elsewhere, Federal Reserve Chair Jerome Powell noted the U.S. central bank would not raise interest rates, unless policymakers saw worrying signs of inflation. Treasuries declined, with the yield on the 10-year note rising four basis points to 1.13%. In commodities, WTI crude rose 1.3% to $53.62/barrel to a fresh 10-month high. Gold lost 0.4% to $1846.90/ounce.
Seven of 11 S&P 500 sectors ended in negative territory, with Technology and Communication Services lagging. In corporate news, BlackRock (BLK -4.65%) fell despite topping Wall Street's estimates and revealing that assets under management surged to a record $8.68 trillion. Delta Airlines (DAL +2.52%) rose after its CEO signaled optimism for 2021 following a bigger-than-expected quarterly loss and its first annual loss in 11 years. Johnson and Johnson (JNJ +1.75%) after trial data showed its experimental single dose COVID-19 vaccine generated a long-lasting immunity response. |
 Kenneth J. Gruneisen started out as a licensed stockbroker in August 1987, a couple of months prior to the historic stock market crash that took the Dow Jones Industrial Average down -22.6% in a single day. He has published daily fact-based fundamental and technical analysis on high-ranked stocks online for two decades. Through FACTBASEDINVESTING.COM, Kenneth provides educational articles, news, market commentary, and other information regarding proven investment systems that work in good times and bad.
Comments contained in the body of this report are technical opinions only and are not necessarily those of Gruneisen Growth Corp. The material herein has been obtained from sources believed to be reliable and accurate, however, its accuracy and completeness cannot be guaranteed. Our firm, employees, and customers may effect transactions, including transactions contrary to any recommendation herein, or have positions in the securities mentioned herein or options with respect thereto. Any recommendation contained in this report may not be suitable for all investors and it is not to be deemed an offer or solicitation on our part with respect to the purchase or sale of any securities. |
|
 |
Financial, Tech, and Commodity-Linked Groups Rose
Kenneth J. Gruneisen - Passed the CAN SLIM® Master's Exam
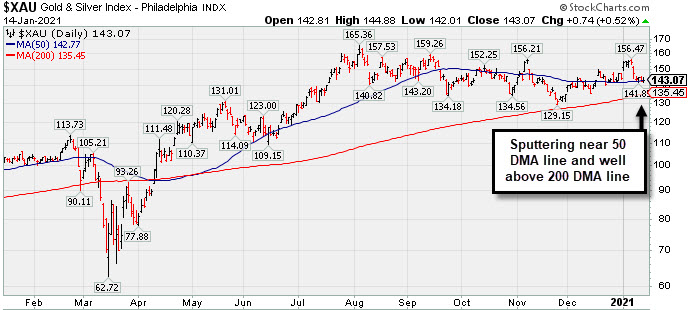
The Broker/Dealer Index ($XBD +1.15%) and Bank Index ($BKX +1.72%) posted influential gains while the Retail Index ($RLX -0.99%) created a slight drag on the major indices. The tech sector had a positive bias as the Semiconductor Index ($SOX +2.16%), Networking Index ($NWX +1.70%),and Biotech Index ($BTK +1.09%) posted unanimous gains. The Oil Services Index ($OSX +3.79%) and Integrated Oil Index ($XOI +2.71%) both posted solid gains and the Gold & Silver Index ($XAU +0.52%) edged higher.
.
PICTURED: The Gold & Silver Index ($XAU +0.52%) has been sputtering near its 50-day moving average (DMA) line and well above its 200 DMA line.
| Oil Services |
$OSX |
54.36 |
+1.99 |
+3.79% |
+22.64% |
| Integrated Oil |
$XOI |
918.63 |
+24.21 |
+2.71% |
+15.92% |
| Semiconductor |
$SOX |
3,056.56 |
+64.62 |
+2.16% |
+9.34% |
| Networking |
$NWX |
743.27 |
+12.45 |
+1.70% |
+3.65% |
| Broker/Dealer |
$XBD |
402.62 |
+4.57 |
+1.15% |
+6.63% |
| Retail |
$RLX |
3,544.58 |
-35.52 |
-0.99% |
-0.52% |
| Gold & Silver |
$XAU |
143.07 |
+0.74 |
+0.52% |
-0.78% |
| Bank |
$BKX |
110.42 |
+1.87 |
+1.72% |
+12.77% |
| Biotech |
$BTK |
6,016.85 |
+64.74 |
+1.09% |
+4.84% |
|
|
|
 |
Featured Stocks
Kenneth J. Gruneisen - Passed the CAN SLIM® Master's Exam
|
|
|
Color Codes Explained :
Y - Better candidates highlighted by our
staff of experts.
G - Previously featured
in past reports as yellow but may no longer be buyable under the
guidelines.
***Last / Change / Volume data in this table is the closing quote data***
Symbol/Exchange
Company Name
Industry Group |
PRICE |
CHANGE
(%Change) |
Day High |
Volume
(% DAV)
(% 50 day avg vol) |
52 Wk Hi
% From Hi |
Featured
Date |
Price
Featured |
Pivot Featured |
|
Max Buy |
 CRL
-
NYSE
CRL
-
NYSE
Charles River Labs Intl
DRUGS - Biotechnology
|
$266.91
|
-0.58
-0.22% |
$273.03
|
369,015
124.88% of 50 DAV
50 DAV is 295,500
|
$278.08
-4.02%
|
12/17/2020
|
$247.06
|
PP = $257.98
|
|
MB = $270.88
|
Most Recent Note - 1/12/2021 7:02:13 PM
Y - Pulled back today breaking a streak of 5 consecutive gains for new all-time highs. Recent gains above its pivot point backed by at least +40% above average volume helped clinch a proper new (or add-on) technical buy signal. Its 50 DMA line ($242.91) acted as support. Reported Sep '20 quarterly earnings +38% on +11% sales revenues versus the year ago period, above the +25% minimum earnings guideline (C criteria).
>>> FEATURED STOCK ARTICLE : Hovering in Tight Range Holding Ground Near High - 1/5/2021 |
View all notes |
Set NEW NOTE alert |
Company Profile |
SEC
News |
Chart |
Request a new note
C
A
S
I |
AMD
-
NYSE
Advanced Micro Devices
ELECTRONICS - Semiconductor - Broad Line
|
$90.79
|
-0.99
-1.08% |
$92.36
|
53,003,015
123.05% of 50 DAV
50 DAV is 43,074,400
|
$99.23
-8.51%
|
11/18/2020
|
$82.54
|
PP = $88.72
|
|
MB = $93.16
|
Most Recent Note - 1/13/2021 6:00:06 PM
Y - Color code is changed to yellow after pulling below its "max buy" level with today's 2nd consecutive volume-driven loss. Recently wedged to to a new all-time high with unimpressive volume behind gains. Its recent lows in the $89 area and its 50 DMA line ($89.28) coincide defining important near term support to watch. See the latest FSU analysis for more details and a new annotated graph.
>>> FEATURED STOCK ARTICLE : Distributional Pressure Brings Pullback Below "Max Buy" Level - 1/13/2021 |
View all notes |
Set NEW NOTE alert |
Company Profile |
SEC
News |
Chart |
Request a new note
C
A
S
I |
TER
-
NASDAQ
Teradyne Inc
ELECTRONICS - Semiconductor Equipment and Mate
|
$138.39
|
+2.37
1.74% |
$139.55
|
1,560,835
107.57% of 50 DAV
50 DAV is 1,451,000
|
$139.53
-0.82%
|
10/21/2020
|
$92.22
|
PP = $93.54
|
|
MB = $98.22
|
Most Recent Note - 1/11/2021 12:24:44 PM
G - Hitting yet another new all-time high with today's 5th consecutive gain, very extended from any sound base. Support to watch on pullbacks is its 50 DMA line ($111.55).
>>> FEATURED STOCK ARTICLE : Perched Near Record High Very Extended From Any Sound Base - 12/30/2020 |
View all notes |
Set NEW NOTE alert |
Company Profile |
SEC
News |
Chart |
Request a new note
C
A
S
I |
AMRC
-
NYSE
Ameresco Inc Cl A
ENERGY - Alternative
|
$57.98
|
-1.06
-1.80% |
$59.57
|
382,827
89.03% of 50 DAV
50 DAV is 430,000
|
$63.45
-8.62%
|
12/15/2020
|
$46.72
|
PP = $47.10
|
|
MB = $49.46
|
Most Recent Note - 1/11/2021 11:56:48 AM
G - Pulling back from its all-time high with today's loss after 4 consecutive volume-driven gains, getting very extended from any sound base. Its 50 DMA line ($46.45) and prior highs in the $46-47 area define important near-term support to watch on pullbacks.
>>> FEATURED STOCK ARTICLE : Very Extended From Base After Another Powerful Gain - 1/6/2021 |
View all notes |
Set NEW NOTE alert |
Company Profile |
SEC
News |
Chart |
Request a new note
C
A
S
I |
TREX
-
NYSE
Trex Company Inc
MATERIALS and CONSTRUCTION - General Building Materials
|
$91.98
|
-0.18
-0.20% |
$93.29
|
593,650
78.01% of 50 DAV
50 DAV is 761,000
|
$93.17
-1.28%
|
6/26/2020
|
$54.53
|
PP = $66.47
|
|
MB = $69.79
|
Most Recent Note - 1/12/2021 7:05:52 PM
G - Posted another gain today with light volume for a best ever close. Prior highs in the $80-81 area define initial support to watch above its 50 DMA line ($78.34). Recently noted that it reported Sep '20 quarterly earnings +14% on +19% sales revenues versus the year ago period, below the +25% minimum guideline (C criteria) raising fundamental concerns.
>>> FEATURED STOCK ARTICLE : Hit New High With Light Volume Behind 4th Consecutive Gain - 12/22/2020 |
View all notes |
Set NEW NOTE alert |
Company Profile |
SEC
News |
Chart |
Request a new note
C
A
S
I |
Symbol/Exchange
Company Name
Industry Group |
PRICE |
CHANGE
(%Change) |
Day High |
Volume
(% DAV)
(% 50 day avg vol) |
52 Wk Hi
% From Hi |
Featured
Date |
Price
Featured |
Pivot Featured |
|
Max Buy |
CLFD
-
NASDAQ
Clearfield Inc
TELECOMMUNICATIONS - Cables / Satalite Equipment
|
$27.86
|
+0.81
2.99% |
$28.22
|
133,674
132.35% of 50 DAV
50 DAV is 101,000
|
$28.32
-1.62%
|
11/17/2020
|
$22.06
|
PP = $26.07
|
|
MB = $27.37
|
 Most Recent Note - 1/14/2021 5:20:06 PM
G - Posted a solid volume-driven gain today for a best-ever close above its "max buy" level and its color code is changed to green. Recently found prompt support at its 50 DMA line ($24.55) and upward trendline when consolidating.
>>> FEATURED STOCK ARTICLE : Distributional Pressure While Testing Important Chart Support - 1/4/2021 |
View all notes |
Set NEW NOTE alert |
Company Profile |
SEC
News |
Chart |
Request a new note
C
A
S
I |
NOW
-
NYSE
Servicenow Inc
Computer Sftwr-Enterprse
|
$514.34
|
-7.37
-1.41% |
$528.00
|
1,443,488
107.26% of 50 DAV
50 DAV is 1,345,800
|
$566.74
-9.25%
|
8/20/2020
|
$453.34
|
PP = $454.79
|
|
MB = $477.53
|
Most Recent Note - 1/13/2021 6:03:32 PM
G - Today's big gain with lighter volume helped it rebound toward its 50 DMA line ($526) after recently slumping below that important short term average raising concerns. Recently reported Sep '20 quarterly earnings +22% on +30% sales revenues versus the year ago period, below the +25% minimum guideline (C criteria) of the fact-based investment system.
>>> FEATURED STOCK ARTICLE : Gain Today and Rebound Above 50-Day Moving Average Line - 1/8/2021 |
View all notes |
Set NEW NOTE alert |
Company Profile |
SEC
News |
Chart |
Request a new note
C
A
S
I |
SMPL
-
NASDAQ
Simply Good Foods Co
Food-Confectionery
|
$28.17
|
-0.53
-1.85% |
$29.03
|
664,833
48.58% of 50 DAV
50 DAV is 1,368,600
|
$32.03
-12.05%
|
12/28/2020
|
$30.40
|
PP = $31.44
|
|
MB = $33.01
|
Most Recent Note - 1/12/2021 7:08:12 PM
Y - Pulled back today for a 3rd consecutive loss on light volume. Quietly consolidating after a "negative reversal" on 1/04/21 at its all-time high. Subsequent gains above its pivot point backed by at least +40% above average volume may trigger a technical buy signal.
>>> FEATURED STOCK ARTICLE : Challenging All-Time High as it Joins Small Cap Index - 12/28/2020 |
View all notes |
Set NEW NOTE alert |
Company Profile |
SEC
News |
Chart |
Request a new note
C
A
S
I |
ALRM
-
NASDAQ
Alarm.com Holdings Inc
Security/Sfty
|
$99.79
|
-7.90
-7.34% |
$104.63
|
1,186,810
270.34% of 50 DAV
50 DAV is 439,000
|
$108.67
-8.17%
|
11/6/2020
|
$71.88
|
PP = $74.76
|
|
MB = $78.50
|
Most Recent Note - 1/14/2021 5:16:20 PM
G - Gapped down today and suffered a large loss with above average volume after announcing an offering of $350 million convertible senior notes. Very extended from any sound base. Its 50 DMA line ($84) and prior high ($74.66 on 7/23/20) define important near-term support to watch on pullbacks.
>>> FEATURED STOCK ARTICLE : Perched at High After Impressive Streak of Gains - 12/24/2020 |
View all notes |
Set NEW NOTE alert |
Company Profile |
SEC
News |
Chart |
Request a new note
C
A
S
I |
TEAM
-
NASDAQ
Atlassian Corp Plc
Comp Sftwr-Spec Enterprs
|
$222.97
|
-6.90
-3.00% |
$230.82
|
1,571,731
96.43% of 50 DAV
50 DAV is 1,630,000
|
$250.03
-10.82%
|
10/12/2020
|
$193.77
|
PP = $199.60
|
|
MB = $209.58
|
Most Recent Note - 1/11/2021 5:52:39 PM
G - Consolidating above its 50 DMA line ($218.81) and prior high in the $216 area which define important near-term support to watch. Its current Relative Strength Rating is 75, below the +80 minimum guideline for buy candidates. Earnings rose +7% on +26% sales revenues for the Sep '20 quarter versus the year ago period, below the +25% minimum earnings guideline (C criteria), raising concerns. See the latest FSU analysis for more details and a new annotated graph.
>>> FEATURED STOCK ARTICLE : Relative Strength Rating Remains Below 80+ Minimum Guideline - 1/11/2021 |
View all notes |
Set NEW NOTE alert |
Company Profile |
SEC
News |
Chart |
Request a new note
C
A
S
I |
Symbol/Exchange
Company Name
Industry Group |
PRICE |
CHANGE
(%Change) |
Day High |
Volume
(% DAV)
(% 50 day avg vol) |
52 Wk Hi
% From Hi |
Featured
Date |
Price
Featured |
Pivot Featured |
|
Max Buy |
SHOP
-
NYSE
Shopify Inc Cl A
Computer Sftwr-Enterprse
|
$1,178.86
|
-20.96
-1.75% |
$1,230.10
|
1,173,445
81.66% of 50 DAV
50 DAV is 1,437,000
|
$1,285.19
-8.27%
|
12/16/2020
|
$1,146.00
|
PP = $1,147.01
|
|
MB = $1,204.36
|
Most Recent Note - 1/12/2021 7:04:32 PM
Y - Volume totals have been cooling while consolidating. Found prompt support near prior highs in the $1,146-1,130 area and above its 50 DMA line ($1,060) which defines the next important support to watch.
>>> FEATURED STOCK ARTICLE : Rebounded After Undercutting Prior Highs - 1/7/2021 |
View all notes |
Set NEW NOTE alert |
Company Profile |
SEC
News |
Chart |
Request a new note
C
A
S
I |
YETI
-
NYSE
Yeti Holdings Inc
Leisure-Products
|
$77.50
|
-0.34
-0.44% |
$80.89
|
810,267
68.61% of 50 DAV
50 DAV is 1,181,000
|
$79.86
-2.96%
|
11/5/2020
|
$57.25
|
PP = $55.14
|
|
MB = $57.90
|
Most Recent Note - 1/12/2021 7:07:05 PM
G - Hit yet another new all-time high with today's 8th consecutive gain, getting more extended from any sound base. Its 50 DMA line ($64.67) defines initial support to watch on pullbacks.
>>> FEATURED STOCK ARTICLE : Pulling Back After Recently Wedging to New Highs - 12/29/2020 |
View all notes |
Set NEW NOTE alert |
Company Profile |
SEC
News |
Chart |
Request a new note
C
A
S
I |
DOCU
-
NASDAQ
Docusign Inc
Computer Sftwr-Enterprse
|
$250.25
|
-5.60
-2.19% |
$258.27
|
2,694,153
68.21% of 50 DAV
50 DAV is 3,950,000
|
$290.23
-13.78%
|
1/12/2021
|
$253.50
|
PP = $256.10
|
|
MB = $268.91
|
Most Recent Note - 1/13/2021 6:01:35 PM
Y - Pulled back today with lighter (near average) volume. Finished strong on the prior session after highlighted in yellow with pivot point cited based on its 12/04/20 high plus 10 cents. The big gain and strong close above the pivot point backed by twice average volume clinched a technical buy signal. Recently found support near its 50 DMA line. Fundamentals remain strong. See the latest FSU analysis for more details and an annotated graph.
>>> FEATURED STOCK ARTICLE : Twice Average Volume Behind Breakout Gain - 1/12/2021 |
View all notes |
Set NEW NOTE alert |
Company Profile |
SEC
News |
Chart |
Request a new note
C
A
S
I |
AAXN
-
NASDAQ
Axon Enterprise Inc
Security/Sfty
|
$149.64
|
+4.38
3.02% |
$152.00
|
811,263
142.58% of 50 DAV
50 DAV is 569,000
|
$146.06
2.45%
|
12/22/2020
|
$127.84
|
PP = $130.51
|
|
MB = $137.04
|
Most Recent Note - 1/14/2021 5:10:51 PM
G - Rallied for new all-time highs well above its "max buy" level with today's 3rd consecutive big gain. Rallied from support at its 50 DMA line ($124). Fundamentals remain strong.
>>> FEATURED STOCK ARTICLE : New All-Time High With Today's 5th Consecutive Gain - 12/23/2020 |
View all notes |
Set NEW NOTE alert |
Company Profile |
SEC
News |
Chart |
Request a new note
C
A
S
I |
QTWO
-
NYSE
Q2 Holdings Inc
Computer Sftwr-Financial
|
$130.15
|
+2.14
1.67% |
$130.96
|
332,330
72.09% of 50 DAV
50 DAV is 461,000
|
$130.59
-0.34%
|
11/12/2020
|
$105.14
|
PP = $106.54
|
|
MB = $111.87
|
Most Recent Note - 1/13/2021 6:04:25 PM
G - Posted a 4th consecutive gain today on light volume while challenging its all-time high. Its 50 DMA line ($115.91) defines important near term support to watch above the prior high in the $106 area.
>>> FEATURED STOCK ARTICLE : Stubbornly Holding Ground Extended From Prior Base - 12/31/2020 |
View all notes |
Set NEW NOTE alert |
Company Profile |
SEC
News |
Chart |
Request a new note
C
A
S
I |
Symbol/Exchange
Company Name
Industry Group |
PRICE |
CHANGE
(%Change) |
Day High |
Volume
(% DAV)
(% 50 day avg vol) |
52 Wk Hi
% From Hi |
Featured
Date |
Price
Featured |
Pivot Featured |
|
Max Buy |
|
|
|
THESE ARE NOT BUY RECOMMENDATIONS!
Comments contained in the body of this report are technical
opinions only. The material herein has been obtained
from sources believed to be reliable and accurate, however,
its accuracy and completeness cannot be guaranteed.
This site is not an investment advisor, hence it does
not endorse or recommend any securities or other investments.
Any recommendation contained in this report may not
be suitable for all investors and it is not to be deemed
an offer or solicitation on our part with respect to
the purchase or sale of any securities. All trademarks,
service marks and trade names appearing in this report
are the property of their respective owners, and are
likewise used for identification purposes only.
This report is a service available
only to active Paid Premium Members.
You may opt-out of receiving report notifications
at any time. Questions or comments may be submitted
by writing to Premium Membership Services 665 S.E. 10 Street, Suite 201 Deerfield Beach, FL 33441-5634 or by calling 1-800-965-8307
or 954-785-1121.
|
|
|