You are not logged in.
This means you
CAN ONLY VIEW reports that were published prior to Sunday, February 9, 2025.
You
MUST UPGRADE YOUR MEMBERSHIP if you want to see any current reports.
AFTER MARKET UPDATE - MONDAY, DECEMBER 28TH, 2020
Previous After Market Report Next After Market Report >>>
|
|
|
|
DOW |
+204.10 |
30,403.97 |
+0.68% |
|
Volume |
734,405,838 |
+93% |
|
Volume |
5,028,448,300 |
+55% |
|
NASDAQ |
+94.69 |
12,899.42 |
+0.74% |
|
Advancers |
1,656 |
53% |
|
Advancers |
1,956 |
52% |
|
S&P 500 |
+32.30 |
3,735.36 |
+0.87% |
|
Decliners |
1,495 |
47% |
|
Decliners |
1,802 |
48% |
|
Russell 2000 |
-7.70 |
1,996.25 |
-0.38% |
|
52 Wk Highs |
300 |
|
|
52 Wk Highs |
448 |
|
|
S&P 600 |
+3.43 |
1,124.94 |
+0.31% |
|
52 Wk Lows |
6 |
|
|
52 Wk Lows |
20 |
|
|
 |
New Highs Totals Expanded as Major Indices Rose
Kenneth J. Gruneisen - Passed the CAN SLIM® Master's Exam
The Dow jumped 204 points, while the S&P 500 advanced 0.9%. The Nasdaq Composite gained 0.7%. Monday's volume totals were higher than the prior shortened-session volume totals on the NYSE and on the Nasdaq exchange. Advancers led decliners by a narrow margin on the NYSE and on the Nasdaq exchange. There were 67 high-ranked companies from the Leaders List that hit new 52-week highs and were listed on the BreakOuts Page, more than doubling the total of 33 on the prior session. New 52-week highs totals expanded and solidly outnumbered the new 52-week lows totals on both exchanges. The major indices are in a confirmed uptrend (M criteria). Investors are reminded to always make buying and selling decisions based based on the strict criteria and rules of the fact-based investment system. 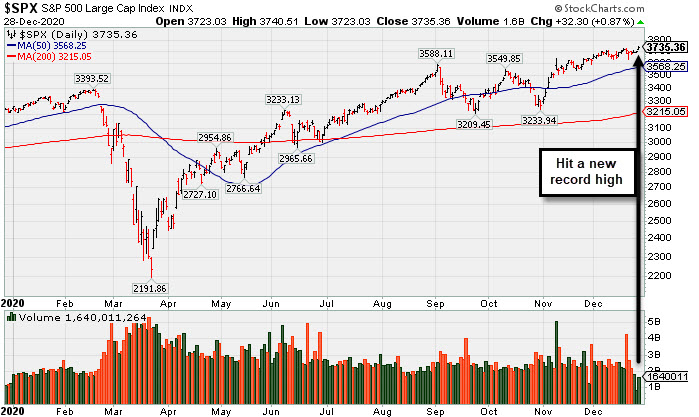 PICTURED: The S&P 500 Index is perched at its record high.
The U.S. major averages rallied to record highs on Monday, as investors assessed news that President Trump signed a bipartisan spending bill passed by Congress last week. The passage of the bill averted a government shutdown, extended several measures for coronavirus relief, and included another round of direct payments to most Americans.
Nine of 11 S&P 500 sectors finished in positive territory, with the Materials and Energy groups bucking the uptrend. Tech and Internet related companies led the gains, with the oft-cited FAANG group rising nearly 3%. Retailers also outperformed, after MasterCard (MA +2.52%) said its data showed a 3% year-over-year uptick in U.S. holiday sales. In other corporate news, AstraZeneca (AZN +1.77%) rose after reports suggested U.K. regulators could approve the company's COVID-19 vaccine sometime this week.
On the data front, the lone update showed a gauge of manufacturing activity in the Dallas Fed region declined to 9.7 in December from the prior month's 12 reading. Later this week, the weekly initial jobless claims reading on New Year's Eve will be closely monitored to see if the number of Americans filing for unemployment benefits continued to decline. Treasuries were mixed, with the yield on the benchmark 10-year note down one basis point to 0.92%. In commodities, WTI crude slipped 1.2% to $47.67/barrel, while gold slipped 0.1% to $1878.00/ounce. |
 Kenneth J. Gruneisen started out as a licensed stockbroker in August 1987, a couple of months prior to the historic stock market crash that took the Dow Jones Industrial Average down -22.6% in a single day. He has published daily fact-based fundamental and technical analysis on high-ranked stocks online for two decades. Through FACTBASEDINVESTING.COM, Kenneth provides educational articles, news, market commentary, and other information regarding proven investment systems that work in good times and bad.
Comments contained in the body of this report are technical opinions only and are not necessarily those of Gruneisen Growth Corp. The material herein has been obtained from sources believed to be reliable and accurate, however, its accuracy and completeness cannot be guaranteed. Our firm, employees, and customers may effect transactions, including transactions contrary to any recommendation herein, or have positions in the securities mentioned herein or options with respect thereto. Any recommendation contained in this report may not be suitable for all investors and it is not to be deemed an offer or solicitation on our part with respect to the purchase or sale of any securities. |
|
 |
Retail, Networking, and Financial Indexes Rose
Kenneth J. Gruneisen - Passed the CAN SLIM® Master's Exam
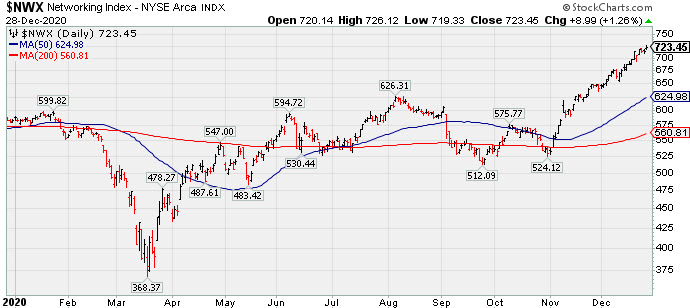
The Retail Index ($RLX +2.01%) posted a big gain that was a positive influence on the major indices while the Bank Index ($BKX +0.53%) and Broker/Dealer Index ($XBD +0.24%) both edged higher. The tech sector was mixed as the Networking Index ($NWX +1.26%) rose while the Biotech Index ($BTK -1.20%) fell and the Semiconductor Index ($SOX -0.22%) also edged lower. Commodity-linked groups had a negative bias as the Gold & Silver Index ($XAU -0.97%), Oil Services Index ($OSX -0.90%), and the Integrated Oil Index ($XOI -0.46%) fell.
PICTURED: The Networking Index ($NWX +1.26%) is consolidating near its all-time high. It rallied impressively from the March low.
| Oil Services |
$OSX |
43.75 |
-0.40 |
-0.90% |
-44.12% |
| Integrated Oil |
$XOI |
790.76 |
-3.64 |
-0.46% |
-37.76% |
| Semiconductor |
$SOX |
2,744.30 |
-5.94 |
-0.22% |
+48.37% |
| Networking |
$NWX |
723.45 |
+8.99 |
+1.26% |
+24.00% |
| Broker/Dealer |
$XBD |
377.90 |
+0.90 |
+0.24% |
+30.14% |
| Retail |
$RLX |
3,582.21 |
+70.70 |
+2.01% |
+46.26% |
| Gold & Silver |
$XAU |
142.34 |
-1.39 |
-0.97% |
+33.12% |
| Bank |
$BKX |
96.91 |
+0.51 |
+0.53% |
-14.51% |
| Biotech |
$BTK |
5,864.65 |
-71.53 |
-1.20% |
+15.73% |
|
|
|
 |
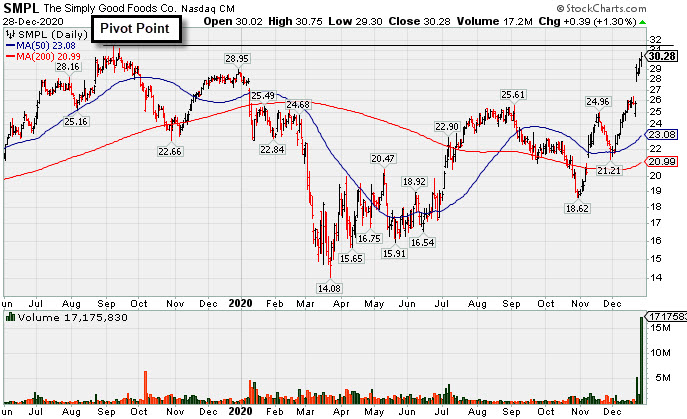
Challenging All-Time High as it Joins Small Cap Index
Kenneth J. Gruneisen - Passed the CAN SLIM® Master's Exam
Simply Good Foods Co (SMPL +$0.39 or +1.30% to $30.28) was highlighted in yellow with pivot point cited based on its 9/09/19 high plus 10 cents in the earlier mid-day report (read here). Today's 5th consecutive gain was backed by about 15 times average volume.
subsequent gains above its pivot point backed by at least +40% above average volume are needed to trigger a proper technical buy signal. The recent streak of gains has it trading near its all-time high after a deep consolidation since noted with caution in the 10/08/19 mid-day report. It gapped up last week and rallied further on news it was added to the S&P 600 Small Cap Index.
Keep in mind it is due to report Nov '20 quarterly results on 1/06/21. Volume and volatility often increase near earnings news. Earnings rose +33% on +60% sales revenues for the Aug '20 quarter versus the year ago period, its 3rd consecutive quarterly comparison above the +25% minimum earnings guideline (C criteria). Annual earnings history (A criteria) has been strong.
SMPL completed a new Pubic Offering on 10/09/19. The company has a Timeliness Rating of B and Sponsorship Rating of C. The number of top-rated funds owning its shares fell from 442 in Dec '19 to 357 in Sep '20, however, its current Up/Down Volume Ratio of 2.1 is an unbiased indication its shares have been under accumulation over the past 50 days. Some leadership has been provided by other companies in the Food/Beverage Sector, however, the Food-Confectionery industry group has a Group Relative Strength Rating of 10 (D-) which is a concern regarding the L criteria. There are only 5 companies listed in the group.
|
|
|
Color Codes Explained :
Y - Better candidates highlighted by our
staff of experts.
G - Previously featured
in past reports as yellow but may no longer be buyable under the
guidelines.
***Last / Change / Volume data in this table is the closing quote data***
Symbol/Exchange
Company Name
Industry Group |
PRICE |
CHANGE
(%Change) |
Day High |
Volume
(% DAV)
(% 50 day avg vol) |
52 Wk Hi
% From Hi |
Featured
Date |
Price
Featured |
Pivot Featured |
|
Max Buy |
 CRL
-
NYSE
CRL
-
NYSE
Charles River Labs Intl
DRUGS - Biotechnology
|
$247.17
|
-4.54
-1.80% |
$254.94
|
248,998
78.30% of 50 DAV
50 DAV is 318,000
|
$257.88
-4.15%
|
12/17/2020
|
$247.06
|
PP = $257.98
|
|
MB = $270.88
|
Most Recent Note - 12/22/2020 5:14:13 PM
Y - Posted a 4th consecutive gain today with light volume for a best ever close. Color code was changed to yellow with new pivot point cited based on its 11/09/20 high plus 10 cents. Subsequent gains above its pivot point backed by at least +40% above average volume may trigger a new (or add-on) technical buy signal. Its 50 DMA line ($237) has been acting as support. Reported Sep '20 quarterly earnings +38% on +11% sales revenues versus the year ago period, above the +25% minimum earnings guideline (C criteria).
>>> FEATURED STOCK ARTICLE : CRL Consolidating Above 50-Day Moving Average Line - 12/14/2020 |
View all notes |
Set NEW NOTE alert |
Company Profile |
SEC
News |
Chart |
Request a new note
C
A
S
I |
AMD
-
NASDAQ
Advanced Micro Devices
ELECTRONICS - Semiconductor - Broad Line
|
$91.60
|
-0.21
-0.23% |
$93.14
|
30,490,694
65.98% of 50 DAV
50 DAV is 46,215,000
|
$97.98
-6.51%
|
11/18/2020
|
$82.54
|
PP = $88.72
|
|
MB = $93.16
|
 Most Recent Note - 12/28/2020 5:32:20 PM
Y - Color code is changed to yellow after recently pulling back below its "max buy" level. Its 50 DMA line ($86.36) defines important near term support to watch on pullbacks.
>>> FEATURED STOCK ARTICLE : Pulling Back From its Record High Hit Last Week - 12/21/2020 |
View all notes |
Set NEW NOTE alert |
Company Profile |
SEC
News |
Chart |
Request a new note
C
A
S
I |
TER
-
NASDAQ
Teradyne Inc
ELECTRONICS - Semiconductor Equipment and Mate
|
$117.73
|
-1.15
-0.97% |
$120.22
|
733,565
47.54% of 50 DAV
50 DAV is 1,543,000
|
$122.37
-3.79%
|
10/21/2020
|
$92.22
|
PP = $93.54
|
|
MB = $98.22
|
Most Recent Note - 12/28/2020 5:24:33 PM
G - Still perched near its all-time high, stubbornly holding its ground with volume totals cooling. Support to watch on pullbacks is its 50 DMA line ($105).
>>> FEATURED STOCK ARTICLE : Stubbornly Holding Ground and Rising for a New High - 12/7/2020 |
View all notes |
Set NEW NOTE alert |
Company Profile |
SEC
News |
Chart |
Request a new note
C
A
S
I |
AMRC
-
NYSE
Ameresco Inc Cl A
ENERGY - Alternative
|
$51.57
|
+2.18
4.41% |
$52.30
|
414,365
109.04% of 50 DAV
50 DAV is 380,000
|
$54.79
-5.88%
|
12/15/2020
|
$46.72
|
PP = $47.10
|
|
MB = $49.46
|
Most Recent Note - 12/24/2020 11:14:45 AM
G - Slumping near its "max buy" level today after a "negative reversal" on the prior session at its all-time high. Prior highs in the $46-47 area define initial support to watch on pullbacks.
>>> FEATURED STOCK ARTICLE : Gain From Ascending Base Pattern Backed by Above Average Volume - 12/15/2020 |
View all notes |
Set NEW NOTE alert |
Company Profile |
SEC
News |
Chart |
Request a new note
C
A
S
I |
TREX
-
NYSE
Trex Company Inc
MATERIALS and CONSTRUCTION - General Building Materials
|
$83.56
|
-2.73
-3.16% |
$87.88
|
566,757
74.18% of 50 DAV
50 DAV is 764,000
|
$86.75
-3.68%
|
6/26/2020
|
$54.53
|
PP = $66.47
|
|
MB = $69.79
|
Most Recent Note - 12/28/2020 5:25:53 PM
G - There was a "negative reversal" today after hitting yet another new 52-week high. Its 50 DMA line ($76) defines near-term support. Recently noted that it reported Sep '20 quarterly earnings +14% on +19% sales revenues versus the year ago period, below the +25% minimum guideline (C criteria) raising fundamental concerns.
>>> FEATURED STOCK ARTICLE : Hit New High With Light Volume Behind 4th Consecutive Gain - 12/22/2020 |
View all notes |
Set NEW NOTE alert |
Company Profile |
SEC
News |
Chart |
Request a new note
C
A
S
I |
Symbol/Exchange
Company Name
Industry Group |
PRICE |
CHANGE
(%Change) |
Day High |
Volume
(% DAV)
(% 50 day avg vol) |
52 Wk Hi
% From Hi |
Featured
Date |
Price
Featured |
Pivot Featured |
|
Max Buy |
CLFD
-
NASDAQ
Clearfield Inc
TELECOMMUNICATIONS - Cables / Satalite Equipment
|
$25.54
|
+0.74
2.98% |
$25.87
|
45,388
44.94% of 50 DAV
50 DAV is 101,000
|
$28.32
-9.82%
|
11/17/2020
|
$22.06
|
PP = $26.07
|
|
MB = $27.37
|
Most Recent Note - 12/22/2020 5:12:49 PM
Y - Sputtering below the pivot point after churning higher volume last week without making meaningful price progress. Near term support is defined by its 50 DMA line ($23.36) and an upward trendline.
>>> FEATURED STOCK ARTICLE : Perched Near Pivot Point in Need of Confirming Gain on Volume - 12/10/2020 |
View all notes |
Set NEW NOTE alert |
Company Profile |
SEC
News |
Chart |
Request a new note
C
A
S
I |
NOW
-
NYSE
Servicenow Inc
Computer Sftwr-Enterprse
|
$543.74
|
-10.15
-1.83% |
$563.00
|
1,039,804
77.37% of 50 DAV
50 DAV is 1,344,000
|
$566.74
-4.06%
|
8/20/2020
|
$453.34
|
PP = $454.79
|
|
MB = $477.53
|
Most Recent Note - 12/22/2020 5:10:29 PM
G - Posted a gain today with light volume for its second best ever close. Found prompt support near its 50 DMA line and stubbornly held its ground in recent weeks. Recently reported Sep '20 quarterly earnings +22% on +30% sales revenues versus the year ago period, below the +25% minimum guideline (C criteria) of the fact-based investment system.
>>> FEATURED STOCK ARTICLE : Hit New Record High With Light Volume Behind Gain - 12/17/2020 |
View all notes |
Set NEW NOTE alert |
Company Profile |
SEC
News |
Chart |
Request a new note
C
A
S
I |
SMPL
-
NASDAQ
Simply Good Foods Co
Food-Confectionery
|
$30.28
|
+0.39
1.30% |
$30.75
|
17,175,830
1,683.90% of 50 DAV
50 DAV is 1,020,000
|
$30.09
0.63%
|
12/28/2020
|
$30.40
|
PP = $31.44
|
|
MB = $33.01
|
Most Recent Note - 12/28/2020 5:23:24 PM
Y - Color code was changed to yellow with pivot point cited based on its 9/09/19 high plus 10 cents. Subsequent gains above its pivot point backed by at least +40% above average volume may trigger a technical buy signal. Gapped up last week and rallied further on news it was added to the S&P 600 Small Cap Index. Completed a new Pubic Offering on 10/09/19. Reported earnings +33% on +60% sales revenues for the Aug '20 quarter versus the year ago period, its 3rd consecutive quarterly comparison above the +25% minimum earnings guideline (C criteria). Annual earnings history (A criteria) has been strong. See the latest FSU analysis for more details and a new annotated graph.
>>> FEATURED STOCK ARTICLE : Challenging All-Time High as it Joins Small Cap Index - 12/28/2020 |
View all notes |
Set NEW NOTE alert |
Company Profile |
SEC
News |
Chart |
Request a new note
C
A
S
I |
ALRM
-
NASDAQ
Alarm.com Holdings Inc
Security/Sfty
|
$103.23
|
+4.35
4.40% |
$103.52
|
438,417
110.43% of 50 DAV
50 DAV is 397,000
|
$102.94
0.28%
|
11/6/2020
|
$71.88
|
PP = $74.76
|
|
MB = $78.50
|
Most Recent Note - 12/28/2020 5:30:17 PM
G - Hit yet another new all-time high with today's gain backed by average volume, getting very extended from any sound base. Prior high ($74.66 on 7/23/20) defines initial support to watch above its 50 DMA line ($73.62).
>>> FEATURED STOCK ARTICLE : Perched at High After Impressive Streak of Gains - 12/24/2020 |
View all notes |
Set NEW NOTE alert |
Company Profile |
SEC
News |
Chart |
Request a new note
C
A
S
I |
TEAM
-
NASDAQ
Atlassian Corp Plc Cl A
Comp Sftwr-Spec Enterprs
|
$231.80
|
-9.99
-4.13% |
$246.62
|
1,269,049
64.48% of 50 DAV
50 DAV is 1,968,000
|
$250.03
-7.29%
|
10/12/2020
|
$193.77
|
PP = $199.60
|
|
MB = $209.58
|
Most Recent Note - 12/22/2020 5:15:48 PM
G - Volume totals cooled while stubbornly holding its ground perched at its 52-week high. Showed resilience and strength after earnings rose +7% on +26% sales revenues for the Sep '20 quarter versus the year ago period, below the +25% minimum earnings guideline (C criteria), raising concerns.
>>> FEATURED STOCK ARTICLE : Extended From Any Base After Streak of Gains for New Highs - 12/18/2020 |
View all notes |
Set NEW NOTE alert |
Company Profile |
SEC
News |
Chart |
Request a new note
C
A
S
I |
Symbol/Exchange
Company Name
Industry Group |
PRICE |
CHANGE
(%Change) |
Day High |
Volume
(% DAV)
(% 50 day avg vol) |
52 Wk Hi
% From Hi |
Featured
Date |
Price
Featured |
Pivot Featured |
|
Max Buy |
SHOP
-
NYSE
Shopify Inc Cl A
Computer Sftwr-Enterprse
|
$1,147.06
|
-78.46
-6.40% |
$1,231.54
|
1,860,753
123.07% of 50 DAV
50 DAV is 1,512,000
|
$1,285.19
-10.75%
|
12/16/2020
|
$1,146.00
|
PP = $1,147.01
|
|
MB = $1,204.36
|
Most Recent Note - 12/28/2020 12:41:22 PM
Y - Color code is changed to yellow after slumping below its "max buy" level with today's pullback. After spiking to new all-time highs with volume-driven gains, the prior highs in the $1,146-1,130 area define initial support to watch above its 50 DMA line ($1,039).. Reported Sep '20 quarterly earnings of $1.13 per share versus a loss of 29 cents per share on +96% sales revenues versus the year ago period. The Ontario, Canada-based Computer Software - Enterprise firm's prior quarters showed big earnings and sales revenues growth. After years of losses it had strong earnings growth in FY '17-19 (A criteria).
>>> FEATURED STOCK ARTICLE : Volume-Driven Gain for New High After Long Consolidation - 12/16/2020 |
View all notes |
Set NEW NOTE alert |
Company Profile |
SEC
News |
Chart |
Request a new note
C
A
S
I |
YETI
-
NYSE
Yeti Holdings Inc
Leisure-Products
|
$69.82
|
-3.27
-4.47% |
$73.88
|
707,223
58.84% of 50 DAV
50 DAV is 1,202,000
|
$74.82
-6.68%
|
11/5/2020
|
$57.25
|
PP = $55.14
|
|
MB = $57.90
|
Most Recent Note - 12/28/2020 5:26:50 PM
G - Slumped for a big loss today after quietly wedging to new all-time highs with recent gains lacking great volume conviction. Its 50 DMA line ($60.70) defines initial support to watch above prior highs in the $55-54 area.
>>> FEATURED STOCK ARTICLE : Volume Totals Cooloing While Stubbornly Holding Ground at High - 12/2/2020 |
View all notes |
Set NEW NOTE alert |
Company Profile |
SEC
News |
Chart |
Request a new note
C
A
S
I |
AAXN
-
NASDAQ
Axon Enterprise Inc
Security/Sfty
|
$125.16
|
-5.59
-4.28% |
$133.49
|
336,392
60.72% of 50 DAV
50 DAV is 554,000
|
$134.73
-7.10%
|
12/22/2020
|
$127.84
|
PP = $130.51
|
|
MB = $137.04
|
Most Recent Note - 12/28/2020 5:28:41 PM
Y - Slumped for a big loss today with below average volume. Color code was changed to yellow after a 4-week square box base pattern as it was noted - "A solid gain and close above the pivot point backed by at least +40% above average volume may trigger a new (or add-on) technical buy signal. Its 50 DMA line ($116.42) defines near term support to watch on pullbacks. Recently reported Sep '20 quarterly earnings +43% on +27% sales revenues versus the year ago period."
>>> FEATURED STOCK ARTICLE : New All-Time High With Today's 5th Consecutive Gain - 12/23/2020 |
View all notes |
Set NEW NOTE alert |
Company Profile |
SEC
News |
Chart |
Request a new note
C
A
S
I |
QTWO
-
NYSE
Q2 Holdings Inc
Computer Sftwr-Financial
|
$126.93
|
-1.20
-0.94% |
$130.43
|
694,104
165.66% of 50 DAV
50 DAV is 419,000
|
$130.59
-2.80%
|
11/12/2020
|
$105.14
|
PP = $106.54
|
|
MB = $111.87
|
Most Recent Note - 12/22/2020 3:23:05 PM
G - Posting a 4th consecutive gain today hitting another new all-time high. Prior high in the $106 area and its 50 DMA line ($107.20) define important near term support to watch on pullbacks.
>>> FEATURED STOCK ARTICLE : Computer Software - Financial Firm Hovering Near Record High - 12/8/2020 |
View all notes |
Set NEW NOTE alert |
Company Profile |
SEC
News |
Chart |
Request a new note
C
A
S
I |
|
|
|
THESE ARE NOT BUY RECOMMENDATIONS!
Comments contained in the body of this report are technical
opinions only. The material herein has been obtained
from sources believed to be reliable and accurate, however,
its accuracy and completeness cannot be guaranteed.
This site is not an investment advisor, hence it does
not endorse or recommend any securities or other investments.
Any recommendation contained in this report may not
be suitable for all investors and it is not to be deemed
an offer or solicitation on our part with respect to
the purchase or sale of any securities. All trademarks,
service marks and trade names appearing in this report
are the property of their respective owners, and are
likewise used for identification purposes only.
This report is a service available
only to active Paid Premium Members.
You may opt-out of receiving report notifications
at any time. Questions or comments may be submitted
by writing to Premium Membership Services 665 S.E. 10 Street, Suite 201 Deerfield Beach, FL 33441-5634 or by calling 1-800-965-8307
or 954-785-1121.
|
|
|