You are not logged in.
This means you
CAN ONLY VIEW reports that were published prior to Tuesday, March 25, 2025.
You
MUST UPGRADE YOUR MEMBERSHIP if you want to see any current reports.
AFTER MARKET UPDATE - MONDAY, DECEMBER 7TH, 2020
Previous After Market Report Next After Market Report >>>
|
|
|
|
DOW |
-148.47 |
30,069.79 |
-0.49% |
|
Volume |
926,481,834 |
-5% |
|
Volume |
4,750,589,700 |
-5% |
|
NASDAQ |
+55.71 |
12,519.95 |
+0.45% |
|
Advancers |
1,333 |
43% |
|
Advancers |
1,722 |
48% |
|
S&P 500 |
-7.16 |
3,691.96 |
-0.19% |
|
Decliners |
1,771 |
57% |
|
Decliners |
1,884 |
52% |
|
Russell 2000 |
-1.20 |
1,891.25 |
-0.06% |
|
52 Wk Highs |
286 |
|
|
52 Wk Highs |
436 |
|
|
S&P 600 |
-4.40 |
1,081.04 |
-0.41% |
|
52 Wk Lows |
2 |
|
|
52 Wk Lows |
10 |
|
|
 |
Major Indices Were Mixed as Nasdaq Outpaced Peers
Kenneth J. Gruneisen - Passed the CAN SLIM® Master's Exam
The Dow fell 148 points, while the S&P 500 declined 0.2%. Meanwhile, the Nasdaq Composite rose 0.5% to a fresh all-time high. The large-cap Nasdaq 100 climbed for a ninth consecutive day, its longest such stretch in nearly a year. The volume totals on Monday were lighter than the prior session on the NYSE and on the Nasdaq exchange. Breadth was slightly negative as decliners led advancers by a 3-2 margin on the NYSE and by a narrow margin on the Nasdaq exchange. There were 84 high-ranked companies from the Leaders List that hit new 52-week highs and were listed on the BreakOuts Page, versus the total of 86 on the prior session. New 52-week highs totals expanded and solidly outnumbered new 52-week lows totals on both exchanges. The major indices confirmed a new uptrend (M criteria) with recent follow-through gains backed by higher volume and more leadership. Investors are reminded to always make buying and selling decisions based based on the strict criteria and rules of the fact-based investment system. 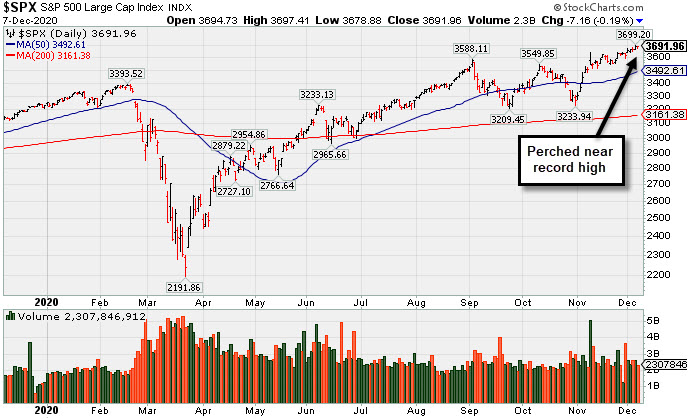 PICTURED: The S&P 500 Index is perched near its record high after a recent spurt of gains.
Stocks ended mixed on Monday as investors continued to weigh rising COVID infections against vaccine optimism. Coronavirus cases in the U.S. remained elevated around 200,000, while daily deaths and hospitalizations each stayed near record levels. The worsening trends prompted California to impose new restrictions, and elevated concerns that lockdown measures could become more widespread.
Market participants also awaited fiscal stimulus updates from Washington. Despite no incremental news, investors held onto hope that additional aid from the U.S. government could come before year-end. On the data front, the lone report showed consumer credit grew by just $7.2 billion in October after rising a downwardly revised $15 billion in September. Treasuries advanced, with the yield on the benchmark 10-year note down four basis points to 0.93%. In commodities, gold added 1.5% to $1862.70/ounce.
Eight of 11 S&P 500 sectors finished in negative territory, with the Communication Services, Utilities, and Information Technology groups the only advancers. The Energy group lagged, with WTI crude declining 1.2% to $45.70/barrel. In corporate news, Intel (INTC -3.43%) fell following news that Apple (AAPL +1.23%) plans to roll out proprietary chips aimed at outperforming Intel's fastest processors on its Mac laptops as early as next year. Boeing (BA +2.35%) bucked the downtrend, rising after the jet maker was the subject of an analyst upgrade. |
 Kenneth J. Gruneisen started out as a licensed stockbroker in August 1987, a couple of months prior to the historic stock market crash that took the Dow Jones Industrial Average down -22.6% in a single day. He has published daily fact-based fundamental and technical analysis on high-ranked stocks online for two decades. Through FACTBASEDINVESTING.COM, Kenneth provides educational articles, news, market commentary, and other information regarding proven investment systems that work in good times and bad.
Comments contained in the body of this report are technical opinions only and are not necessarily those of Gruneisen Growth Corp. The material herein has been obtained from sources believed to be reliable and accurate, however, its accuracy and completeness cannot be guaranteed. Our firm, employees, and customers may effect transactions, including transactions contrary to any recommendation herein, or have positions in the securities mentioned herein or options with respect thereto. Any recommendation contained in this report may not be suitable for all investors and it is not to be deemed an offer or solicitation on our part with respect to the purchase or sale of any securities. |
|
 |
Gold & Silver, Networking, and Semiconductor Indexes Rose
Kenneth J. Gruneisen - Passed the CAN SLIM® Master's Exam
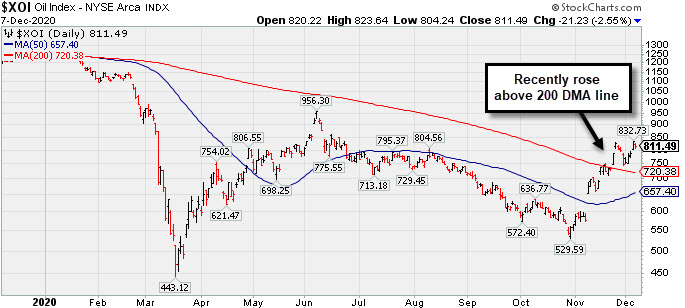
The Retail Index ($RLX -0.22%), Broker/Dealer Index ($XBD -0.30%) and Bank Index ($BKX -0.64%) ended withn modest losses. The Networking Index ($NWX +1.05%) and Semiconductor Index ($SOX +0.54%) rose while the Biotech Index ($BTK -1.22%) lost ground. Commodity-linked groups were mixed as the Gold & Silver Index ($XAU +3.05%) rose while the Oil Services Index ($OSX -2.34%) and Integrated Oil Index ($XOI -2.55%) both lost ground.
PICTURED: The Integrated Oil Index ($XOI -2.55%) recently rose above its 200-day moving average (DMA) line.
| Oil Services |
$OSX |
44.21 |
-1.06 |
-2.34% |
-43.53% |
| Integrated Oil |
$XOI |
811.49 |
-21.23 |
-2.55% |
-36.13% |
| Semiconductor |
$SOX |
2,808.21 |
+15.18 |
+0.54% |
+51.83% |
| Networking |
$NWX |
673.28 |
+7.00 |
+1.05% |
+15.40% |
| Broker/Dealer |
$XBD |
364.27 |
-1.10 |
-0.30% |
+25.45% |
| Retail |
$RLX |
3,465.38 |
-7.62 |
-0.22% |
+41.49% |
| Gold & Silver |
$XAU |
143.59 |
+4.25 |
+3.05% |
+34.30% |
| Bank |
$BKX |
95.01 |
-0.61 |
-0.64% |
-16.18% |
| Biotech |
$BTK |
5,551.09 |
-68.55 |
-1.22% |
+9.54% |
|
|
|
 |
Stubbornly Holding Ground and Rising for a New High
Kenneth J. Gruneisen - Passed the CAN SLIM® Master's Exam
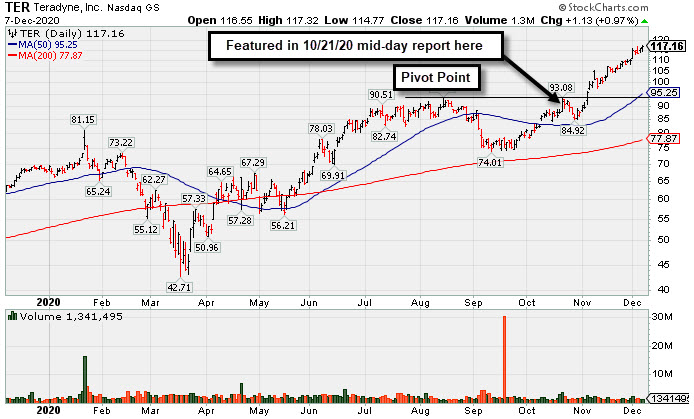
Teradyne Inc (TER +$1.13 or +0.97% to $117.16) has been stubbornly holding its ground while rising, and it posted a small gain today with below average volume for another new all-time high close. Recently it reported earnings +53% on +41% sales revenues for the Sep '20 quarter versus the year ago period, its 4th consecutive quarterly comparison with earnings above the +25% minimum earnings guideline (C criteria). Sequential comparisons show encouraging acceleration in its sales revenues growth rate. Its annual earnings (A criteria) history has been strong.
TER was highlighted in yellow with pivot point cited based on its 8/14/20 high plus 10 cents in the 10/21/20 mid-day report (read here). Subsequent gains above the pivot point lacked the necessary +40% above average volume needed to trigger a proper technical buy signal. It was last shown in this FSU section on 11/11/20 with an annotated graph under the headline, "Recent Gains for New Highs Lacked Great Volume Conviction".
The high-ranked ELECTRONICS - Semiconductor Equipment firm has 166.1 million shares outstanding (S criteria). The number of top-rated funds owning its shares rise from 1,149 in Dec '19 to 1,487 in Sep '20, a reassuring sign concerning the I criteria. Its current Up/Down Volume ratio of 2.0 is an unbiased indication its shares have been under accumulation over the past 50 days. |
|
|
Color Codes Explained :
Y - Better candidates highlighted by our
staff of experts.
G - Previously featured
in past reports as yellow but may no longer be buyable under the
guidelines.
***Last / Change / Volume data in this table is the closing quote data***
Symbol/Exchange
Company Name
Industry Group |
PRICE |
CHANGE
(%Change) |
Day High |
Volume
(% DAV)
(% 50 day avg vol) |
52 Wk Hi
% From Hi |
Featured
Date |
Price
Featured |
Pivot Featured |
|
Max Buy |
 CRL
-
NYSE
CRL
-
NYSE
Charles River Labs Intl
DRUGS - Biotechnology
|
$236.37
|
-1.05
-0.44% |
$240.29
|
208,258
66.32% of 50 DAV
50 DAV is 314,000
|
$257.88
-8.34%
|
7/15/2020
|
$192.66
|
PP = $189.95
|
|
MB = $199.45
|
 Most Recent Note - 12/7/2020 7:02:59 PM
G - Still consolidating above its 50 DMA line ($234.72) which has been acting as support. Reported Sep '20 quarterly earnings +38% on +11% sales revenues versus the year ago period, above the +25% minimum earnings guideline (C criteria).
>>> FEATURED STOCK ARTICLE : Consolidating Near Important Support Levels - 11/23/2020 |
View all notes |
Set NEW NOTE alert |
Company Profile |
SEC
News |
Chart |
Request a new note
C
A
S
I |
AMD
-
NASDAQ
Advanced Micro Devices
ELECTRONICS - Semiconductor - Broad Line
|
$94.07
|
+0.03
0.03% |
$95.00
|
39,773,544
79.68% of 50 DAV
50 DAV is 49,916,000
|
$96.37
-2.39%
|
11/18/2020
|
$82.54
|
PP = $88.72
|
|
MB = $93.16
|
Most Recent Note - 12/2/2020 12:17:24 PM
G - Trading further above its "max buy" level and hitting a new all-time high with today's gain. Rallied above the pivot point on 11/30/20 with a noted big gain backed by +69% above average volume triggering a technical buy signal. Its 50 DMA line ($82.63) defines important near term support.
>>> FEATURED STOCK ARTICLE : Volume Heavy Behind AMD's Breakout from Double Bottom Base - 11/30/2020 |
View all notes |
Set NEW NOTE alert |
Company Profile |
SEC
News |
Chart |
Request a new note
C
A
S
I |
TER
-
NASDAQ
Teradyne Inc
ELECTRONICS - Semiconductor Equipment and Mate
|
$117.16
|
+1.13
0.97% |
$117.32
|
1,341,504
87.34% of 50 DAV
50 DAV is 1,536,000
|
$117.22
-0.05%
|
10/21/2020
|
$92.22
|
PP = $93.54
|
|
MB = $98.22
|
Most Recent Note - 12/7/2020 7:08:00 PM
G - Posted a small gain today with below average volume for another new all-time high. Support to watch on pullbacks is its 50 DMA line and prior highs in the $93 area. See the latest FSU analysis for more details and a new annotated graph.
>>> FEATURED STOCK ARTICLE : Stubbornly Holding Ground and Rising for a New High - 12/7/2020 |
View all notes |
Set NEW NOTE alert |
Company Profile |
SEC
News |
Chart |
Request a new note
C
A
S
I |
TREX
-
NYSE
Trex Company Inc
MATERIALS and CONSTRUCTION - General Building Materials
|
$75.62
|
+1.17
1.57% |
$76.21
|
548,607
75.77% of 50 DAV
50 DAV is 724,000
|
$81.23
-6.91%
|
6/26/2020
|
$54.53
|
PP = $66.47
|
|
MB = $69.79
|
Most Recent Note - 12/3/2020 5:23:23 PM
G - Posted a solid gain today with +20% above average volume. Its 50 DMA line ($74.04) defines near-term support. Recently noted that it reported Sep '20 quarterly earnings +14% on +19% sales revenues versus the year ago period, below the +25% minimum guideline (C criteria) raising fundamental concerns. See the latest FSU analysis for more details and an annotated graph.
>>> FEATURED STOCK ARTICLE : Consolidating Back Above 50-Day Moving Average Line - 12/1/2020 |
View all notes |
Set NEW NOTE alert |
Company Profile |
SEC
News |
Chart |
Request a new note
C
A
S
I |
CLFD
-
NASDAQ
Clearfield Inc
TELECOMMUNICATIONS - Cables / Satalite Equipment
|
$25.56
|
+1.41
5.84% |
$25.94
|
152,939
171.84% of 50 DAV
50 DAV is 89,000
|
$25.97
-1.58%
|
11/17/2020
|
$22.06
|
PP = $26.07
|
|
MB = $27.37
|
Most Recent Note - 12/7/2020 7:06:11 PM
Y - Posting a big gain today with +66% above average volume challenging its 52-week high. Near term support is defined by its 50 DMA line ($22.56) and an upward trendline. Gains and a close above the pivot point marked by +40% above average volume are needed to trigger a proper technical buy signal.
>>> FEATURED STOCK ARTICLE : Formed Ascending Base Following Earlier Breakway Gap - 11/17/2020 |
View all notes |
Set NEW NOTE alert |
Company Profile |
SEC
News |
Chart |
Request a new note
C
A
S
I |
Symbol/Exchange
Company Name
Industry Group |
PRICE |
CHANGE
(%Change) |
Day High |
Volume
(% DAV)
(% 50 day avg vol) |
52 Wk Hi
% From Hi |
Featured
Date |
Price
Featured |
Pivot Featured |
|
Max Buy |
NOW
-
NYSE
Servicenow Inc
Computer Sftwr-Enterprse
|
$533.25
|
+7.55
1.44% |
$534.74
|
1,371,241
106.88% of 50 DAV
50 DAV is 1,283,000
|
$541.74
-1.57%
|
8/20/2020
|
$453.34
|
PP = $454.79
|
|
MB = $477.53
|
Most Recent Note - 12/7/2020 7:04:35 PM
G - Perched near ita all-time high after finding prompt support near its 50 DMA line. Recently reported Sep '20 quarterly earnings +22% on +30% sales revenues versus the year ago period, below the +25% minimum guideline (C criteria) of the fact-based investment system.
>>> FEATURED STOCK ARTICLE : Consolidating Above 50-Day Average Still Perched Near All-Time High - 11/24/2020 |
View all notes |
Set NEW NOTE alert |
Company Profile |
SEC
News |
Chart |
Request a new note
C
A
S
I |
VEEV
-
NYSE
Veeva Systems Inc Cl A
Computer Sftwr-Medical
|
$267.72
|
-4.00
-1.47% |
$275.00
|
885,066
93.86% of 50 DAV
50 DAV is 943,000
|
$313.99
-14.74%
|
10/6/2020
|
$287.71
|
PP = $298.86
|
|
MB = $313.80
|
Most Recent Note - 12/2/2020 12:49:55 PM
G - Rebounded from the early low after gapping down today, slumping back below its 50 DMA line ($282.64) and nearly testing the prior low ($253.42 on 11/10/20). Reported Oct '20 quarterly earnings +30% on +34% sales revenues versus the year ago period. Volume and volatility often increase near earnings news. Faces resistance due to overhead supply up to the $314 area.
>>> FEATURED STOCK ARTICLE : Weak Technical Action Raised Recent Concerns - 11/16/2020 |
View all notes |
Set NEW NOTE alert |
Company Profile |
SEC
News |
Chart |
Request a new note
C
A
S
I |
ALRM
-
NASDAQ
Alarm.com Holdings Inc
Security/Sfty
|
$79.52
|
-0.28
-0.35% |
$80.99
|
368,119
107.01% of 50 DAV
50 DAV is 344,000
|
$79.90
-0.48%
|
11/6/2020
|
$71.88
|
PP = $74.76
|
|
MB = $78.50
|
Most Recent Note - 12/4/2020 5:35:59 PM
G - Posted a 3rd consecutive gain today with near average volume, rising back above its "max buy" level for a new all-time high and its color code is changed to green. See the latest FSU analysis for more details and a new annotated graph.
>>> FEATURED STOCK ARTICLE : Alarm Hits a New Record High - 12/4/2020 |
View all notes |
Set NEW NOTE alert |
Company Profile |
SEC
News |
Chart |
Request a new note
C
A
S
I |
TEAM
-
NASDAQ
Atlassian Corp Plc Cl A
Comp Sftwr-Spec Enterprs
|
$227.76
|
+2.75
1.22% |
$228.86
|
1,285,346
66.98% of 50 DAV
50 DAV is 1,919,000
|
$234.44
-2.85%
|
10/12/2020
|
$193.77
|
PP = $199.60
|
|
MB = $209.58
|
Most Recent Note - 12/2/2020 6:01:07 PM
G - Posted a gain with below average volume today for a new best-ever close. Found prompt support after undercutting the prior low ($180) but it has not formed a sound new base of sufficient length. Reported earnings +7% on +26% sales revenues for the Sep '20 quarter versus the year ago period, well below the +25% minimum earnings guideline (C criteria), raising concerns.
>>> FEATURED STOCK ARTICLE : Quiet Volume Behind Gain Today for a New All-Time High - 11/27/2020 |
View all notes |
Set NEW NOTE alert |
Company Profile |
SEC
News |
Chart |
Request a new note
C
A
S
I |
YETI
-
NYSE
Yeti Holdings Inc
Leisure-Products
|
$63.82
|
+1.01
1.61% |
$64.02
|
601,762
51.13% of 50 DAV
50 DAV is 1,177,000
|
$65.49
-2.55%
|
11/5/2020
|
$57.25
|
PP = $55.14
|
|
MB = $57.90
|
Most Recent Note - 12/3/2020 5:26:45 PM
G - Posted a gain today with near average volume while hitting a new high. Prior highs in the $55-54 area define initial support to watch above its 50 DMA line ($53.65). See the latest FSU analysis for more details and an annotated graph.
>>> FEATURED STOCK ARTICLE : Volume Totals Cooloing While Stubbornly Holding Ground at High - 12/2/2020 |
View all notes |
Set NEW NOTE alert |
Company Profile |
SEC
News |
Chart |
Request a new note
C
A
S
I |
Symbol/Exchange
Company Name
Industry Group |
PRICE |
CHANGE
(%Change) |
Day High |
Volume
(% DAV)
(% 50 day avg vol) |
52 Wk Hi
% From Hi |
Featured
Date |
Price
Featured |
Pivot Featured |
|
Max Buy |
BJ
-
NYSE
B J S Whlsl Club Hldgs
Retail-DiscountandVariety
|
$38.56
|
-0.11
-0.28% |
$39.23
|
1,626,852
70.61% of 50 DAV
50 DAV is 2,304,000
|
$47.46
-18.75%
|
11/19/2020
|
$42.97
|
PP = $47.56
|
|
MB = $49.94
|
Most Recent Note - 12/3/2020 5:19:20 PM
G - Slumped further below its 50 DMA line ($40.80) raisingf more concerns with a 7th consecutive loss today backed by higher volume. A rebound above the 50 DMA line is needed for its outlook to improve.
>>> FEATURED STOCK ARTICLE : Rebounding Near High With 3rd Strong Quarterly Report - 11/19/2020 |
View all notes |
Set NEW NOTE alert |
Company Profile |
SEC
News |
Chart |
Request a new note
C
A
S
I |
AAXN
-
NASDAQ
Axon Enterprise Inc
Security/Sfty
|
$122.79
|
-1.39
-1.12% |
$126.00
|
337,875
64.23% of 50 DAV
50 DAV is 526,000
|
$130.41
-5.84%
|
11/6/2020
|
$122.75
|
PP = $113.00
|
|
MB = $118.65
|
Most Recent Note - 12/3/2020 5:15:02 PM
G - Still perched near its all time high with volume totals cooling. Wedged to new high territory with gains lacking volume conviction. Recently reported Sep '20 quarterly earnings +43% on +27% sales revenues versus the year ago period. It broke out of a cup-with-high-handle base with volume drying up during the handle. See the latest FSU analysis for more details and a new annotated graph.
>>> FEATURED STOCK ARTICLE : Volume Totals Cooling While Hovering Near All-Time High - 12/3/2020 |
View all notes |
Set NEW NOTE alert |
Company Profile |
SEC
News |
Chart |
Request a new note
C
A
S
I |
QTWO
-
NYSE
Q2 Holdings Inc
Computer Sftwr-Financial
|
$114.10
|
-2.40
-2.06% |
$116.86
|
443,332
112.24% of 50 DAV
50 DAV is 395,000
|
$119.97
-4.89%
|
11/12/2020
|
$105.14
|
PP = $106.54
|
|
MB = $111.87
|
Most Recent Note - 12/3/2020 5:24:46 PM
G - Posted a gain today with average volume while hitting a new high. Showed great earning increases with strong underlying sales revenues growth for the Jun and Sep '20 quarters versus the year ago periods. Annual earnings growth has been strong. Completed new Public Offerings on 6/06/19 and 5/13/20.
>>> FEATURED STOCK ARTICLE : Churning Action Near Prior High Indicative of Distributional Pressure - 11/12/2020 |
View all notes |
Set NEW NOTE alert |
Company Profile |
SEC
News |
Chart |
Request a new note
C
A
S
I |
|
|
|
THESE ARE NOT BUY RECOMMENDATIONS!
Comments contained in the body of this report are technical
opinions only. The material herein has been obtained
from sources believed to be reliable and accurate, however,
its accuracy and completeness cannot be guaranteed.
This site is not an investment advisor, hence it does
not endorse or recommend any securities or other investments.
Any recommendation contained in this report may not
be suitable for all investors and it is not to be deemed
an offer or solicitation on our part with respect to
the purchase or sale of any securities. All trademarks,
service marks and trade names appearing in this report
are the property of their respective owners, and are
likewise used for identification purposes only.
This report is a service available
only to active Paid Premium Members.
You may opt-out of receiving report notifications
at any time. Questions or comments may be submitted
by writing to Premium Membership Services 665 S.E. 10 Street, Suite 201 Deerfield Beach, FL 33441-5634 or by calling 1-800-965-8307
or 954-785-1121.
|
|
|