You are not logged in.
This means you
CAN ONLY VIEW reports that were published prior to Monday, April 7, 2025.
You
MUST UPGRADE YOUR MEMBERSHIP if you want to see any current reports.
AFTER MARKET UPDATE - TUESDAY, DECEMBER 8TH, 2020
Previous After Market Report Next After Market Report >>>
|
|
|
|
DOW |
+104.09 |
30,173.88 |
+0.35% |
|
Volume |
911,242,931 |
-2% |
|
Volume |
4,790,996,600 |
+1% |
|
NASDAQ |
+60.67 |
12,580.62 |
+0.48% |
|
Advancers |
1,981 |
64% |
|
Advancers |
2,320 |
64% |
|
S&P 500 |
+10.29 |
3,702.25 |
+0.28% |
|
Decliners |
1,122 |
36% |
|
Decliners |
1,307 |
36% |
|
Russell 2000 |
+26.53 |
1,917.78 |
+1.40% |
|
52 Wk Highs |
249 |
|
|
52 Wk Highs |
399 |
|
|
S&P 600 |
+9.74 |
1,090.78 |
+0.90% |
|
52 Wk Lows |
3 |
|
|
52 Wk Lows |
13 |
|
|
 |
Leadership Improved as Indices Overcame Weakness to End Higher
Kenneth J. Gruneisen - Passed the CAN SLIM® Master's Exam
The Dow rose 104 points and the S&P 500 added 0.3% after both benchmarks opened the session lower. The Nasdaq Composite advanced 0.5% to finish at a fresh record high. The volume totals were mixed, lighter than the prior session on the NYSE and slightly higher on the Nasdaq exchange. Breadth was positive as advancers led decliners by almost a 2-1 margin on the NYSE and on the Nasdaq exchange. There were 92 high-ranked companies from the Leaders List that hit new 52-week highs and were listed on the BreakOuts Page, versus the total of 84 on the prior session. New 52-week highs totals contracted yet still solidly outnumbered new 52-week lows totals on both exchanges. The major indices confirmed a new uptrend (M criteria) with recent follow-through gains backed by higher volume and more leadership. Investors are reminded to always make buying and selling decisions based based on the strict criteria and rules of the fact-based investment system. 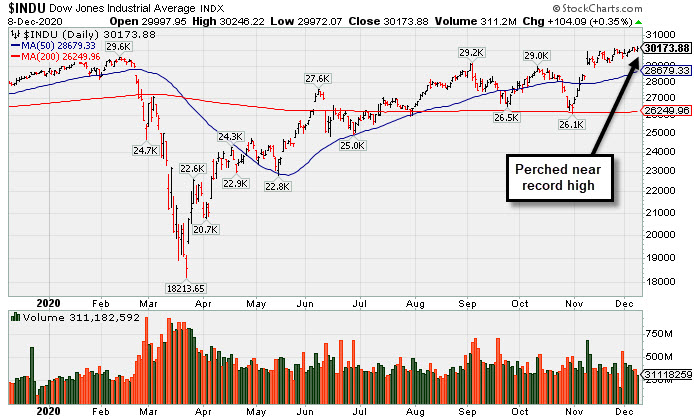 PICTURED: The Dow Jones Industrial Average is perched near its record high.
U.S. stocks finished slightly higher on Tuesday, as investors weighed rising coronavirus infections and lockdown restrictions against ongoing vaccine optimism. Market participants also monitored fiscal stimulus negotiations in Washington. Progress was seemingly made this afternoon as Senate Majority Leader Mitch McConnell reportedly backed off a requirement that any bill include liability protection.
Six of 11 S&P 500 sectors finished in positive territory, with Energy and Materials stocks pacing the gains while Real Estate lagged. In corporate news, AutoZone (AZO -5.29%) topped Wall Street earnings estimates but shares fell as the retailer warned of rising expenses. Toll Brothers (TOL -7.90%) slumped also, after it topped analyst profit projections, as the luxury homebuilder provided tepid forward guidance. Personal styling company Stitch Fix (SFIX +39.24% blasted higher after reporting a surprise profit and strong client growth. Meanwhile, Tesla (TSLA +1.27%) rose despite announcing plans for a $5 billion secondary stock offering.
On the data front, the NFIB gauge of small business optimism fell 2.6 points to 101.4 in November, the largest decline in seven months. Treasuries were little changed, with the yield on the benchmark 10-year note dropping one basis point to 0.92%. In commodities, WTI crude slipped 0.2% to $45.66/barrel while gold rose 0.4% to a three-week high of $1869.80/ounce. |
 Kenneth J. Gruneisen started out as a licensed stockbroker in August 1987, a couple of months prior to the historic stock market crash that took the Dow Jones Industrial Average down -22.6% in a single day. He has published daily fact-based fundamental and technical analysis on high-ranked stocks online for two decades. Through FACTBASEDINVESTING.COM, Kenneth provides educational articles, news, market commentary, and other information regarding proven investment systems that work in good times and bad.
Comments contained in the body of this report are technical opinions only and are not necessarily those of Gruneisen Growth Corp. The material herein has been obtained from sources believed to be reliable and accurate, however, its accuracy and completeness cannot be guaranteed. Our firm, employees, and customers may effect transactions, including transactions contrary to any recommendation herein, or have positions in the securities mentioned herein or options with respect thereto. Any recommendation contained in this report may not be suitable for all investors and it is not to be deemed an offer or solicitation on our part with respect to the purchase or sale of any securities. |
|
 |
Energy Indexes and Tech Indexes Rose
Kenneth J. Gruneisen - Passed the CAN SLIM® Master's Exam
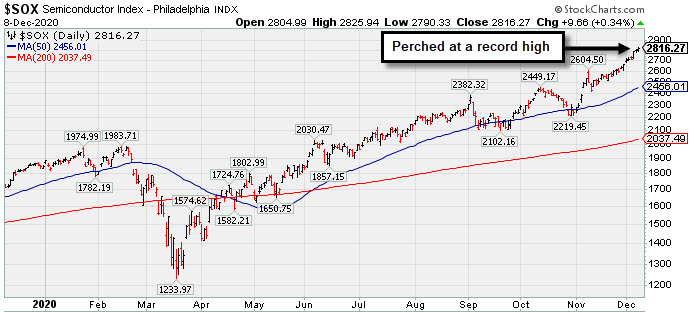
The Retail Index ($RLX +0.07%) finished flat while the Broker/Dealer Index ($XBD -0.14%) and Bank Index ($BKX -0.16%) each ended just slightly in the red. The Semiconductor Index ($SOX +0.35%), Biotech Index ($BTK +0.35%), and Networking Index ($NWX +0.43%) each posted a modest gain. The Oil Services Index ($OSX +2.84%) outpaced the Integrated Oil Index ($XOI +0.56%) while the Gold & Silver Index ($XAU -0.20%) edged lower.
PICTURED: The Semiconductor Index ($SOX +0.35%) is perched at a record high.
| Oil Services |
$OSX |
45.46 |
+1.25 |
+2.84% |
-41.93% |
| Integrated Oil |
$XOI |
816.07 |
+4.58 |
+0.56% |
-35.77% |
| Semiconductor |
$SOX |
2,816.35 |
+9.74 |
+0.35% |
+52.27% |
| Networking |
$NWX |
676.20 |
+2.92 |
+0.43% |
+15.90% |
| Broker/Dealer |
$XBD |
363.77 |
-0.50 |
-0.14% |
+25.27% |
| Retail |
$RLX |
3,467.68 |
+2.30 |
+0.07% |
+41.58% |
| Gold & Silver |
$XAU |
143.30 |
-0.29 |
-0.20% |
+34.02% |
| Bank |
$BKX |
94.86 |
-0.15 |
-0.16% |
-16.32% |
| Biotech |
$BTK |
5,570.28 |
+19.18 |
+0.35% |
+9.92% |
|
|
|
 |
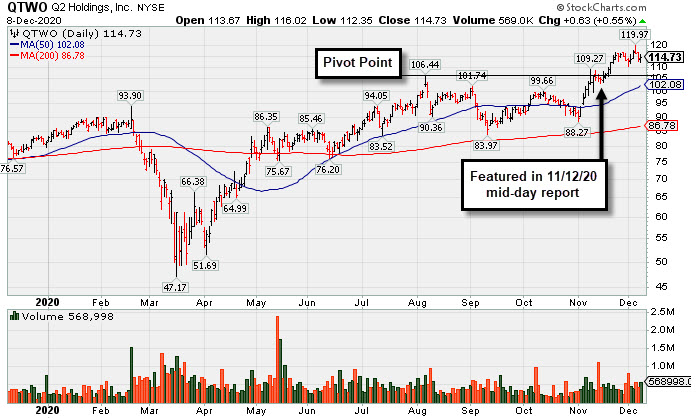
Computer Software - Financial Firm Hovering Near Record High
Kenneth J. Gruneisen - Passed the CAN SLIM® Master's Exam
Q2 Holdings Inc (QTWO +$0.63 or +0.55% to $114.73) posted a gain today with above average volume while hovering above its "max buy" level and perched near its all-time high. The prior high in the $106 area defines initial support to watch above its 50-day moving average (DMA) line ($$102.08) on pullbacks.
QTWO was last shown in the FSU section on 11/12/20 with an annotated graph under the headline "Churning Action Near Prior High Indicative of Distributional Pressure". It was highlighted in yellow with new pivot point cited based on its 8/06/20 high plus 10 cents in the earlier mid-day report (read here).
It has a 97 Earnings Per Share Rating. It showed great earning increases with strong underlying sales revenues growth for the Jun and Sep '20 quarters versus the year ago periods. Annual earnings growth has been strong. Completed new Public Offerings on 6/06/19 and 5/13/20. The company hails from the Computer Sftwr-Financial group. There are only 59.3 million shares outstanding (S criteria).
The number of top-rated funds owning its shares rose from 404 in Dec '19 to 466 in Sep '20, a reassuring sign concerning the I criteria. Its current Up/Down Volume Ratio of 1.0 is an unbiased indication its shares have been neutral concerning accumulation/distribution over the past 50 days.
|
|
|
Color Codes Explained :
Y - Better candidates highlighted by our
staff of experts.
G - Previously featured
in past reports as yellow but may no longer be buyable under the
guidelines.
***Last / Change / Volume data in this table is the closing quote data***
Symbol/Exchange
Company Name
Industry Group |
PRICE |
CHANGE
(%Change) |
Day High |
Volume
(% DAV)
(% 50 day avg vol) |
52 Wk Hi
% From Hi |
Featured
Date |
Price
Featured |
Pivot Featured |
|
Max Buy |
 CRL
-
NYSE
CRL
-
NYSE
Charles River Labs Intl
DRUGS - Biotechnology
|
$242.09
|
+5.72
2.42% |
$242.80
|
306,667
97.66% of 50 DAV
50 DAV is 314,000
|
$257.88
-6.12%
|
7/15/2020
|
$192.66
|
PP = $189.95
|
|
MB = $199.45
|
Most Recent Note - 12/7/2020 7:02:59 PM
G - Still consolidating above its 50 DMA line ($234.72) which has been acting as support. Reported Sep '20 quarterly earnings +38% on +11% sales revenues versus the year ago period, above the +25% minimum earnings guideline (C criteria).
>>> FEATURED STOCK ARTICLE : Consolidating Near Important Support Levels - 11/23/2020 |
View all notes |
Set NEW NOTE alert |
Company Profile |
SEC
News |
Chart |
Request a new note
C
A
S
I |
AMD
-
NASDAQ
Advanced Micro Devices
ELECTRONICS - Semiconductor - Broad Line
|
$92.92
|
-1.15
-1.22% |
$94.74
|
33,839,889
68.02% of 50 DAV
50 DAV is 49,748,000
|
$96.37
-3.58%
|
11/18/2020
|
$82.54
|
PP = $88.72
|
|
MB = $93.16
|
 Most Recent Note - 12/8/2020 7:14:03 PM
G - Volume totals are cooling while stubbornly holding ground perched at its all-time high. Its 50 DMA line ($83.92) defines important near term support to watch on pulllbacks.
>>> FEATURED STOCK ARTICLE : Volume Heavy Behind AMD's Breakout from Double Bottom Base - 11/30/2020 |
View all notes |
Set NEW NOTE alert |
Company Profile |
SEC
News |
Chart |
Request a new note
C
A
S
I |
TER
-
NASDAQ
Teradyne Inc
ELECTRONICS - Semiconductor Equipment and Mate
|
$118.67
|
+1.51
1.29% |
$118.96
|
1,113,707
72.89% of 50 DAV
50 DAV is 1,528,000
|
$117.32
1.15%
|
10/21/2020
|
$92.22
|
PP = $93.54
|
|
MB = $98.22
|
Most Recent Note - 12/7/2020 7:08:00 PM
G - Posted a small gain today with below average volume for another new all-time high. Support to watch on pullbacks is its 50 DMA line and prior highs in the $93 area. See the latest FSU analysis for more details and a new annotated graph.
>>> FEATURED STOCK ARTICLE : Stubbornly Holding Ground and Rising for a New High - 12/7/2020 |
View all notes |
Set NEW NOTE alert |
Company Profile |
SEC
News |
Chart |
Request a new note
C
A
S
I |
TREX
-
NYSE
Trex Company Inc
MATERIALS and CONSTRUCTION - General Building Materials
|
$75.77
|
+0.15
0.20% |
$76.53
|
665,522
91.67% of 50 DAV
50 DAV is 726,000
|
$81.23
-6.72%
|
6/26/2020
|
$54.53
|
PP = $66.47
|
|
MB = $69.79
|
Most Recent Note - 12/3/2020 5:23:23 PM
G - Posted a solid gain today with +20% above average volume. Its 50 DMA line ($74.04) defines near-term support. Recently noted that it reported Sep '20 quarterly earnings +14% on +19% sales revenues versus the year ago period, below the +25% minimum guideline (C criteria) raising fundamental concerns. See the latest FSU analysis for more details and an annotated graph.
>>> FEATURED STOCK ARTICLE : Consolidating Back Above 50-Day Moving Average Line - 12/1/2020 |
View all notes |
Set NEW NOTE alert |
Company Profile |
SEC
News |
Chart |
Request a new note
C
A
S
I |
CLFD
-
NASDAQ
Clearfield Inc
TELECOMMUNICATIONS - Cables / Satalite Equipment
|
$25.60
|
+0.04
0.16% |
$26.54
|
118,109
129.79% of 50 DAV
50 DAV is 91,000
|
$25.97
-1.42%
|
11/17/2020
|
$22.06
|
PP = $26.07
|
|
MB = $27.37
|
Most Recent Note - 12/7/2020 7:06:11 PM
Y - Posting a big gain today with +66% above average volume challenging its 52-week high. Near term support is defined by its 50 DMA line ($22.56) and an upward trendline. Gains and a close above the pivot point marked by +40% above average volume are needed to trigger a proper technical buy signal.
>>> FEATURED STOCK ARTICLE : Formed Ascending Base Following Earlier Breakway Gap - 11/17/2020 |
View all notes |
Set NEW NOTE alert |
Company Profile |
SEC
News |
Chart |
Request a new note
C
A
S
I |
Symbol/Exchange
Company Name
Industry Group |
PRICE |
CHANGE
(%Change) |
Day High |
Volume
(% DAV)
(% 50 day avg vol) |
52 Wk Hi
% From Hi |
Featured
Date |
Price
Featured |
Pivot Featured |
|
Max Buy |
NOW
-
NYSE
Servicenow Inc
Computer Sftwr-Enterprse
|
$542.25
|
+9.00
1.69% |
$544.05
|
1,869,837
145.29% of 50 DAV
50 DAV is 1,287,000
|
$541.74
0.09%
|
8/20/2020
|
$453.34
|
PP = $454.79
|
|
MB = $477.53
|
Most Recent Note - 12/7/2020 7:04:35 PM
G - Perched near ita all-time high after finding prompt support near its 50 DMA line. Recently reported Sep '20 quarterly earnings +22% on +30% sales revenues versus the year ago period, below the +25% minimum guideline (C criteria) of the fact-based investment system.
>>> FEATURED STOCK ARTICLE : Consolidating Above 50-Day Average Still Perched Near All-Time High - 11/24/2020 |
View all notes |
Set NEW NOTE alert |
Company Profile |
SEC
News |
Chart |
Request a new note
C
A
S
I |
VEEV
-
NYSE
Veeva Systems Inc Cl A
Computer Sftwr-Medical
|
$269.54
|
+1.82
0.68% |
$270.77
|
916,543
96.38% of 50 DAV
50 DAV is 951,000
|
$313.99
-14.16%
|
10/6/2020
|
$287.71
|
PP = $298.86
|
|
MB = $313.80
|
Most Recent Note - 12/8/2020 7:20:48 PM
G - Still sputtering below its 50 DMA line ($282.35) yet finding support above the prior low ($253.42 on 11/10/20). Fundamentals remain strong. Faces resistance due to overhead supply up to the $314 area.
>>> FEATURED STOCK ARTICLE : Weak Technical Action Raised Recent Concerns - 11/16/2020 |
View all notes |
Set NEW NOTE alert |
Company Profile |
SEC
News |
Chart |
Request a new note
C
A
S
I |
ALRM
-
NASDAQ
Alarm.com Holdings Inc
Security/Sfty
|
$79.94
|
+0.42
0.53% |
$80.34
|
309,546
89.21% of 50 DAV
50 DAV is 347,000
|
$80.99
-1.30%
|
11/6/2020
|
$71.88
|
PP = $74.76
|
|
MB = $78.50
|
Most Recent Note - 12/4/2020 5:35:59 PM
G - Posted a 3rd consecutive gain today with near average volume, rising back above its "max buy" level for a new all-time high and its color code is changed to green. See the latest FSU analysis for more details and a new annotated graph.
>>> FEATURED STOCK ARTICLE : Alarm Hits a New Record High - 12/4/2020 |
View all notes |
Set NEW NOTE alert |
Company Profile |
SEC
News |
Chart |
Request a new note
C
A
S
I |
TEAM
-
NASDAQ
Atlassian Corp Plc Cl A
Comp Sftwr-Spec Enterprs
|
$229.84
|
+2.08
0.91% |
$235.17
|
1,106,927
57.32% of 50 DAV
50 DAV is 1,931,000
|
$234.44
-1.96%
|
10/12/2020
|
$193.77
|
PP = $199.60
|
|
MB = $209.58
|
Most Recent Note - 12/8/2020 7:18:33 PM
G - Extended from any sound base, it posted another gain with below average volume today for a new all-time high and best-ever close. Reported earnings +7% on +26% sales revenues for the Sep '20 quarter versus the year ago period, well below the +25% minimum earnings guideline (C criteria), raising concerns.
>>> FEATURED STOCK ARTICLE : Quiet Volume Behind Gain Today for a New All-Time High - 11/27/2020 |
View all notes |
Set NEW NOTE alert |
Company Profile |
SEC
News |
Chart |
Request a new note
C
A
S
I |
YETI
-
NYSE
Yeti Holdings Inc
Leisure-Products
|
$67.10
|
+3.28
5.14% |
$67.54
|
1,657,769
141.81% of 50 DAV
50 DAV is 1,169,000
|
$65.49
2.46%
|
11/5/2020
|
$57.25
|
PP = $55.14
|
|
MB = $57.90
|
Most Recent Note - 12/8/2020 7:22:15 PM
G - Posted a big gain today with +39% above average volume while hitting another new all-time high. Prior highs in the $55-54 area define initial support to watch coinciding with its 50 DMA line ($54.82).
>>> FEATURED STOCK ARTICLE : Volume Totals Cooloing While Stubbornly Holding Ground at High - 12/2/2020 |
View all notes |
Set NEW NOTE alert |
Company Profile |
SEC
News |
Chart |
Request a new note
C
A
S
I |
Symbol/Exchange
Company Name
Industry Group |
PRICE |
CHANGE
(%Change) |
Day High |
Volume
(% DAV)
(% 50 day avg vol) |
52 Wk Hi
% From Hi |
Featured
Date |
Price
Featured |
Pivot Featured |
|
Max Buy |
BJ
-
NYSE
BJs Wholesale Club Hldgs
Retail-DiscountandVariety
|
$38.72
|
+0.16
0.41% |
$38.96
|
1,671,395
72.57% of 50 DAV
50 DAV is 2,303,100
|
$47.46
-18.42%
|
11/19/2020
|
$42.97
|
PP = $47.56
|
|
MB = $49.94
|
Most Recent Note - 12/3/2020 5:19:20 PM
G - Slumped further below its 50 DMA line ($40.80) raisingf more concerns with a 7th consecutive loss today backed by higher volume. A rebound above the 50 DMA line is needed for its outlook to improve.
>>> FEATURED STOCK ARTICLE : Rebounding Near High With 3rd Strong Quarterly Report - 11/19/2020 |
View all notes |
Set NEW NOTE alert |
Company Profile |
SEC
News |
Chart |
Request a new note
C
A
S
I |
AAXN
-
NASDAQ
Axon Enterprise Inc
Security/Sfty
|
$125.56
|
+2.77
2.26% |
$125.74
|
425,940
81.29% of 50 DAV
50 DAV is 524,000
|
$130.41
-3.72%
|
11/6/2020
|
$122.75
|
PP = $113.00
|
|
MB = $118.65
|
Most Recent Note - 12/3/2020 5:15:02 PM
G - Still perched near its all time high with volume totals cooling. Wedged to new high territory with gains lacking volume conviction. Recently reported Sep '20 quarterly earnings +43% on +27% sales revenues versus the year ago period. It broke out of a cup-with-high-handle base with volume drying up during the handle. See the latest FSU analysis for more details and a new annotated graph.
>>> FEATURED STOCK ARTICLE : Volume Totals Cooling While Hovering Near All-Time High - 12/3/2020 |
View all notes |
Set NEW NOTE alert |
Company Profile |
SEC
News |
Chart |
Request a new note
C
A
S
I |
QTWO
-
NYSE
Q2 Holdings Inc
Computer Sftwr-Financial
|
$114.73
|
+0.63
0.55% |
$116.02
|
568,998
142.61% of 50 DAV
50 DAV is 399,000
|
$119.97
-4.37%
|
11/12/2020
|
$105.14
|
PP = $106.54
|
|
MB = $111.87
|
Most Recent Note - 12/8/2020 7:16:58 PM
G - Posted a small gain today with above average volume while hovering above its "max buy" level and near its all-time high. Prior high in the $106 area and its 50 DMA line ($102) define important near term suport to watch on pullbacks. See the latest FSU analysis for more details and a new annotated graph.
>>> FEATURED STOCK ARTICLE : Computer Software - Financial Firm Hovering Near Record High - 12/8/2020 |
View all notes |
Set NEW NOTE alert |
Company Profile |
SEC
News |
Chart |
Request a new note
C
A
S
I |
|
|
|
THESE ARE NOT BUY RECOMMENDATIONS!
Comments contained in the body of this report are technical
opinions only. The material herein has been obtained
from sources believed to be reliable and accurate, however,
its accuracy and completeness cannot be guaranteed.
This site is not an investment advisor, hence it does
not endorse or recommend any securities or other investments.
Any recommendation contained in this report may not
be suitable for all investors and it is not to be deemed
an offer or solicitation on our part with respect to
the purchase or sale of any securities. All trademarks,
service marks and trade names appearing in this report
are the property of their respective owners, and are
likewise used for identification purposes only.
This report is a service available
only to active Paid Premium Members.
You may opt-out of receiving report notifications
at any time. Questions or comments may be submitted
by writing to Premium Membership Services 665 S.E. 10 Street, Suite 201 Deerfield Beach, FL 33441-5634 or by calling 1-800-965-8307
or 954-785-1121.
|
|
|