You are not logged in.
This means you
CAN ONLY VIEW reports that were published prior to Saturday, March 1, 2025.
You
MUST UPGRADE YOUR MEMBERSHIP if you want to see any current reports.
AFTER MARKET UPDATE - FRIDAY, DECEMBER 18TH, 2020
Previous After Market Report Next After Market Report >>>
|
|
|
|
DOW |
-124.32 |
30,179.05 |
-0.41% |
|
Volume |
3,108,899,600 |
+224% |
|
Volume |
7,053,347,400 |
+43% |
|
NASDAQ |
-20.44 |
12,744.30 |
-0.16% |
|
Advancers |
1,344 |
44% |
|
Advancers |
1,655 |
45% |
|
S&P 500 |
-13.07 |
3,709.41 |
-0.35% |
|
Decliners |
1,742 |
56% |
|
Decliners |
2,001 |
55% |
|
Russell 2000 |
-8.06 |
1,969.99 |
-0.41% |
|
52 Wk Highs |
270 |
|
|
52 Wk Highs |
448 |
|
|
S&P 600 |
-8.58 |
1,108.16 |
-0.77% |
|
52 Wk Lows |
4 |
|
|
52 Wk Lows |
8 |
|
|
 |
Leadership Expanded as Major Indices Pulled Back from Record Highs
Kenneth J. Gruneisen - Passed the CAN SLIM® Master's Exam
The Dow slipped 124 points, but posted a weekly gain of 0.4%. The S&P 500 fell 0.4%, but rose 1.3% for the week. The Nasdaq Composite declined 0.1%, paring its weekly rally to 3.1%. Friday's volume totals were higher than the prior session on the NYSE and on the Nasdaq exchange, greatly inflated by options expirations. Breadth was negative as decliners led advancers by a 4-3 margin on the NYSE and 5-4 on the Nasdaq exchange. There were 117 high-ranked companies from the Leaders List that hit new 52-week highs and were listed on the BreakOuts Page, versus the total of 89 on the prior session. New 52-week highs totals expanded and solidly outnumbered new 52-week lows which fell to the single digits on both exchanges. The major indices are in a confirmed uptrend (M criteria). Investors are reminded to always make buying and selling decisions based based on the strict criteria and rules of the fact-based investment system. 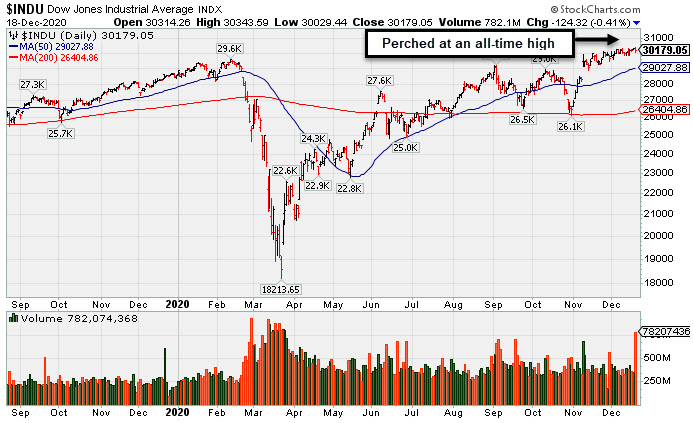 PICTURED: The Dow Jones Industrial Average is perched near its record high.
Stocks ended lower on Friday, as lawmakers made no discernable progress on fiscal stimulus negotiations in Washington. Meanwhile, vaccine optimism remained elevated, with the FDA widely expected to grant Moderna’s (MRNA -2.62%) vaccine candidate emergency use authorization.
Seven of 11 S&P 500 sectors ended in negative territory, with Real Estate leading laggards. Energy was another notable decliner, despite WTI crude adding 1.3% to $49.00/barrel. In corporate news, Intel (INTC -6.30%) slumped after Microsoft (MSFT -0.38%) announced it was working on developing proprietary chips for use in its data centers. In earnings, FedEx (FDX -5.71%) fell as rising costs associated with the ongoing pandemic dampened its top and bottom line beat. Elsewhere, investors saw increased volatility as options and futures on indexes and stocks expired simultaneously in a quarterly event known as quadruple witching.
On the data front, an update showed third quarter U.S. current account deficit widened to $178.5 billion in the July through September period, which was smaller than the $187.0 billion expected shortfall. A separate release revealed the leading economic index declined to 0.6% in November from 0.8% the prior month. Treasuries were mixed, with the yield curve modestly steepening. The yield on the benchmark 10-year note rose one basis point to 0.94%. Meanwhile, gold slipped 0.1% to $1885.70/ounce as the U.S. dollar index rose 0.2% to pare its weekly decline to 0.9%. |
 Kenneth J. Gruneisen started out as a licensed stockbroker in August 1987, a couple of months prior to the historic stock market crash that took the Dow Jones Industrial Average down -22.6% in a single day. He has published daily fact-based fundamental and technical analysis on high-ranked stocks online for two decades. Through FACTBASEDINVESTING.COM, Kenneth provides educational articles, news, market commentary, and other information regarding proven investment systems that work in good times and bad.
Comments contained in the body of this report are technical opinions only and are not necessarily those of Gruneisen Growth Corp. The material herein has been obtained from sources believed to be reliable and accurate, however, its accuracy and completeness cannot be guaranteed. Our firm, employees, and customers may effect transactions, including transactions contrary to any recommendation herein, or have positions in the securities mentioned herein or options with respect thereto. Any recommendation contained in this report may not be suitable for all investors and it is not to be deemed an offer or solicitation on our part with respect to the purchase or sale of any securities. |
|
 |
Network and Biotech Indexes Posted Standout Gains
Kenneth J. Gruneisen - Passed the CAN SLIM® Master's Exam
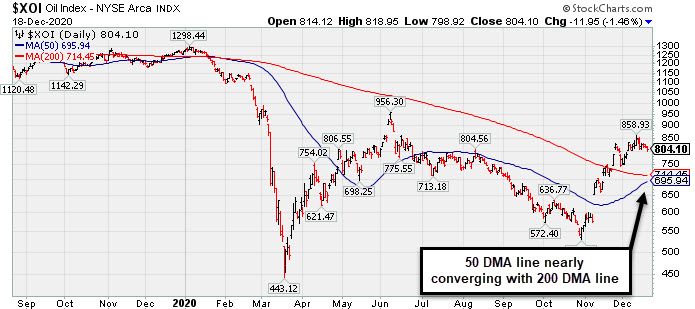
Modest losses for the Retail Index ($RLX -0.81%), Bank Index ($BKX -1.18%), and Broker/Dealer Index ($XBD -0.46%) created a drag on the major indices. Commodity-linked groups had a negative bias on Friday as the Gold & Silver Index ($XAU -2.26%), Oil Services Index ($OSX -2.38%), and Integrated Oil Index ($XOI -1.46%) ended unanimously lower. The Networking Index ($NWX +2.48%) led the tech sector and the Biotech Index ($BTK +0.52%) also edged higher, meanwhile, the Semiconductor Index ($SOX -0.39%) lost ground.
PICTURED: The Integrated Oil Index ($XOI -1.46%) has been holding its ground after rebounding toward its June high. Its 50-day moving average (DMA) line is approaching the 200 DMA line. Such a convergence would be termed a "golden cross".by some technical analysts. Thursday's report showed how that has already happened for the OSX. These are noteworthy technical improvements after the energy group has suffered badly for many years.
| Oil Services |
$OSX |
44.89 |
-1.10 |
-2.38% |
-42.66% |
| Integrated Oil |
$XOI |
804.10 |
-11.95 |
-1.46% |
-36.71% |
| Semiconductor |
$SOX |
2,767.35 |
-10.79 |
-0.39% |
+49.62% |
| Networking |
$NWX |
714.49 |
+17.26 |
+2.48% |
+22.47% |
| Broker/Dealer |
$XBD |
370.11 |
-1.69 |
-0.46% |
+27.46% |
| Retail |
$RLX |
3,529.69 |
-28.98 |
-0.81% |
+44.11% |
| Gold & Silver |
$XAU |
144.90 |
-3.34 |
-2.26% |
+35.53% |
| Bank |
$BKX |
93.49 |
-1.11 |
-1.18% |
-17.53% |
| Biotech |
$BTK |
5,918.43 |
+30.66 |
+0.52% |
+16.79% |
|
|
|
 |
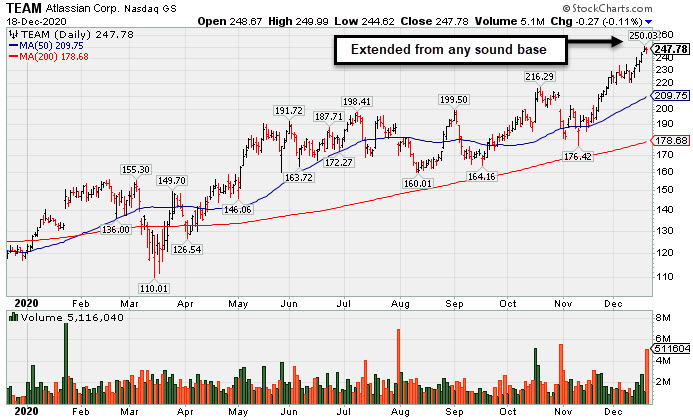
Extended From Any Base After Streak of Gains for New Highs
Kenneth J. Gruneisen - Passed the CAN SLIM® Master's Exam
Atlassian Corp (TEAM -$0.27 or -0.11% to $247.78) is extended from any sound base as today's loss broke a streak of 6 consecutive gains for new 52-week and all-time highs. Its prior high ($216) and 50-day moving average line ($209) define near term support to watch on pullbacks.
It has shown resilience after it reported earnings +7% on +26% sales revenues for the Sep '20 quarter versus the year ago period, well below the +25% minimum earnings guideline (C criteria), raising fundamental concerns. TEAM was highlighted in yellow with new pivot point cited based on its 9/01/20 high plus 10 cents in the 10/12/20 earlier mid-day report (read here). An annotated graph was last shown in the 11/27/20 report under the headline, "Quiet Volume Behind Gain Today for a New All-Time High".
TEAM has a 93 Earnings Per Share rating. This Australia - based software developer's annual earnings (A criteria) history has been strong since its $21 IPO on 12/10/15. Its Relative Strength Rating is 88, above the 80+ minimum guideline for buy candidates.
The number of top-rated funds owning its shares rose from 266 in Sep '17 to 828 in sEP '20, a reassuring sign concerning the I criteria. It has a Timeliness Rating of B and Sponsorship Rating of A. Its current Up/Down Volume Ratio of 1.1 is an unbiased indication its shares have been under slight accumulation over the past 50 days. |
|
|
Color Codes Explained :
Y - Better candidates highlighted by our
staff of experts.
G - Previously featured
in past reports as yellow but may no longer be buyable under the
guidelines.
***Last / Change / Volume data in this table is the closing quote data***
Symbol/Exchange
Company Name
Industry Group |
PRICE |
CHANGE
(%Change) |
Day High |
Volume
(% DAV)
(% 50 day avg vol) |
52 Wk Hi
% From Hi |
Featured
Date |
Price
Featured |
Pivot Featured |
|
Max Buy |
 CRL
-
NYSE
CRL
-
NYSE
Charles River Labs Intl
DRUGS - Biotechnology
|
$248.97
|
+1.91
0.77% |
$250.58
|
717,043
227.63% of 50 DAV
50 DAV is 315,000
|
$257.88
-3.46%
|
12/17/2020
|
$247.06
|
PP = $257.98
|
|
MB = $270.88
|
Most Recent Note - 12/17/2020 5:06:04 PM
Y - Posted a gain today with light volume. Color code is changed to yellow with new pivot point cited based on its 11/09/20 high plus 10 cents. Subsequent gans above its pivot point backed by at least +40% above average volume may trigger a new (or add-on) technical buy signal. Its 50 DMA line ($236) has been acting as support. Reported Sep '20 quarterly earnings +38% on +11% sales revenues versus the year ago period, above the +25% minimum earnings guideline (C criteria).
>>> FEATURED STOCK ARTICLE : CRL Consolidating Above 50-Day Moving Average Line - 12/14/2020 |
View all notes |
Set NEW NOTE alert |
Company Profile |
SEC
News |
Chart |
Request a new note
C
A
S
I |
AMD
-
NASDAQ
Advanced Micro Devices
ELECTRONICS - Semiconductor - Broad Line
|
$95.92
|
-0.92
-0.95% |
$97.68
|
51,594,570
107.54% of 50 DAV
50 DAV is 47,978,000
|
$97.98
-2.10%
|
11/18/2020
|
$82.54
|
PP = $88.72
|
|
MB = $93.16
|
Most Recent Note - 12/15/2020 5:44:34 PM
G - Hit a new all-time high with today's gain backed by +17% above average volume, getting more extended from the previously noted "double bottom" base. Its 50 DMA line ($84.89) defines important near term support to watch on pullbacks.
>>> FEATURED STOCK ARTICLE : Volume Heavy Behind AMD's Breakout from Double Bottom Base - 11/30/2020 |
View all notes |
Set NEW NOTE alert |
Company Profile |
SEC
News |
Chart |
Request a new note
C
A
S
I |
TER
-
NASDAQ
Teradyne Inc
ELECTRONICS - Semiconductor Equipment and Mate
|
$120.59
|
+1.24
1.04% |
$121.09
|
2,670,059
172.93% of 50 DAV
50 DAV is 1,544,000
|
$122.37
-1.45%
|
10/21/2020
|
$92.22
|
PP = $93.54
|
|
MB = $98.22
|
Most Recent Note - 12/15/2020 5:48:35 PM
G - Posted a gain today with average volume for a new all-time high. Support to watch on pullbacks is its 50 DMA line ($99.75) and prior highs in the $93 area.
>>> FEATURED STOCK ARTICLE : Stubbornly Holding Ground and Rising for a New High - 12/7/2020 |
View all notes |
Set NEW NOTE alert |
Company Profile |
SEC
News |
Chart |
Request a new note
C
A
S
I |
AMRC
-
NYSE
Ameresco Inc Cl A
ENERGY - Alternative
|
$49.93
|
+0.88
1.79% |
$51.11
|
618,774
171.88% of 50 DAV
50 DAV is 360,000
|
$49.10
1.69%
|
12/15/2020
|
$46.72
|
PP = $47.10
|
|
MB = $49.46
|
Most Recent Note - 12/17/2020 4:58:47 PM
Y - Posted a big gain today with near average volume for another new all-time high. Finished strong after highlighted in yellow with pivot point cited based on its 11/24/20 high plus 10 cents in the 12/15/20 mid-day report. Tested its 50 DMA line ($42.40) last week and found prompt support. Reported earnings +111% on +33% sales revenues for the Sep '20 quarter versus the year ago period. Three of the 4 latest quarterly comparisons were above the +25% minimum earnings guideline (C criteria) with solid sales revenues growth. Annual earnings (A criteria) history has been good.
>>> FEATURED STOCK ARTICLE : Gain From Ascending Base Pattern Backed by Above Average Volume - 12/15/2020 |
View all notes |
Set NEW NOTE alert |
Company Profile |
SEC
News |
Chart |
Request a new note
C
A
S
I |
TREX
-
NYSE
Trex Company Inc
MATERIALS and CONSTRUCTION - General Building Materials
|
$83.88
|
+1.38
1.67% |
$84.14
|
1,420,287
191.41% of 50 DAV
50 DAV is 742,000
|
$84.50
-0.73%
|
6/26/2020
|
$54.53
|
PP = $66.47
|
|
MB = $69.79
|
Most Recent Note - 12/15/2020 5:41:40 PM
G - Hit a new 52-week high with today's 7th consecutive gain backed by +20% above average volume. Its 50 DMA line ($74.98) defines near-term support. Recently noted that it reported Sep '20 quarterly earnings +14% on +19% sales revenues versus the year ago period, below the +25% minimum guideline (C criteria) raising fundamental concerns.
>>> FEATURED STOCK ARTICLE : Consolidating Back Above 50-Day Moving Average Line - 12/1/2020 |
View all notes |
Set NEW NOTE alert |
Company Profile |
SEC
News |
Chart |
Request a new note
C
A
S
I |
Symbol/Exchange
Company Name
Industry Group |
PRICE |
CHANGE
(%Change) |
Day High |
Volume
(% DAV)
(% 50 day avg vol) |
52 Wk Hi
% From Hi |
Featured
Date |
Price
Featured |
Pivot Featured |
|
Max Buy |
CLFD
-
NASDAQ
Clearfield Inc
TELECOMMUNICATIONS - Cables / Satalite Equipment
|
$25.05
|
-1.26
-4.79% |
$26.80
|
109,701
108.61% of 50 DAV
50 DAV is 101,000
|
$28.32
-11.55%
|
11/17/2020
|
$22.06
|
PP = $26.07
|
|
MB = $27.37
|
Most Recent Note - 12/17/2020 5:01:14 PM
Y - Posted a big gain today with +72% above average volume, rising back above the pivot point. Near term support is defined by its 50 DMA line ($23.26) and an upward trendline.
>>> FEATURED STOCK ARTICLE : Perched Near Pivot Point in Need of Confirming Gain on Volume - 12/10/2020 |
View all notes |
Set NEW NOTE alert |
Company Profile |
SEC
News |
Chart |
Request a new note
C
A
S
I |
NOW
-
NYSE
Servicenow Inc
Computer Sftwr-Enterprse
|
$565.43
|
+11.36
2.05% |
$566.74
|
2,143,398
162.87% of 50 DAV
50 DAV is 1,316,000
|
$558.34
1.27%
|
8/20/2020
|
$453.34
|
PP = $454.79
|
|
MB = $477.53
|
Most Recent Note - 12/17/2020 5:22:16 PM
G - Posted a quiet gain today for a new all-time high. Found prompt support near its 50 DMA line and stubbornly held its ground in recent weeks. Recently reported Sep '20 quarterly earnings +22% on +30% sales revenues versus the year ago period, below the +25% minimum guideline (C criteria) of the fact-based investment system. See the latest FSU analysis for more details and a new annotated graph.
>>> FEATURED STOCK ARTICLE : Hit New Record High With Light Volume Behind Gain - 12/17/2020 |
View all notes |
Set NEW NOTE alert |
Company Profile |
SEC
News |
Chart |
Request a new note
C
A
S
I |
ALRM
-
NASDAQ
Alarm.com Holdings Inc
Security/Sfty
|
$93.54
|
+3.09
3.42% |
$93.91
|
861,151
239.21% of 50 DAV
50 DAV is 360,000
|
$90.56
3.29%
|
11/6/2020
|
$71.88
|
PP = $74.76
|
|
MB = $78.50
|
Most Recent Note - 12/17/2020 5:12:58 PM
G - Powered to yet another new all-time high with today's 4th consecutive gain. Prior high ($74.66 on 7/23/20) defnes initial support to watch above its 50 DMA line ($69.05).
>>> FEATURED STOCK ARTICLE : Alarm Hits a New Record High - 12/4/2020 |
View all notes |
Set NEW NOTE alert |
Company Profile |
SEC
News |
Chart |
Request a new note
C
A
S
I |
TEAM
-
NASDAQ
Atlassian Corp Plc Cl A
Comp Sftwr-Spec Enterprs
|
$247.78
|
-0.27
-0.11% |
$249.99
|
5,160,838
267.26% of 50 DAV
50 DAV is 1,931,000
|
$250.03
-0.90%
|
10/12/2020
|
$193.77
|
PP = $199.60
|
|
MB = $209.58
|
 Most Recent Note - 12/18/2020 5:11:51 PM
G - Extended from any sound base, it paused today after 6 consecutive gains for new 52-week highs. Showed resilience and strength after earnings rose +7% on +26% sales revenues for the Sep '20 quarter versus the year ago period, below the +25% minimum earnings guideline (C criteria), raising concerns. See the latest FSU analysis for more details and a new annotated graph.
>>> FEATURED STOCK ARTICLE : Extended From Any Base After Streak of Gains for New Highs - 12/18/2020 |
View all notes |
Set NEW NOTE alert |
Company Profile |
SEC
News |
Chart |
Request a new note
C
A
S
I |
SHOP
-
NYSE
Shopify Inc Cl A
Computer Sftwr-Enterprse
|
$1,170.96
|
-9.04
-0.77% |
$1,184.23
|
1,109,894
75.76% of 50 DAV
50 DAV is 1,465,000
|
$1,206.90
-2.98%
|
12/16/2020
|
$1,146.00
|
PP = $1,147.01
|
|
MB = $1,204.36
|
Most Recent Note - 12/17/2020 12:40:30 PM
Y - Rose near its "max buy" level with today's early gain backed by abve average volume. Finished strong after highlighted in yellow with pivot point cited based on its 9/01/20 high plus 10 cents in the prior mid-day report. Hit a new all-time high with a big gain backed by +117% above average volume while while rising from a 15-week base. The gain and strong close above its pivot point helped clinch a convincing technical buy signal. Its 50 DMA line ($1,024) defines near-term support to watch above its 200 DMA line ($855). Reported Sep '20 quarterly earnings of $1.13 per share versus a loss of 29 cents per share on +96% sales revenues versus the year ago period. The Ontario, Canada-based Computer Software - Enterprise firm's prior quarters showed big earnings increases well above the +25% minimum guideline (C criteria) with very strong underlying sales revenues growth. After years of losses it had strong earnings growth in FY '17-19 (A criteria). See the latest FSU analysis for more details and an annotated graph.
>>> FEATURED STOCK ARTICLE : Volume-Driven Gain for New High After Long Consolidation - 12/16/2020 |
View all notes |
Set NEW NOTE alert |
Company Profile |
SEC
News |
Chart |
Request a new note
C
A
S
I |
Symbol/Exchange
Company Name
Industry Group |
PRICE |
CHANGE
(%Change) |
Day High |
Volume
(% DAV)
(% 50 day avg vol) |
52 Wk Hi
% From Hi |
Featured
Date |
Price
Featured |
Pivot Featured |
|
Max Buy |
YETI
-
NYSE
Yeti Holdings Inc
Leisure-Products
|
$72.37
|
+0.40
0.56% |
$73.74
|
1,162,117
94.02% of 50 DAV
50 DAV is 1,236,000
|
$74.66
-3.07%
|
11/5/2020
|
$57.25
|
PP = $55.14
|
|
MB = $57.90
|
Most Recent Note - 12/17/2020 4:56:03 PM
G - Pulled back today with lighter volume after recently wedgiing to new all-time highs. Its 50 DMA line ($58.15) and prior highs in the $55-54 area define important near-term support to watch on pullbacks.
>>> FEATURED STOCK ARTICLE : Volume Totals Cooloing While Stubbornly Holding Ground at High - 12/2/2020 |
View all notes |
Set NEW NOTE alert |
Company Profile |
SEC
News |
Chart |
Request a new note
C
A
S
I |
AAXN
-
NASDAQ
Axon Enterprise Inc
Security/Sfty
|
$125.34
|
+4.59
3.80% |
$125.80
|
998,423
187.67% of 50 DAV
50 DAV is 532,000
|
$130.41
-3.89%
|
11/6/2020
|
$122.75
|
PP = $113.00
|
|
MB = $118.65
|
Most Recent Note - 12/16/2020 12:16:52 PM
G - Abruptly retreating today after early gains this week with above average volume challenged its all-time high. Its 50 DMA line ($114.21) defines near term support to watch on pullbacks. Recently reported Sep '20 quarterly earnings +43% on +27% sales revenues versus the year ago period.
>>> FEATURED STOCK ARTICLE : Volume Totals Cooling While Hovering Near All-Time High - 12/3/2020 |
View all notes |
Set NEW NOTE alert |
Company Profile |
SEC
News |
Chart |
Request a new note
C
A
S
I |
QTWO
-
NYSE
Q2 Holdings Inc
Computer Sftwr-Financial
|
$123.95
|
+0.97
0.79% |
$124.62
|
773,046
181.89% of 50 DAV
50 DAV is 425,000
|
$123.00
0.77%
|
11/12/2020
|
$105.14
|
PP = $106.54
|
|
MB = $111.87
|
Most Recent Note - 12/17/2020 5:11:25 PM
G - Posted a solid gain today with average volume hitting another new all-time high. Prior high in the $106 area and its 50 DMA line ($105.52) define important near term suport to watch on pullbacks.
>>> FEATURED STOCK ARTICLE : Computer Software - Financial Firm Hovering Near Record High - 12/8/2020 |
View all notes |
Set NEW NOTE alert |
Company Profile |
SEC
News |
Chart |
Request a new note
C
A
S
I |
|
|
|
THESE ARE NOT BUY RECOMMENDATIONS!
Comments contained in the body of this report are technical
opinions only. The material herein has been obtained
from sources believed to be reliable and accurate, however,
its accuracy and completeness cannot be guaranteed.
This site is not an investment advisor, hence it does
not endorse or recommend any securities or other investments.
Any recommendation contained in this report may not
be suitable for all investors and it is not to be deemed
an offer or solicitation on our part with respect to
the purchase or sale of any securities. All trademarks,
service marks and trade names appearing in this report
are the property of their respective owners, and are
likewise used for identification purposes only.
This report is a service available
only to active Paid Premium Members.
You may opt-out of receiving report notifications
at any time. Questions or comments may be submitted
by writing to Premium Membership Services 665 S.E. 10 Street, Suite 201 Deerfield Beach, FL 33441-5634 or by calling 1-800-965-8307
or 954-785-1121.
|
|
|