You are not logged in.
This means you
CAN ONLY VIEW reports that were published prior to Tuesday, March 25, 2025.
You
MUST UPGRADE YOUR MEMBERSHIP if you want to see any current reports.
AFTER MARKET UPDATE - TUESDAY, DECEMBER 15TH, 2020
Previous After Market Report Next After Market Report >>>
|
|
|
|
DOW |
+337.76 |
30,199.31 |
+1.13% |
|
Volume |
923,658,332 |
-10% |
|
Volume |
4,325,915,200 |
-2% |
|
NASDAQ |
+153.40 |
12,593.44 |
+1.23% |
|
Advancers |
2,346 |
75% |
|
Advancers |
2,529 |
69% |
|
S&P 500 |
+47.13 |
3,694.62 |
+1.29% |
|
Decliners |
761 |
24% |
|
Decliners |
1,121 |
31% |
|
Russell 2000 |
+45.91 |
1,959.76 |
+2.40% |
|
52 Wk Highs |
156 |
|
|
52 Wk Highs |
295 |
|
|
S&P 600 |
+28.62 |
1,111.67 |
+2.64% |
|
52 Wk Lows |
5 |
|
|
52 Wk Lows |
20 |
|
|
 |
Breadth Positive While Major Indices Rose on Lighter Volume
Kenneth J. Gruneisen - Passed the CAN SLIM® Master's Exam
The S&P 500 snapped a four-day losing streak with a 1.3% rally. The Dow jumped 337 points, while the Nasdaq Composite climbed 1.3%. Tuesday's volume totals were lighter than the prior session on the NYSE and on the Nasdaq exchange. Breadth was positive as advancers led decliners by more than a 3-1 margin on the NYSE and by more than 2-1 on the Nasdaq exchange. There were 72 high-ranked companies from the Leaders List that hit new 52-week highs and were listed on the BreakOuts Page, versus the total of 68 on the prior session. New 52-week highs totals contracted yet still solidly outnumbered new 52-week lows totals on both exchanges. The major indices are in a confirmed uptrend (M criteria). Investors are reminded to always make buying and selling decisions based based on the strict criteria and rules of the fact-based investment system. 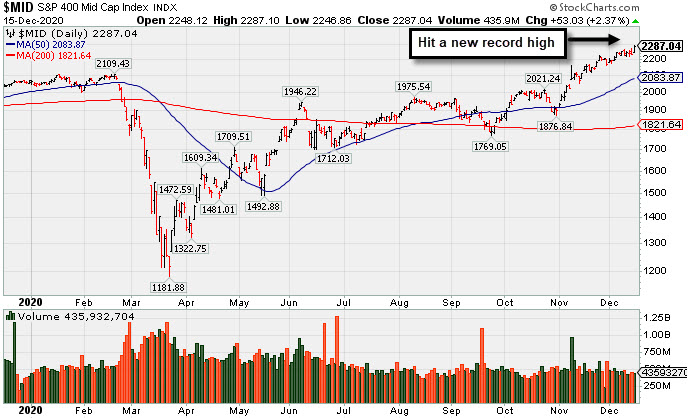 PICTURED: The S&P 400 Mid Cap Index hit a new record high.
Stocks finished firmly higher on Tuesday, as investors digested negotiations on Capitol Hill and weighed COVID concerns against vaccine optimism. Stimulus talks provided a source of optimism. The top four Congressional leaders were reportedly meeting later in the afternoon to discuss a bipartisan $748 billion spending package that avoids key issues of contention such as liability protection and state and local aid. Meanwhile, briefing documents showed FDA officials endorsed the safety and efficacy of Moderna’s coronavirus vaccine candidate ahead of an advisory committee vote on Thursday. If approved, it would become the second COVID vaccine to be granted emergency use authorization.
All 11 S&P 500 sectors ended higher, with nine groups rising more than 1%. Energy was a notable outperformer as WTI crude added 1.3% to $47.58/barrel. In corporate news, Eli Lilly climbed 6% after announcing it would buy Prevail Therapeutics in a deal potentially worth $1 billion. Apple rose 5% after a report said the company is planning to increase iPhone production by 30% in the first half of 2021.
On the data front, a release showed manufacturing activity in the New York Fed region grew at a slower pace in December compared to the prior month. Another update revealed industrial production rose 0.4% in November, slowing from a 0.9% uptick in October. Treasuries weakened, with the yield on the 10-year note adding two basis points to 0.91%. Meanwhile, gold rallied 1.4% to $1853.60/ounce as the U.S. dollar index fell 0.3%. |
 Kenneth J. Gruneisen started out as a licensed stockbroker in August 1987, a couple of months prior to the historic stock market crash that took the Dow Jones Industrial Average down -22.6% in a single day. He has published daily fact-based fundamental and technical analysis on high-ranked stocks online for two decades. Through FACTBASEDINVESTING.COM, Kenneth provides educational articles, news, market commentary, and other information regarding proven investment systems that work in good times and bad.
Comments contained in the body of this report are technical opinions only and are not necessarily those of Gruneisen Growth Corp. The material herein has been obtained from sources believed to be reliable and accurate, however, its accuracy and completeness cannot be guaranteed. Our firm, employees, and customers may effect transactions, including transactions contrary to any recommendation herein, or have positions in the securities mentioned herein or options with respect thereto. Any recommendation contained in this report may not be suitable for all investors and it is not to be deemed an offer or solicitation on our part with respect to the purchase or sale of any securities. |
|
 |
Financial, Retail, Tech, and Commodity-Linked Groups Rose
Kenneth J. Gruneisen - Passed the CAN SLIM® Master's Exam
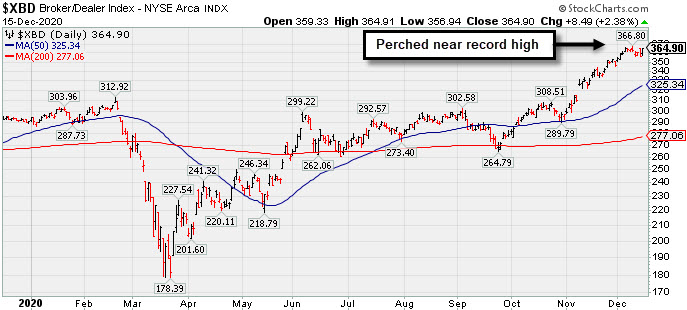
The Broker/Dealer Index ($XBD +2.38%) and Bank Index ($BKX +1.84%) both outpaced the Retail Index ($RLX +0.81%) on Tuesday's positive session. The tech sector saw the Semiconductor Index ($SOX +1.42%), Networking Index ($NWX +1.57%), and Biotech Index ($BTK +1.07%) all on the rise. Commodity-linked groups had a particularly strong positive bias as the Gold & Silver Index ($XAU +3.58%), Oil Services Index ($OSX +3.41%), and the Integrated Oil Index ($XOI +2.01%) posted unanimous gains.
PICTURED: The Broker/Dealer Index ($XBD +2.38%) is perched near its record high.
| Oil Services |
$OSX |
46.41 |
+1.53 |
+3.41% |
-40.72% |
| Integrated Oil |
$XOI |
825.29 |
+16.26 |
+2.01% |
-35.04% |
| Semiconductor |
$SOX |
2,774.98 |
+38.73 |
+1.42% |
+50.03% |
| Networking |
$NWX |
687.72 |
+10.64 |
+1.57% |
+17.88% |
| Broker/Dealer |
$XBD |
364.91 |
+8.49 |
+2.38% |
+25.66% |
| Retail |
$RLX |
3,493.53 |
+28.12 |
+0.81% |
+42.64% |
| Gold & Silver |
$XAU |
140.20 |
+4.85 |
+3.58% |
+31.12% |
| Bank |
$BKX |
94.43 |
+1.71 |
+1.84% |
-16.70% |
| Biotech |
$BTK |
5,793.20 |
+61.35 |
+1.07% |
+14.32% |
|
|
|
 |
Gain From Ascending Base Pattern Backed by Above Average Volume
Kenneth J. Gruneisen - Passed the CAN SLIM® Master's Exam
Ameresco Inc Cl A (AMRC +$3.05 or +6.85% to $47.59) was highlighted in yellow with pivot point cited based on its 11/24/20 high plus 10 cents in the earlier mid-day report (read here). It hit a new all-time high with +43% above average volume behind today's 4th consecutive gain, rising from an advanced "ascending base" pattern. The gain and close above the pivot point backed by at least +40% above averge volume clinched a new technical buy signal. The share price tested its 50-day moving average (DMA) line ($41.93) last week and it found prompt support.
AMRC reported earnings +111% on +33% sales revenues for the Sep '20 quarter versus the year ago period. Three of the 4 latest quarterly comparisons were above the +25% minimum earnings guideline (C criteria) with solid sales revenues growth. Its annual earnings (A criteria) history has been good and it has a 94 Earnings Per Share Rating, well above the 80+ minimum for buy candidates.
The ENERGY - Alternative group currently has 95 Group Relative Strength Rating (L criteria). It has only 21.2 million shares in the public float (S criteria) which can contribute to great price volatility in the event of institutional buying or selling. The number of top-rated funds owning its shares rose from 199 in Dec '19 to 278 in Sep '20, a reassuring sign concerning the I criteria. Its current Up/Down Volume Ratio of 2.2 is an unbiased indication its shares have been under accumulation over the past 50 days.
|
|
|
Color Codes Explained :
Y - Better candidates highlighted by our
staff of experts.
G - Previously featured
in past reports as yellow but may no longer be buyable under the
guidelines.
***Last / Change / Volume data in this table is the closing quote data***
Symbol/Exchange
Company Name
Industry Group |
PRICE |
CHANGE
(%Change) |
Day High |
Volume
(% DAV)
(% 50 day avg vol) |
52 Wk Hi
% From Hi |
Featured
Date |
Price
Featured |
Pivot Featured |
|
Max Buy |
 CRL
-
NYSE
CRL
-
NYSE
Charles River Labs Intl
DRUGS - Biotechnology
|
$243.08
|
+3.01
1.25% |
$243.12
|
320,019
102.24% of 50 DAV
50 DAV is 313,000
|
$257.88
-5.74%
|
7/15/2020
|
$192.66
|
PP = $189.95
|
|
MB = $199.45
|
Most Recent Note - 12/14/2020 4:55:53 PM
G - Still consolidating above its 50 DMA line ($236) which has been acting as support. Reported Sep '20 quarterly earnings +38% on +11% sales revenues versus the year ago period, above the +25% minimum earnings guideline (C criteria). See the latest FSU analysis for more details and a new annotated graph.
>>> FEATURED STOCK ARTICLE : CRL Consolidating Above 50-Day Moving Average Line - 12/14/2020 |
View all notes |
Set NEW NOTE alert |
Company Profile |
SEC
News |
Chart |
Request a new note
C
A
S
I |
AMD
-
NASDAQ
Advanced Micro Devices
ELECTRONICS - Semiconductor - Broad Line
|
$97.12
|
+2.34
2.47% |
$97.98
|
56,936,764
117.76% of 50 DAV
50 DAV is 48,350,000
|
$96.37
0.78%
|
11/18/2020
|
$82.54
|
PP = $88.72
|
|
MB = $93.16
|
 Most Recent Note - 12/15/2020 5:44:34 PM
G - Hit a new all-time high with today's gain backed by +17% above average volume, getting more extended from the previously noted "double bottom" base. Its 50 DMA line ($84.89) defines important near term support to watch on pullbacks.
>>> FEATURED STOCK ARTICLE : Volume Heavy Behind AMD's Breakout from Double Bottom Base - 11/30/2020 |
View all notes |
Set NEW NOTE alert |
Company Profile |
SEC
News |
Chart |
Request a new note
C
A
S
I |
TER
-
NASDAQ
Teradyne Inc
ELECTRONICS - Semiconductor Equipment and Mate
|
$120.44
|
+3.26
2.78% |
$120.76
|
1,515,146
99.55% of 50 DAV
50 DAV is 1,522,000
|
$118.96
1.24%
|
10/21/2020
|
$92.22
|
PP = $93.54
|
|
MB = $98.22
|
Most Recent Note - 12/15/2020 5:48:35 PM
G - Posted a gain today with average volume for a new all-time high. Support to watch on pullbacks is its 50 DMA line ($99.75) and prior highs in the $93 area.
>>> FEATURED STOCK ARTICLE : Stubbornly Holding Ground and Rising for a New High - 12/7/2020 |
View all notes |
Set NEW NOTE alert |
Company Profile |
SEC
News |
Chart |
Request a new note
C
A
S
I |
AMRC
-
NYSE
Ameresco Inc Cl A
ENERGY - Alternative
|
$47.59
|
+3.05
6.85% |
$47.97
|
525,142
148.35% of 50 DAV
50 DAV is 354,000
|
$47.00
1.26%
|
12/15/2020
|
$46.72
|
PP = $47.10
|
|
MB = $49.46
|
Most Recent Note - 12/15/2020 5:47:00 PM
Y - Finished strong after highlighted in yellow with pivot point cited based on its 11/24/20 high plus 10 cents in the earlier mid-day report. It hit a new all-time high with +43% above average volume behind today's 4th consecutive gain, rising from an advanced "ascending base" pattern triggering a technical buy signal. Tested its 50 DMA line ($41.93) last week and found prompt support. Reported earnings +111% on +33% sales revenues for the Sep '20 quarter versus the year ago period. Three of the 4 latest quarterly comparisons were above the +25% minimum earnings guideline (C criteria) with solid sales revenues growth. Annual earnings (A criteria) history has been good. See the latest FSU analysis for more details and a new annotated graph.
>>> FEATURED STOCK ARTICLE : Gain From Ascending Base Pattern Backed by Above Average Volume - 12/15/2020 |
View all notes |
Set NEW NOTE alert |
Company Profile |
SEC
News |
Chart |
Request a new note
C
A
S
I |
TREX
-
NYSE
Trex Company Inc
MATERIALS and CONSTRUCTION - General Building Materials
|
$82.97
|
+3.32
4.17% |
$83.51
|
893,373
120.73% of 50 DAV
50 DAV is 740,000
|
$81.23
2.14%
|
6/26/2020
|
$54.53
|
PP = $66.47
|
|
MB = $69.79
|
Most Recent Note - 12/15/2020 5:41:40 PM
G - Hit a new 52-week high with today's 7th consecutive gain backed by +20% above average volume. Its 50 DMA line ($74.98) defines near-term support. Recently noted that it reported Sep '20 quarterly earnings +14% on +19% sales revenues versus the year ago period, below the +25% minimum guideline (C criteria) raising fundamental concerns.
>>> FEATURED STOCK ARTICLE : Consolidating Back Above 50-Day Moving Average Line - 12/1/2020 |
View all notes |
Set NEW NOTE alert |
Company Profile |
SEC
News |
Chart |
Request a new note
C
A
S
I |
Symbol/Exchange
Company Name
Industry Group |
PRICE |
CHANGE
(%Change) |
Day High |
Volume
(% DAV)
(% 50 day avg vol) |
52 Wk Hi
% From Hi |
Featured
Date |
Price
Featured |
Pivot Featured |
|
Max Buy |
CLFD
-
NASDAQ
Clearfield Inc
TELECOMMUNICATIONS - Cables / Satalite Equipment
|
$25.40
|
-1.03
-3.90% |
$27.23
|
98,984
102.05% of 50 DAV
50 DAV is 97,000
|
$28.32
-10.31%
|
11/17/2020
|
$22.06
|
PP = $26.07
|
|
MB = $27.37
|
Most Recent Note - 12/15/2020 5:40:06 PM
Y - Pulled back from its 52-week high with a loss today on average volume but slumped to a close back below the pivot point raising some concerns. Near term support is defined by its 50 DMA line ($23.15) and an upward trendline.
>>> FEATURED STOCK ARTICLE : Perched Near Pivot Point in Need of Confirming Gain on Volume - 12/10/2020 |
View all notes |
Set NEW NOTE alert |
Company Profile |
SEC
News |
Chart |
Request a new note
C
A
S
I |
NOW
-
NYSE
Servicenow Inc
Computer Sftwr-Enterprse
|
$527.38
|
-5.10
-0.96% |
$535.11
|
1,050,071
80.53% of 50 DAV
50 DAV is 1,304,000
|
$545.00
-3.23%
|
8/20/2020
|
$453.34
|
PP = $454.79
|
|
MB = $477.53
|
Most Recent Note - 12/14/2020 4:57:57 PM
G - Holding its ground stubbornly near its all-time high after finding prompt support near its 50 DMA line. Recently reported Sep '20 quarterly earnings +22% on +30% sales revenues versus the year ago period, below the +25% minimum guideline (C criteria) of the fact-based investment system.
>>> FEATURED STOCK ARTICLE : Consolidating Above 50-Day Average Still Perched Near All-Time High - 11/24/2020 |
View all notes |
Set NEW NOTE alert |
Company Profile |
SEC
News |
Chart |
Request a new note
C
A
S
I |
ALRM
-
NASDAQ
Alarm.com Holdings Inc
Security/Sfty
|
$83.31
|
+5.08
6.49% |
$83.34
|
457,618
134.20% of 50 DAV
50 DAV is 341,000
|
$80.99
2.86%
|
11/6/2020
|
$71.88
|
PP = $74.76
|
|
MB = $78.50
|
Most Recent Note - 12/15/2020 5:43:32 PM
G - Powered to a new all-time high with today's big gain backed by +33% above average volume. Prior high ($74.66 on 7/23/20) defnes initial support to watch above its 50 DMA line ($68).
>>> FEATURED STOCK ARTICLE : Alarm Hits a New Record High - 12/4/2020 |
View all notes |
Set NEW NOTE alert |
Company Profile |
SEC
News |
Chart |
Request a new note
C
A
S
I |
TEAM
-
NASDAQ
Atlassian Corp Plc Cl A
Comp Sftwr-Spec Enterprs
|
$237.70
|
+2.96
1.26% |
$238.16
|
1,713,738
90.53% of 50 DAV
50 DAV is 1,893,000
|
$240.70
-1.25%
|
10/12/2020
|
$193.77
|
PP = $199.60
|
|
MB = $209.58
|
Most Recent Note - 12/11/2020 5:02:22 PM
G - Extended from any sound base, it posted another gain with below average volume today for a best-ever close. Reported earnings +7% on +26% sales revenues for the Sep '20 quarter versus the year ago period, well below the +25% minimum earnings guideline (C criteria), raising concerns.
>>> FEATURED STOCK ARTICLE : Quiet Volume Behind Gain Today for a New All-Time High - 11/27/2020 |
View all notes |
Set NEW NOTE alert |
Company Profile |
SEC
News |
Chart |
Request a new note
C
A
S
I |
YETI
-
NYSE
Yeti Holdings Inc
Leisure-Products
|
$72.22
|
+1.41
1.99% |
$72.39
|
714,406
57.43% of 50 DAV
50 DAV is 1,244,000
|
$72.06
0.22%
|
11/5/2020
|
$57.25
|
PP = $55.14
|
|
MB = $57.90
|
Most Recent Note - 12/14/2020 5:05:18 PM
G - Posted a big gain today with lighter volume while hovering near its all-time high. Its 50 DMA line ($56.73) and prior highs in the $55-54 area define important near-term support to watch on pullbacks.
>>> FEATURED STOCK ARTICLE : Volume Totals Cooloing While Stubbornly Holding Ground at High - 12/2/2020 |
View all notes |
Set NEW NOTE alert |
Company Profile |
SEC
News |
Chart |
Request a new note
C
A
S
I |
Symbol/Exchange
Company Name
Industry Group |
PRICE |
CHANGE
(%Change) |
Day High |
Volume
(% DAV)
(% 50 day avg vol) |
52 Wk Hi
% From Hi |
Featured
Date |
Price
Featured |
Pivot Featured |
|
Max Buy |
AAXN
-
NASDAQ
Axon Enterprise Inc
Security/Sfty
|
$128.81
|
+1.57
1.23% |
$129.36
|
447,661
85.92% of 50 DAV
50 DAV is 521,000
|
$130.41
-1.23%
|
11/6/2020
|
$122.75
|
PP = $113.00
|
|
MB = $118.65
|
Most Recent Note - 12/14/2020 5:02:37 PM
G - Posted a gain today with above average volume challenging its all-time high. Its 50 DMA line ($112.91) defines near term support to watch on pullbacks. Recently reported Sep '20 quarterly earnings +43% on +27% sales revenues versus the year ago period.
>>> FEATURED STOCK ARTICLE : Volume Totals Cooling While Hovering Near All-Time High - 12/3/2020 |
View all notes |
Set NEW NOTE alert |
Company Profile |
SEC
News |
Chart |
Request a new note
C
A
S
I |
QTWO
-
NYSE
Q2 Holdings Inc
Computer Sftwr-Financial
|
$121.41
|
+1.32
1.10% |
$121.69
|
372,324
88.65% of 50 DAV
50 DAV is 420,000
|
$121.11
0.25%
|
11/12/2020
|
$105.14
|
PP = $106.54
|
|
MB = $111.87
|
Most Recent Note - 12/14/2020 4:59:00 PM
G - Posted a solid gain today with above average volume hitting a new all-time high. Prior high in the $106 area and its 50 DMA line ($104) define important near term suport to watch on pullbacks.
>>> FEATURED STOCK ARTICLE : Computer Software - Financial Firm Hovering Near Record High - 12/8/2020 |
View all notes |
Set NEW NOTE alert |
Company Profile |
SEC
News |
Chart |
Request a new note
C
A
S
I |
|
|
|
THESE ARE NOT BUY RECOMMENDATIONS!
Comments contained in the body of this report are technical
opinions only. The material herein has been obtained
from sources believed to be reliable and accurate, however,
its accuracy and completeness cannot be guaranteed.
This site is not an investment advisor, hence it does
not endorse or recommend any securities or other investments.
Any recommendation contained in this report may not
be suitable for all investors and it is not to be deemed
an offer or solicitation on our part with respect to
the purchase or sale of any securities. All trademarks,
service marks and trade names appearing in this report
are the property of their respective owners, and are
likewise used for identification purposes only.
This report is a service available
only to active Paid Premium Members.
You may opt-out of receiving report notifications
at any time. Questions or comments may be submitted
by writing to Premium Membership Services 665 S.E. 10 Street, Suite 201 Deerfield Beach, FL 33441-5634 or by calling 1-800-965-8307
or 954-785-1121.
|
|
|