You are not logged in.
This means you
CAN ONLY VIEW reports that were published prior to Saturday, April 12, 2025.
You
MUST UPGRADE YOUR MEMBERSHIP if you want to see any current reports.
AFTER MARKET UPDATE - MONDAY, DECEMBER 21ST, 2020
Previous After Market Report Next After Market Report >>>
|
|
|
|
DOW |
+37.40 |
30,216.45 |
+0.12% |
|
Volume |
1,144,802,871 |
-63% |
|
Volume |
5,091,868,300 |
-28% |
|
NASDAQ |
-15.41 |
12,740.23 |
-0.12% |
|
Advancers |
1,182 |
38% |
|
Advancers |
1,661 |
44% |
|
S&P 500 |
-14.49 |
3,694.92 |
-0.39% |
|
Decliners |
1,937 |
62% |
|
Decliners |
2,073 |
56% |
|
Russell 2000 |
+0.34 |
1,970.33 |
+0.02% |
|
52 Wk Highs |
177 |
|
|
52 Wk Highs |
241 |
|
|
S&P 600 |
-3.56 |
1,104.60 |
-0.32% |
|
52 Wk Lows |
6 |
|
|
52 Wk Lows |
20 |
|
|
 |
Major Indices Ended Mixed With Less Leadership
Kenneth J. Gruneisen - Passed the CAN SLIM® Master's Exam
The Dow reversed a more than 400 point decline to end the session 37 points higher, while the S&P 500 fell 0.4%. The Nasdaq Composite slipped 0.1%. Monday's volume totals were lighter than the prior session on the NYSE and on the Nasdaq exchange, down from Friday's totals which were inflated by options expirations. Breadth was negative as decliners led advancers by a 3-2 margin on the NYSE and 5-4 on the Nasdaq exchange. There were 48 high-ranked companies from the Leaders List that hit new 52-week highs and were listed on the BreakOuts Page, versus the total of 117 on the prior session. New 52-week highs totals contracted but still solidly outnumbered new 52-week lows. The major indices are in a confirmed uptrend (M criteria). Investors are reminded to always make buying and selling decisions based based on the strict criteria and rules of the fact-based investment system. 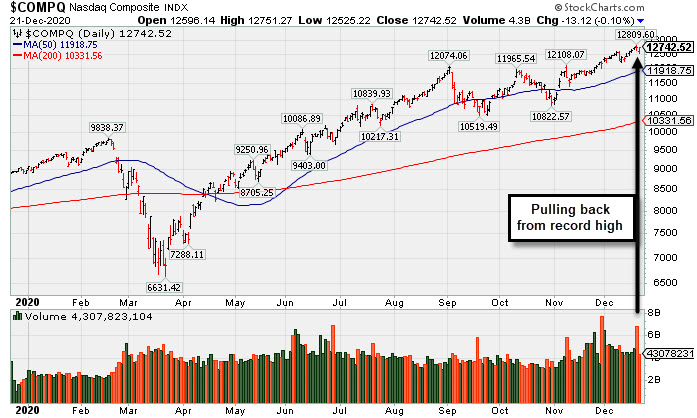 PICTURED: The Nasdaq Composite Index is pulling back from its record high.
Stocks finished mostly lower on Monday, but came off their worst levels as investors weighed worsening COVID trends against news lawmakers in Washington reached an agreement on a long-awaited fifth coronavirus relief package. Risk sentiment was dampened after the U.K. warned of a highly contagious strain of COVID-19, which inspired fresh lockdown measures and travel restrictions in Europe.
Nine of 11 S&P 500 sectors finished in negative territory, with the Financials and Technology groups bucking the downtrend. Banks outperformed with several major institutions announced stock buyback programs after the Fed indicated it would allow banks to repurchase shares again at the start of 2021. In other corporate news, Nike (NKE +4.91%) rose after the athletic-wear maker beat consensus profit and sales projections and raised its full year outlook. Elsewhere, Tesla (TSLA -6.49%) fell in the company’s first day of trading in the S&P 500.
On the data front, the lone release from the Chicago Fed showed a gauge of national economic activity weakened in November. Treasuries advanced, with the yield on the 10-year note off one basis point to 0.93%. In commodities, WTI crude slid 2.8% to $47.74/barrel after gaining for a seventh consecutive week. Gold dipped 0.4% to $1,877.60/ounce amid a stronger dollar. Elsewhere in FOREX trading, the British pound slumped 0.6% against the greenback as Brexit trade negotiations reach an impasse ahead of a December 31 deadline. |
 Kenneth J. Gruneisen started out as a licensed stockbroker in August 1987, a couple of months prior to the historic stock market crash that took the Dow Jones Industrial Average down -22.6% in a single day. He has published daily fact-based fundamental and technical analysis on high-ranked stocks online for two decades. Through FACTBASEDINVESTING.COM, Kenneth provides educational articles, news, market commentary, and other information regarding proven investment systems that work in good times and bad.
Comments contained in the body of this report are technical opinions only and are not necessarily those of Gruneisen Growth Corp. The material herein has been obtained from sources believed to be reliable and accurate, however, its accuracy and completeness cannot be guaranteed. Our firm, employees, and customers may effect transactions, including transactions contrary to any recommendation herein, or have positions in the securities mentioned herein or options with respect thereto. Any recommendation contained in this report may not be suitable for all investors and it is not to be deemed an offer or solicitation on our part with respect to the purchase or sale of any securities. |
|
 |
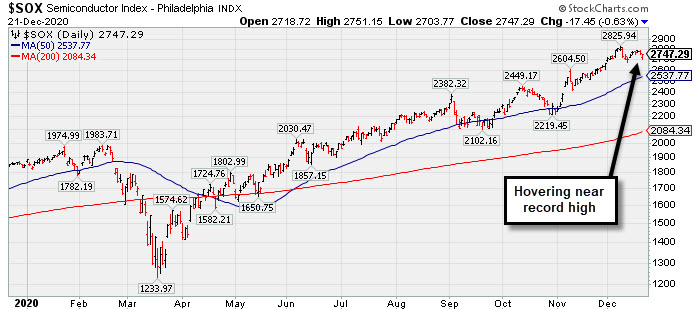
Financial Indexes Rose and Energy Indexes Fell
Kenneth J. Gruneisen - Passed the CAN SLIM® Master's Exam
The Bank Index ($BKX +1.80%) outpaced the Broker/Dealer Index ($XBD +0.69%). The Retail Index ($RLX +0.01%) finished flat. The Semiconductor Index ($SOX -0.75%) and Networking Index ($NWX -1.06%) both lost ground while the Biotech Index ($BTK +0.33%) edged lower. The Oil Services Index ($OSX -2.53%) and Integrated Oil Index ($XOI -2.35%) both lost ground. The Gold & Silver Index ($XAU +0.30%) edged higher.
PICTURED: The Semiconductor Index ($SOX -0.75%) is hovering near its record high.
| Oil Services |
$OSX |
43.75 |
-1.14 |
-2.53% |
-44.11% |
| Integrated Oil |
$XOI |
785.19 |
-18.91 |
-2.35% |
-38.20% |
| Semiconductor |
$SOX |
2,743.91 |
-20.83 |
-0.75% |
+48.35% |
| Networking |
$NWX |
706.90 |
-7.59 |
-1.06% |
+21.17% |
| Broker/Dealer |
$XBD |
372.66 |
+2.56 |
+0.69% |
+28.34% |
| Retail |
$RLX |
3,531.91 |
+0.22 |
+0.01% |
+44.20% |
| Gold & Silver |
$XAU |
145.34 |
+0.44 |
+0.30% |
+35.94% |
| Bank |
$BKX |
95.18 |
+1.68 |
+1.80% |
-16.04% |
| Biotech |
$BTK |
5,938.09 |
+19.66 |
+0.33% |
+17.18% |
|
|
|
 |
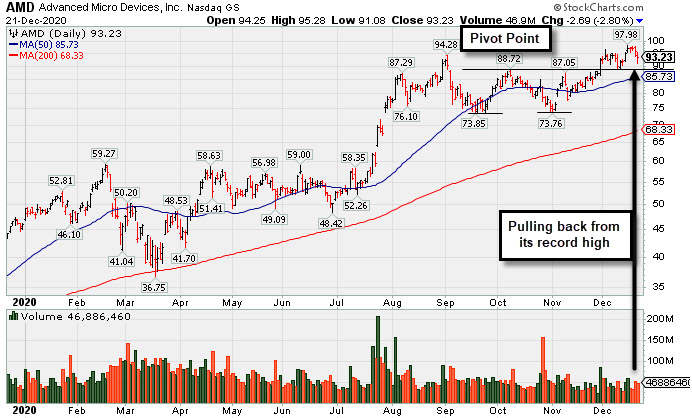
Pulling Back From its Record High Hit Last Week
Kenneth J. Gruneisen - Passed the CAN SLIM® Master's Exam
Advanced Micro Devices (AMD -$2.69 or -2.80% to $93.23) pulled back from its all-time high with 4th consecutive loss, slumping near its "max buy" level. Recently it rose from the previously noted "double bottom" base. Its 50-day moving average (DMA) line ($85.73) defines important near term support to watch.
It reported earnings +128% on +56% sales revenues for the Sep '20 quarter versus the year ago period and announced plans to acquire Xilinx Inc (XLNX). The 5 latest quarterly comparisons through Sep '20 showed very strong earnings increases w ell above the +25% minimum guideline (C criteria) with strong underlying sales revenues growth versus the year ago periods. Annual earnings growth (A criteria) has been very strong after losses in FY '15 and '16. it has a highest possible 99 Earnings Per Share Rating.
AMD hails from the Electronics - Semiconductor Fabless industry which has a Group Relative Strength Rating of 77 (L criteria). It has a large supply of 1.20 billion shares outstanding (S criteria), which makes it less likely to be a quick sprinter. However, the number of top-rated funds owning its shares rose from 1,669 in Jun '19 to 2,364 in Sep '20, a reassuring sign concerning the I criteria. Its current Up/Down Volume Ratio of 1.0 is an unbiased indication its shares have been neutral concerning accumulation/distribution over the past 50 days. It has a Timeliness Rating of B, a Sponsorship Rating of B, and an Accumulation/Distribution rating of B.
|
|
|
Color Codes Explained :
Y - Better candidates highlighted by our
staff of experts.
G - Previously featured
in past reports as yellow but may no longer be buyable under the
guidelines.
***Last / Change / Volume data in this table is the closing quote data***
Symbol/Exchange
Company Name
Industry Group |
PRICE |
CHANGE
(%Change) |
Day High |
Volume
(% DAV)
(% 50 day avg vol) |
52 Wk Hi
% From Hi |
Featured
Date |
Price
Featured |
Pivot Featured |
|
Max Buy |
 CRL
-
NYSE
CRL
-
NYSE
Charles River Labs Intl
DRUGS - Biotechnology
|
$250.72
|
+1.75
0.70% |
$250.74
|
396,127
121.89% of 50 DAV
50 DAV is 325,000
|
$257.88
-2.78%
|
12/17/2020
|
$247.06
|
PP = $257.98
|
|
MB = $270.88
|
Most Recent Note - 12/17/2020 5:06:04 PM
Y - Posted a gain today with light volume. Color code is changed to yellow with new pivot point cited based on its 11/09/20 high plus 10 cents. Subsequent gans above its pivot point backed by at least +40% above average volume may trigger a new (or add-on) technical buy signal. Its 50 DMA line ($236) has been acting as support. Reported Sep '20 quarterly earnings +38% on +11% sales revenues versus the year ago period, above the +25% minimum earnings guideline (C criteria).
>>> FEATURED STOCK ARTICLE : CRL Consolidating Above 50-Day Moving Average Line - 12/14/2020 |
View all notes |
Set NEW NOTE alert |
Company Profile |
SEC
News |
Chart |
Request a new note
C
A
S
I |
AMD
-
NASDAQ
Advanced Micro Devices
ELECTRONICS - Semiconductor - Broad Line
|
$93.23
|
-2.69
-2.80% |
$95.28
|
46,904,441
97.86% of 50 DAV
50 DAV is 47,930,000
|
$97.98
-4.85%
|
11/18/2020
|
$82.54
|
PP = $88.72
|
|
MB = $93.16
|
 Most Recent Note - 12/21/2020 5:37:53 PM
G - Pulled back from its all-time high, slumping near its "max buy" level with average volume behind today's 4th consecutive loss. Its 50 DMA line ($85.73) defines important near term support to watch on pullbacks. See the latest FSU anaylsys for more details and a new annotated graph.
>>> FEATURED STOCK ARTICLE : Pulling Back From its Record High Hit Last Week - 12/21/2020 |
View all notes |
Set NEW NOTE alert |
Company Profile |
SEC
News |
Chart |
Request a new note
C
A
S
I |
TER
-
NASDAQ
Teradyne Inc
ELECTRONICS - Semiconductor Equipment and Mate
|
$119.73
|
-0.86
-0.71% |
$120.16
|
1,264,259
80.27% of 50 DAV
50 DAV is 1,575,000
|
$122.37
-2.16%
|
10/21/2020
|
$92.22
|
PP = $93.54
|
|
MB = $98.22
|
Most Recent Note - 12/21/2020 5:40:45 PM
G - Perched near its all-time high, stubbornly holding its ground. Support to watch on pullbacks is its 50 DMA line ($102.70).
>>> FEATURED STOCK ARTICLE : Stubbornly Holding Ground and Rising for a New High - 12/7/2020 |
View all notes |
Set NEW NOTE alert |
Company Profile |
SEC
News |
Chart |
Request a new note
C
A
S
I |
AMRC
-
NYSE
Ameresco Inc Cl A
ENERGY - Alternative
|
$51.10
|
+1.17
2.34% |
$51.10
|
359,394
97.93% of 50 DAV
50 DAV is 367,000
|
$51.11
-0.02%
|
12/15/2020
|
$46.72
|
PP = $47.10
|
|
MB = $49.46
|
Most Recent Note - 12/17/2020 4:58:47 PM
Y - Posted a big gain today with near average volume for another new all-time high. Finished strong after highlighted in yellow with pivot point cited based on its 11/24/20 high plus 10 cents in the 12/15/20 mid-day report. Tested its 50 DMA line ($42.40) last week and found prompt support. Reported earnings +111% on +33% sales revenues for the Sep '20 quarter versus the year ago period. Three of the 4 latest quarterly comparisons were above the +25% minimum earnings guideline (C criteria) with solid sales revenues growth. Annual earnings (A criteria) history has been good.
>>> FEATURED STOCK ARTICLE : Gain From Ascending Base Pattern Backed by Above Average Volume - 12/15/2020 |
View all notes |
Set NEW NOTE alert |
Company Profile |
SEC
News |
Chart |
Request a new note
C
A
S
I |
TREX
-
NYSE
Trex Company Inc
MATERIALS and CONSTRUCTION - General Building Materials
|
$84.81
|
+0.93
1.11% |
$85.50
|
648,685
84.91% of 50 DAV
50 DAV is 764,000
|
$84.50
0.37%
|
6/26/2020
|
$54.53
|
PP = $66.47
|
|
MB = $69.79
|
Most Recent Note - 12/21/2020 5:41:34 PM
G - Hit yet another new 52-week high with today's gain. Its 50 DMA line ($75.50) defines near-term support. Recently noted that it reported Sep '20 quarterly earnings +14% on +19% sales revenues versus the year ago period, below the +25% minimum guideline (C criteria) raising fundamental concerns.
>>> FEATURED STOCK ARTICLE : Consolidating Back Above 50-Day Moving Average Line - 12/1/2020 |
View all notes |
Set NEW NOTE alert |
Company Profile |
SEC
News |
Chart |
Request a new note
C
A
S
I |
Symbol/Exchange
Company Name
Industry Group |
PRICE |
CHANGE
(%Change) |
Day High |
Volume
(% DAV)
(% 50 day avg vol) |
52 Wk Hi
% From Hi |
Featured
Date |
Price
Featured |
Pivot Featured |
|
Max Buy |
CLFD
-
NASDAQ
Clearfield Inc
TELECOMMUNICATIONS - Cables / Satalite Equipment
|
$25.16
|
+0.11
0.44% |
$25.60
|
124,835
123.60% of 50 DAV
50 DAV is 101,000
|
$28.32
-11.16%
|
11/17/2020
|
$22.06
|
PP = $26.07
|
|
MB = $27.37
|
Most Recent Note - 12/17/2020 5:01:14 PM
Y - Posted a big gain today with +72% above average volume, rising back above the pivot point. Near term support is defined by its 50 DMA line ($23.26) and an upward trendline.
>>> FEATURED STOCK ARTICLE : Perched Near Pivot Point in Need of Confirming Gain on Volume - 12/10/2020 |
View all notes |
Set NEW NOTE alert |
Company Profile |
SEC
News |
Chart |
Request a new note
C
A
S
I |
NOW
-
NYSE
Servicenow Inc
Computer Sftwr-Enterprse
|
$550.82
|
-14.61
-2.58% |
$562.45
|
1,598,351
119.10% of 50 DAV
50 DAV is 1,342,000
|
$566.74
-2.81%
|
8/20/2020
|
$453.34
|
PP = $454.79
|
|
MB = $477.53
|
Most Recent Note - 12/17/2020 5:22:16 PM
G - Posted a quiet gain today for a new all-time high. Found prompt support near its 50 DMA line and stubbornly held its ground in recent weeks. Recently reported Sep '20 quarterly earnings +22% on +30% sales revenues versus the year ago period, below the +25% minimum guideline (C criteria) of the fact-based investment system. See the latest FSU analysis for more details and a new annotated graph.
>>> FEATURED STOCK ARTICLE : Hit New Record High With Light Volume Behind Gain - 12/17/2020 |
View all notes |
Set NEW NOTE alert |
Company Profile |
SEC
News |
Chart |
Request a new note
C
A
S
I |
ALRM
-
NASDAQ
Alarm.com Holdings Inc
Security/Sfty
|
$95.76
|
+2.22
2.37% |
$96.39
|
535,665
143.23% of 50 DAV
50 DAV is 374,000
|
$93.91
1.97%
|
11/6/2020
|
$71.88
|
PP = $74.76
|
|
MB = $78.50
|
Most Recent Note - 12/17/2020 5:12:58 PM
G - Powered to yet another new all-time high with today's 4th consecutive gain. Prior high ($74.66 on 7/23/20) defnes initial support to watch above its 50 DMA line ($69.05).
>>> FEATURED STOCK ARTICLE : Alarm Hits a New Record High - 12/4/2020 |
View all notes |
Set NEW NOTE alert |
Company Profile |
SEC
News |
Chart |
Request a new note
C
A
S
I |
TEAM
-
NASDAQ
Atlassian Corp Plc Cl A
Comp Sftwr-Spec Enterprs
|
$248.19
|
+0.41
0.17% |
$249.30
|
1,386,202
68.97% of 50 DAV
50 DAV is 2,010,000
|
$250.03
-0.74%
|
10/12/2020
|
$193.77
|
PP = $199.60
|
|
MB = $209.58
|
Most Recent Note - 12/18/2020 5:11:51 PM
G - Extended from any sound base, it paused today after 6 consecutive gains for new 52-week highs. Showed resilience and strength after earnings rose +7% on +26% sales revenues for the Sep '20 quarter versus the year ago period, below the +25% minimum earnings guideline (C criteria), raising concerns. See the latest FSU analysis for more details and a new annotated graph.
>>> FEATURED STOCK ARTICLE : Extended From Any Base After Streak of Gains for New Highs - 12/18/2020 |
View all notes |
Set NEW NOTE alert |
Company Profile |
SEC
News |
Chart |
Request a new note
C
A
S
I |
SHOP
-
NYSE
Shopify Inc Cl A
Computer Sftwr-Enterprse
|
$1,197.26
|
+26.30
2.25% |
$1,205.19
|
1,504,802
102.65% of 50 DAV
50 DAV is 1,466,000
|
$1,206.90
-0.80%
|
12/16/2020
|
$1,146.00
|
PP = $1,147.01
|
|
MB = $1,204.36
|
Most Recent Note - 12/17/2020 12:40:30 PM
Y - Rose near its "max buy" level with today's early gain backed by abve average volume. Finished strong after highlighted in yellow with pivot point cited based on its 9/01/20 high plus 10 cents in the prior mid-day report. Hit a new all-time high with a big gain backed by +117% above average volume while while rising from a 15-week base. The gain and strong close above its pivot point helped clinch a convincing technical buy signal. Its 50 DMA line ($1,024) defines near-term support to watch above its 200 DMA line ($855). Reported Sep '20 quarterly earnings of $1.13 per share versus a loss of 29 cents per share on +96% sales revenues versus the year ago period. The Ontario, Canada-based Computer Software - Enterprise firm's prior quarters showed big earnings increases well above the +25% minimum guideline (C criteria) with very strong underlying sales revenues growth. After years of losses it had strong earnings growth in FY '17-19 (A criteria). See the latest FSU analysis for more details and an annotated graph.
>>> FEATURED STOCK ARTICLE : Volume-Driven Gain for New High After Long Consolidation - 12/16/2020 |
View all notes |
Set NEW NOTE alert |
Company Profile |
SEC
News |
Chart |
Request a new note
C
A
S
I |
Symbol/Exchange
Company Name
Industry Group |
PRICE |
CHANGE
(%Change) |
Day High |
Volume
(% DAV)
(% 50 day avg vol) |
52 Wk Hi
% From Hi |
Featured
Date |
Price
Featured |
Pivot Featured |
|
Max Buy |
YETI
-
NYSE
Yeti Holdings Inc
Leisure-Products
|
$72.23
|
-0.14
-0.19% |
$73.09
|
475,672
38.27% of 50 DAV
50 DAV is 1,243,000
|
$74.66
-3.25%
|
11/5/2020
|
$57.25
|
PP = $55.14
|
|
MB = $57.90
|
Most Recent Note - 12/17/2020 4:56:03 PM
G - Pulled back today with lighter volume after recently wedgiing to new all-time highs. Its 50 DMA line ($58.15) and prior highs in the $55-54 area define important near-term support to watch on pullbacks.
>>> FEATURED STOCK ARTICLE : Volume Totals Cooloing While Stubbornly Holding Ground at High - 12/2/2020 |
View all notes |
Set NEW NOTE alert |
Company Profile |
SEC
News |
Chart |
Request a new note
C
A
S
I |
AAXN
-
NASDAQ
Axon Enterprise Inc
Security/Sfty
|
$127.87
|
+2.53
2.02% |
$128.23
|
538,633
98.83% of 50 DAV
50 DAV is 545,000
|
$130.41
-1.95%
|
11/6/2020
|
$122.75
|
PP = $113.00
|
|
MB = $118.65
|
Most Recent Note - 12/21/2020 5:39:23 PM
G - Posted a 3rd consecutive gain, rebounding near its all-time high. Its 50 DMA line ($115.82) defines near term support to watch on pullbacks. Recently reported Sep '20 quarterly earnings +43% on +27% sales revenues versus the year ago period.
>>> FEATURED STOCK ARTICLE : Volume Totals Cooling While Hovering Near All-Time High - 12/3/2020 |
View all notes |
Set NEW NOTE alert |
Company Profile |
SEC
News |
Chart |
Request a new note
C
A
S
I |
QTWO
-
NYSE
Q2 Holdings Inc
Computer Sftwr-Financial
|
$125.86
|
+1.91
1.54% |
$126.12
|
321,976
76.48% of 50 DAV
50 DAV is 421,000
|
$124.62
1.00%
|
11/12/2020
|
$105.14
|
PP = $106.54
|
|
MB = $111.87
|
Most Recent Note - 12/17/2020 5:11:25 PM
G - Posted a solid gain today with average volume hitting another new all-time high. Prior high in the $106 area and its 50 DMA line ($105.52) define important near term suport to watch on pullbacks.
>>> FEATURED STOCK ARTICLE : Computer Software - Financial Firm Hovering Near Record High - 12/8/2020 |
View all notes |
Set NEW NOTE alert |
Company Profile |
SEC
News |
Chart |
Request a new note
C
A
S
I |
|
|
|
THESE ARE NOT BUY RECOMMENDATIONS!
Comments contained in the body of this report are technical
opinions only. The material herein has been obtained
from sources believed to be reliable and accurate, however,
its accuracy and completeness cannot be guaranteed.
This site is not an investment advisor, hence it does
not endorse or recommend any securities or other investments.
Any recommendation contained in this report may not
be suitable for all investors and it is not to be deemed
an offer or solicitation on our part with respect to
the purchase or sale of any securities. All trademarks,
service marks and trade names appearing in this report
are the property of their respective owners, and are
likewise used for identification purposes only.
This report is a service available
only to active Paid Premium Members.
You may opt-out of receiving report notifications
at any time. Questions or comments may be submitted
by writing to Premium Membership Services 665 S.E. 10 Street, Suite 201 Deerfield Beach, FL 33441-5634 or by calling 1-800-965-8307
or 954-785-1121.
|
|
|