You are not logged in.
This means you
CAN ONLY VIEW reports that were published prior to Saturday, March 1, 2025.
You
MUST UPGRADE YOUR MEMBERSHIP if you want to see any current reports.
AFTER MARKET UPDATE - WEDNESDAY, DECEMBER 16TH, 2020
Previous After Market Report Next After Market Report >>>
|
|
|
|
DOW |
-44.77 |
30,154.54 |
-0.15% |
|
Volume |
953,274,495 |
+3% |
|
Volume |
4,505,860,700 |
+4% |
|
NASDAQ |
+60.09 |
12,655.15 |
+0.48% |
|
Advancers |
1,429 |
46% |
|
Advancers |
1,757 |
48% |
|
S&P 500 |
+6.55 |
3,701.17 |
+0.18% |
|
Decliners |
1,670 |
54% |
|
Decliners |
1,892 |
52% |
|
Russell 2000 |
-7.04 |
1,952.72 |
-0.36% |
|
52 Wk Highs |
188 |
|
|
52 Wk Highs |
310 |
|
|
S&P 600 |
-6.14 |
1,105.53 |
-0.55% |
|
52 Wk Lows |
8 |
|
|
52 Wk Lows |
16 |
|
|
 |
Nasdaq Composite Index Outpaces Peers
Kenneth J. Gruneisen - Passed the CAN SLIM® Master's Exam
The Dow slipped 44 points, while the S&P 500 rose 0.2%. The Nasdaq Composite gained 0.5% to a fresh all-time high. Wednesday's volume totals were higher than the prior session on the NYSE and on the Nasdaq exchange. Breadth was slightly negative as decliners led advancers by a narrow margin on the NYSE and on the Nasdaq exchange. There were 88 high-ranked companies from the Leaders List that hit new 52-week highs and were listed on the BreakOuts Page, versus the total of 72 on the prior session. New 52-week highs totals expanded and solidly outnumbered new 52-week lows totals on both exchanges. The major indices are in a confirmed uptrend (M criteria). Investors are reminded to always make buying and selling decisions based based on the strict criteria and rules of the fact-based investment system. 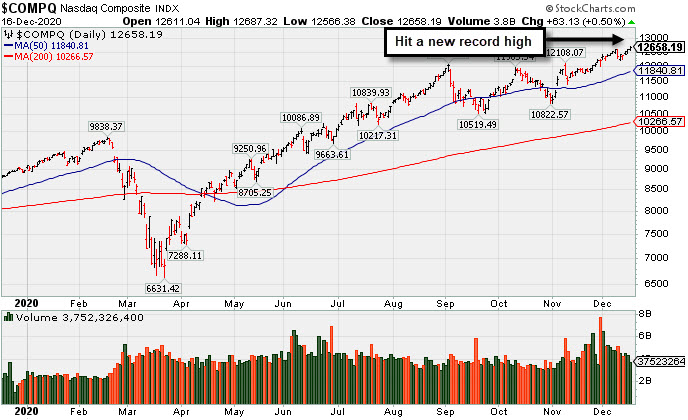 PICTURED: The Nasdaq Compsite Index hit a new record high.
Stocks finished mixed on Wednesday, as investors assessed economic data and weighed the latest central bank updates. Fiscal stimulus news also garnered attention, with Congressional leaders reportedly making progress towards a $900 billion coronavirus relief bill that should include another round of direct payments.
Monetary policy received renewed attention, with the Federal Reserve leaving benchmark rates unchanged near zero, as widely expected. Policymakers also noted that asset purchasing would remain at current levels until the U.S. economy made “substantial” progress towards full employment and inflation targets. On the data front, a release showed U.S. retail sales fell 1.1% in November, which was a steeper drop than the 0.3% expected decline and October’s downwardly revised 0.1% fall. Separately, the flash December reading of manufacturing and services PMI from research firm Markit revealed activity in both sectors are expanding at a slightly slower pace compared to November. Treasuries declined, with the yield on the 10-year note adding one basis point to 0.92%.
Seven of 11 S&P 500 sectors ended in negative territory. In corporate news, Alphabet (GOOGL -0.2%) edged lower after a coalition of states led by Texas filed an antitrust lawsuit against its Google unit. Canadian cannabis company Tilray (TLRY +18.55%) rose after agreeing to be acquired by competitor Aphria (APHA -0.86%) in an all-stock deal. Elsewhere, Moderna (MRNA -6.92%) after being the subject of an analyst downgrade ahead of its widely anticipated FDA emergency use approval of its COVID vaccine candidate. |
 Kenneth J. Gruneisen started out as a licensed stockbroker in August 1987, a couple of months prior to the historic stock market crash that took the Dow Jones Industrial Average down -22.6% in a single day. He has published daily fact-based fundamental and technical analysis on high-ranked stocks online for two decades. Through FACTBASEDINVESTING.COM, Kenneth provides educational articles, news, market commentary, and other information regarding proven investment systems that work in good times and bad.
Comments contained in the body of this report are technical opinions only and are not necessarily those of Gruneisen Growth Corp. The material herein has been obtained from sources believed to be reliable and accurate, however, its accuracy and completeness cannot be guaranteed. Our firm, employees, and customers may effect transactions, including transactions contrary to any recommendation herein, or have positions in the securities mentioned herein or options with respect thereto. Any recommendation contained in this report may not be suitable for all investors and it is not to be deemed an offer or solicitation on our part with respect to the purchase or sale of any securities. |
|
 |
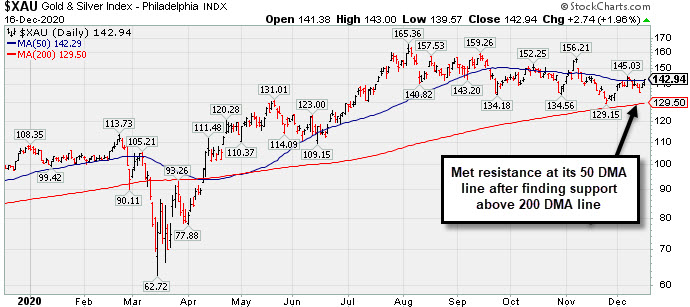
Retail, Financial, and Gold & Silver Indexes Rose
Kenneth J. Gruneisen - Passed the CAN SLIM® Master's Exam
The Retail Index ($RLX +1.61%) posted a solid gain and was a positive influence on the major indices along with the financials as the Broker/Dealer Index ($XBD +1.30%) outpaced the Bank Index ($BKX +0.36%). Commodity-linked groups were mixed as the Gold & Silver Index ($XAU +1.96%) rt aboove its posted a solid gain, meanwhile the Oil Services Index ($OSX -1.04%) and Integrated Oil Index ($XOI -0.76%) both fell. The tech sector was indecisive as the Networking Index ($NWX +0.12%) ended slightly higher and the Semiconductor Index ($SOX -0.05%) and Biotech Index ($BTK -0.26%) each ended just slighty in the red.
PICTURED: The Gold & Silver Index ($XAU +1.96%) has met resistance at its 50-day moving average (DMA) line after finding support at its 200 DMA line.
| Oil Services |
$OSX |
45.97 |
-0.48 |
-1.04% |
-41.28% |
| Integrated Oil |
$XOI |
819.05 |
-6.23 |
-0.76% |
-35.54% |
| Semiconductor |
$SOX |
2,773.42 |
-1.38 |
-0.05% |
+49.95% |
| Networking |
$NWX |
688.54 |
+0.82 |
+0.12% |
+18.02% |
| Broker/Dealer |
$XBD |
369.65 |
+4.74 |
+1.30% |
+27.30% |
| Retail |
$RLX |
3,549.72 |
+56.19 |
+1.61% |
+44.93% |
| Gold & Silver |
$XAU |
142.94 |
+2.74 |
+1.96% |
+33.69% |
| Bank |
$BKX |
94.77 |
+0.34 |
+0.36% |
-16.40% |
| Biotech |
$BTK |
5,778.28 |
-14.92 |
-0.26% |
+14.03% |
|
|
|
 |
Volume-Driven Gain for New High After Long Consolidation
Kenneth J. Gruneisen - Passed the CAN SLIM® Master's Exam
Shopify Inc Cl A (SHOP +$83.21 or +7.75% to $1,157.31) was highlighted in yellow with pivot point cited based on its 9/01/20 high plus 10 cents in the earlier mid-day report (read here). It hit a new all-time high with today's big gain backed by +117% above average volume while rising from a 15-week base. The gain and strong close above its pivot point clinched a convincing technical buy signal. Its 50-day moving average (DMA) line ($1,022) defines near-term support to watch above its 200 DMA line ($852).
It reported Sep '20 quarterly earnings of $1.13 per share versus a loss of 29 cents per share on +96% sales revenues versus the year ago period. The Ontario, Canada-based Computer Software - Enterprise firm's prior quarters showed big earnings increases well above the +25% minimum guideline (C criteria) with very strong underlying sales revenues growth. After years of losses it had strong earnings growth in FY '17-19 (A criteria).
The number of top-rated funds owning its shares rose from 1,151 in Sep '19 to 1,605 in Sep '20, a reassuring sign concerning the I criteria. It has a B Timeliness rating and an A Sponsorship Rating. There are 120.1 million shares outstanding (S criteria) which can contribute to greater price volatility in the event of instititonal buying or selling. |
|
|
Color Codes Explained :
Y - Better candidates highlighted by our
staff of experts.
G - Previously featured
in past reports as yellow but may no longer be buyable under the
guidelines.
***Last / Change / Volume data in this table is the closing quote data***
Symbol/Exchange
Company Name
Industry Group |
PRICE |
CHANGE
(%Change) |
Day High |
Volume
(% DAV)
(% 50 day avg vol) |
52 Wk Hi
% From Hi |
Featured
Date |
Price
Featured |
Pivot Featured |
|
Max Buy |
 CRL
-
NYSE
CRL
-
NYSE
Charles River Labs Intl
DRUGS - Biotechnology
|
$240.16
|
-2.92
-1.20% |
$242.43
|
277,985
87.97% of 50 DAV
50 DAV is 316,000
|
$257.88
-6.87%
|
7/15/2020
|
$192.66
|
PP = $189.95
|
|
MB = $199.45
|
Most Recent Note - 12/14/2020 4:55:53 PM
G - Still consolidating above its 50 DMA line ($236) which has been acting as support. Reported Sep '20 quarterly earnings +38% on +11% sales revenues versus the year ago period, above the +25% minimum earnings guideline (C criteria). See the latest FSU analysis for more details and a new annotated graph.
>>> FEATURED STOCK ARTICLE : CRL Consolidating Above 50-Day Moving Average Line - 12/14/2020 |
View all notes |
Set NEW NOTE alert |
Company Profile |
SEC
News |
Chart |
Request a new note
C
A
S
I |
AMD
-
NASDAQ
Advanced Micro Devices
ELECTRONICS - Semiconductor - Broad Line
|
$96.85
|
-0.27
-0.28% |
$97.27
|
34,481,293
71.01% of 50 DAV
50 DAV is 48,555,000
|
$97.98
-1.15%
|
11/18/2020
|
$82.54
|
PP = $88.72
|
|
MB = $93.16
|
Most Recent Note - 12/15/2020 5:44:34 PM
G - Hit a new all-time high with today's gain backed by +17% above average volume, getting more extended from the previously noted "double bottom" base. Its 50 DMA line ($84.89) defines important near term support to watch on pullbacks.
>>> FEATURED STOCK ARTICLE : Volume Heavy Behind AMD's Breakout from Double Bottom Base - 11/30/2020 |
View all notes |
Set NEW NOTE alert |
Company Profile |
SEC
News |
Chart |
Request a new note
C
A
S
I |
TER
-
NASDAQ
Teradyne Inc
ELECTRONICS - Semiconductor Equipment and Mate
|
$119.77
|
-0.67
-0.56% |
$120.84
|
1,619,173
106.11% of 50 DAV
50 DAV is 1,526,000
|
$120.76
-0.82%
|
10/21/2020
|
$92.22
|
PP = $93.54
|
|
MB = $98.22
|
Most Recent Note - 12/15/2020 5:48:35 PM
G - Posted a gain today with average volume for a new all-time high. Support to watch on pullbacks is its 50 DMA line ($99.75) and prior highs in the $93 area.
>>> FEATURED STOCK ARTICLE : Stubbornly Holding Ground and Rising for a New High - 12/7/2020 |
View all notes |
Set NEW NOTE alert |
Company Profile |
SEC
News |
Chart |
Request a new note
C
A
S
I |
AMRC
-
NYSE
Ameresco Inc Cl A
ENERGY - Alternative
|
$46.70
|
-0.89
-1.87% |
$48.36
|
494,275
136.92% of 50 DAV
50 DAV is 361,000
|
$47.97
-2.65%
|
12/15/2020
|
$46.72
|
PP = $47.10
|
|
MB = $49.46
|
 Most Recent Note - 12/16/2020 12:19:13 PM
Y - Reversed into the red after early gains today for a new all-time high. Finished strong after highlighted in yellow with pivot point cited based on its 11/24/20 high plus 10 cents in the prior mid-day report. Hit a new all-time high with +43% above average volume behind its 4th consecutive gain, rising from an advanced "ascending base" pattern triggering a technical buy signal. Tested its 50 DMA line ($42.15) last week and found prompt support. Reported earnings +111% on +33% sales revenues for the Sep '20 quarter versus the year ago period. Three of the 4 latest quarterly comparisons were above the +25% minimum earnings guideline (C criteria) with solid sales revenues growth. Annual earnings (A criteria) history has been good. See the latest FSU analysis for more details and an annotated graph.
>>> FEATURED STOCK ARTICLE : Gain From Ascending Base Pattern Backed by Above Average Volume - 12/15/2020 |
View all notes |
Set NEW NOTE alert |
Company Profile |
SEC
News |
Chart |
Request a new note
C
A
S
I |
TREX
-
NYSE
Trex Company Inc
MATERIALS and CONSTRUCTION - General Building Materials
|
$81.40
|
-1.57
-1.89% |
$84.50
|
841,347
113.54% of 50 DAV
50 DAV is 741,000
|
$83.51
-2.53%
|
6/26/2020
|
$54.53
|
PP = $66.47
|
|
MB = $69.79
|
Most Recent Note - 12/15/2020 5:41:40 PM
G - Hit a new 52-week high with today's 7th consecutive gain backed by +20% above average volume. Its 50 DMA line ($74.98) defines near-term support. Recently noted that it reported Sep '20 quarterly earnings +14% on +19% sales revenues versus the year ago period, below the +25% minimum guideline (C criteria) raising fundamental concerns.
>>> FEATURED STOCK ARTICLE : Consolidating Back Above 50-Day Moving Average Line - 12/1/2020 |
View all notes |
Set NEW NOTE alert |
Company Profile |
SEC
News |
Chart |
Request a new note
C
A
S
I |
Symbol/Exchange
Company Name
Industry Group |
PRICE |
CHANGE
(%Change) |
Day High |
Volume
(% DAV)
(% 50 day avg vol) |
52 Wk Hi
% From Hi |
Featured
Date |
Price
Featured |
Pivot Featured |
|
Max Buy |
CLFD
-
NASDAQ
Clearfield Inc
TELECOMMUNICATIONS - Cables / Satalite Equipment
|
$25.17
|
-0.23
-0.91% |
$25.83
|
133,560
139.13% of 50 DAV
50 DAV is 96,000
|
$28.32
-11.12%
|
11/17/2020
|
$22.06
|
PP = $26.07
|
|
MB = $27.37
|
Most Recent Note - 12/16/2020 12:28:10 PM
Y - Pulling back from its 52-week high with volume running at an above average pace behind today's 2nd consecutive loss. Slumped back below the pivot point raising some concerns. Near term support is defined by its 50 DMA line ($23.20) and an upward trendline.
>>> FEATURED STOCK ARTICLE : Perched Near Pivot Point in Need of Confirming Gain on Volume - 12/10/2020 |
View all notes |
Set NEW NOTE alert |
Company Profile |
SEC
News |
Chart |
Request a new note
C
A
S
I |
NOW
-
NYSE
Servicenow Inc
Computer Sftwr-Enterprse
|
$545.00
|
+17.62
3.34% |
$549.88
|
1,392,958
107.15% of 50 DAV
50 DAV is 1,300,000
|
$545.00
0.00%
|
8/20/2020
|
$453.34
|
PP = $454.79
|
|
MB = $477.53
|
Most Recent Note - 12/14/2020 4:57:57 PM
G - Holding its ground stubbornly near its all-time high after finding prompt support near its 50 DMA line. Recently reported Sep '20 quarterly earnings +22% on +30% sales revenues versus the year ago period, below the +25% minimum guideline (C criteria) of the fact-based investment system.
>>> FEATURED STOCK ARTICLE : Consolidating Above 50-Day Average Still Perched Near All-Time High - 11/24/2020 |
View all notes |
Set NEW NOTE alert |
Company Profile |
SEC
News |
Chart |
Request a new note
C
A
S
I |
ALRM
-
NASDAQ
Alarm.com Holdings Inc
Security/Sfty
|
$86.92
|
+3.61
4.33% |
$87.22
|
734,987
211.81% of 50 DAV
50 DAV is 347,000
|
$83.34
4.30%
|
11/6/2020
|
$71.88
|
PP = $74.76
|
|
MB = $78.50
|
Most Recent Note - 12/16/2020 5:42:32 PM
G - Powered to another new all-time high with today's big gain backed by +109% above average volume. Prior high ($74.66 on 7/23/20) defnes initial support to watch above its 50 DMA line ($68.43).
>>> FEATURED STOCK ARTICLE : Alarm Hits a New Record High - 12/4/2020 |
View all notes |
Set NEW NOTE alert |
Company Profile |
SEC
News |
Chart |
Request a new note
C
A
S
I |
TEAM
-
NASDAQ
Atlassian Corp Plc Cl A
Comp Sftwr-Spec Enterprs
|
$243.85
|
+6.15
2.59% |
$245.28
|
2,717,919
143.20% of 50 DAV
50 DAV is 1,898,000
|
$240.70
1.31%
|
10/12/2020
|
$193.77
|
PP = $199.60
|
|
MB = $209.58
|
Most Recent Note - 12/16/2020 12:59:53 PM
G - Extended from any sound base, posting a 5th consecutive gain today for yet another new 52-week high. Reported earnings +7% on +26% sales revenues for the Sep '20 quarter versus the year ago period, well below the +25% minimum earnings guideline (C criteria), raising concerns.
>>> FEATURED STOCK ARTICLE : Quiet Volume Behind Gain Today for a New All-Time High - 11/27/2020 |
View all notes |
Set NEW NOTE alert |
Company Profile |
SEC
News |
Chart |
Request a new note
C
A
S
I |
SHOP
-
NYSE
Shopify Inc Cl A
Computer Sftwr-Enterprse
|
$1,157.31
|
+83.21
7.75% |
$1,164.17
|
3,066,964
217.36% of 50 DAV
50 DAV is 1,411,000
|
$1,146.91
0.91%
|
12/16/2020
|
$1,146.00
|
PP = $1,147.01
|
|
MB = $1,204.36
|
Most Recent Note - 12/16/2020 5:40:03 PM
Y - Finished strong today after highlighted in yellow with pivot point cited based on its 9/01/20 high plus 10 cents in the earlier mid-day report. Hit a new all-time high with today's big gain backed by +117% above average volume while while rising from a 15-week base. The gain and strong close above its pivot point helped clinch a convincing technical buy signal. Its 50 DMA line ($1,022) defines near-term support to watch above its 200 DMA line ($852). Reported Sep '20 quarterly earnings of $1.13 per share versus a loss of 29 cents per share on +96% sales revenues versus the year ago period. The Ontario, Canada-based Computer Software - Enterprise firm's prior quarters showed big earnings increases well above the +25% minimum guideline (C criteria) with very strong underlying sales revenues growth. After years of losses it had strong earnings growth in FY '17-19 (A criteria). See the latest FSU analysis for more details and a new annotated graph.
>>> FEATURED STOCK ARTICLE : Volume-Driven Gain for New High After Long Consolidation - 12/16/2020 |
View all notes |
Set NEW NOTE alert |
Company Profile |
SEC
News |
Chart |
Request a new note
C
A
S
I |
Symbol/Exchange
Company Name
Industry Group |
PRICE |
CHANGE
(%Change) |
Day High |
Volume
(% DAV)
(% 50 day avg vol) |
52 Wk Hi
% From Hi |
Featured
Date |
Price
Featured |
Pivot Featured |
|
Max Buy |
YETI
-
NYSE
Yeti Holdings Inc
Leisure-Products
|
$73.65
|
+1.43
1.98% |
$74.07
|
949,129
76.36% of 50 DAV
50 DAV is 1,243,000
|
$72.39
1.74%
|
11/5/2020
|
$57.25
|
PP = $55.14
|
|
MB = $57.90
|
Most Recent Note - 12/14/2020 5:05:18 PM
G - Posted a big gain today with lighter volume while hovering near its all-time high. Its 50 DMA line ($56.73) and prior highs in the $55-54 area define important near-term support to watch on pullbacks.
>>> FEATURED STOCK ARTICLE : Volume Totals Cooloing While Stubbornly Holding Ground at High - 12/2/2020 |
View all notes |
Set NEW NOTE alert |
Company Profile |
SEC
News |
Chart |
Request a new note
C
A
S
I |
AAXN
-
NASDAQ
Axon Enterprise Inc
Security/Sfty
|
$119.94
|
-8.87
-6.89% |
$127.90
|
775,308
148.81% of 50 DAV
50 DAV is 521,000
|
$130.41
-8.03%
|
11/6/2020
|
$122.75
|
PP = $113.00
|
|
MB = $118.65
|
Most Recent Note - 12/16/2020 12:16:52 PM
G - Abruptly retreating today after early gains this week with above average volume challenged its all-time high. Its 50 DMA line ($114.21) defines near term support to watch on pullbacks. Recently reported Sep '20 quarterly earnings +43% on +27% sales revenues versus the year ago period.
>>> FEATURED STOCK ARTICLE : Volume Totals Cooling While Hovering Near All-Time High - 12/3/2020 |
View all notes |
Set NEW NOTE alert |
Company Profile |
SEC
News |
Chart |
Request a new note
C
A
S
I |
QTWO
-
NYSE
Q2 Holdings Inc
Computer Sftwr-Financial
|
$119.67
|
-1.74
-1.43% |
$122.37
|
593,161
141.23% of 50 DAV
50 DAV is 420,000
|
$121.69
-1.66%
|
11/12/2020
|
$105.14
|
PP = $106.54
|
|
MB = $111.87
|
Most Recent Note - 12/14/2020 4:59:00 PM
G - Posted a solid gain today with above average volume hitting a new all-time high. Prior high in the $106 area and its 50 DMA line ($104) define important near term suport to watch on pullbacks.
>>> FEATURED STOCK ARTICLE : Computer Software - Financial Firm Hovering Near Record High - 12/8/2020 |
View all notes |
Set NEW NOTE alert |
Company Profile |
SEC
News |
Chart |
Request a new note
C
A
S
I |
|
|
|
THESE ARE NOT BUY RECOMMENDATIONS!
Comments contained in the body of this report are technical
opinions only. The material herein has been obtained
from sources believed to be reliable and accurate, however,
its accuracy and completeness cannot be guaranteed.
This site is not an investment advisor, hence it does
not endorse or recommend any securities or other investments.
Any recommendation contained in this report may not
be suitable for all investors and it is not to be deemed
an offer or solicitation on our part with respect to
the purchase or sale of any securities. All trademarks,
service marks and trade names appearing in this report
are the property of their respective owners, and are
likewise used for identification purposes only.
This report is a service available
only to active Paid Premium Members.
You may opt-out of receiving report notifications
at any time. Questions or comments may be submitted
by writing to Premium Membership Services 665 S.E. 10 Street, Suite 201 Deerfield Beach, FL 33441-5634 or by calling 1-800-965-8307
or 954-785-1121.
|
|
|