You are not logged in.
This means you
CAN ONLY VIEW reports that were published prior to Tuesday, March 25, 2025.
You
MUST UPGRADE YOUR MEMBERSHIP if you want to see any current reports.
AFTER MARKET UPDATE - THURSDAY, DECEMBER 17TH, 2020
Previous After Market Report Next After Market Report >>>
|
|
|
|
DOW |
+148.83 |
30,303.37 |
+0.49% |
|
Volume |
958,845,651 |
+1% |
|
Volume |
4,944,040,700 |
+10% |
|
NASDAQ |
+104.72 |
12,762.91 |
+0.83% |
|
Advancers |
2,058 |
67% |
|
Advancers |
2,462 |
68% |
|
S&P 500 |
+21.31 |
3,722.48 |
+0.58% |
|
Decliners |
1,035 |
33% |
|
Decliners |
1,170 |
32% |
|
Russell 2000 |
+25.32 |
1,978.05 |
+1.30% |
|
52 Wk Highs |
246 |
|
|
52 Wk Highs |
425 |
|
|
S&P 600 |
+11.21 |
1,116.74 |
+1.01% |
|
52 Wk Lows |
6 |
|
|
52 Wk Lows |
11 |
|
|
 |
Breadth Positive as Major Indices Hit New Record Highs
Kenneth J. Gruneisen - Passed the CAN SLIM® Master's Exam
The Dow rose 148 points, while the S&P 500 gained 0.6%. The Nasdaq Composite advanced 0.8%. All three major averages notched fresh all-time highs. Thursday's volume totals were higher than the prior session on the NYSE and on the Nasdaq exchange, indicative of institutional accumulation. Breadth was positive as advancers led decliners by a 2-1 margin on the NYSE and on the Nasdaq exchange. There were 89 high-ranked companies from the Leaders List that hit new 52-week highs and were listed on the BreakOuts Page, versus the total of 88 on the prior session. New 52-week highs totals expanded and solidly outnumbered shrinking new 52-week lows totals on both exchanges. The major indices are in a confirmed uptrend (M criteria). Investors are reminded to always make buying and selling decisions based based on the strict criteria and rules of the fact-based investment system. 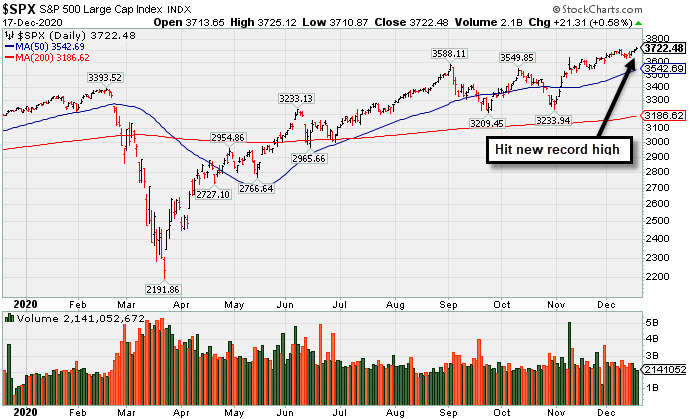 PICTURED: The S&P 500 Index hit a new record high.
Stocks finished higher on Thursday as investors continued to focus on the prospects for fiscal stimulus. With U.S. coronavirus cases and hospitalizations hovering near a record high, Congressional leaders were reportedly pushing towards an emergency $900 billion relief package. Senate Majority Leader Mitch McConnell signaled that lawmakers are “close” to finalizing a bipartisan deal.
On the data front, a disappointing initial jobless claims update showed the number of Americans filing for new unemployment benefits unexpectedly rose for the fourth time in five weeks, jumping to 885,000 in the week ending December 12 from an upwardly revised 862,000 the prior period. Meanwhile, updates on housing starts and building permits showed both rose more than expected in November. Treasuries declined, with the yield on the 10-year note adding one basis point to 0.93%. In commodities, WTI crude rose 1.3% to $48.42/barrel, while gold rose 1.6% to $1885.00/ounce amid a weaker dollar.
Nine of 11 S&P 500 sectors ended higher, with the Energy and Communication Services bucking the uptrend. Alphabet (GOOGL -0.95%) was a notable decliner after a bipartisan coalition of 38 states sued its Google unit for search-market dominance, the third major antitrust lawsuit filed since October. In other corporate news, Accenture (ACN +6.88%) rose as the consulting firm beat Wall Street profit and sales estimates and raised its full-year guidance. Lennar (LEN +7.62%) rose as the homebuilder cited lower mortgage rates as a tailwind following an earnings beat. |
 Kenneth J. Gruneisen started out as a licensed stockbroker in August 1987, a couple of months prior to the historic stock market crash that took the Dow Jones Industrial Average down -22.6% in a single day. He has published daily fact-based fundamental and technical analysis on high-ranked stocks online for two decades. Through FACTBASEDINVESTING.COM, Kenneth provides educational articles, news, market commentary, and other information regarding proven investment systems that work in good times and bad.
Comments contained in the body of this report are technical opinions only and are not necessarily those of Gruneisen Growth Corp. The material herein has been obtained from sources believed to be reliable and accurate, however, its accuracy and completeness cannot be guaranteed. Our firm, employees, and customers may effect transactions, including transactions contrary to any recommendation herein, or have positions in the securities mentioned herein or options with respect thereto. Any recommendation contained in this report may not be suitable for all investors and it is not to be deemed an offer or solicitation on our part with respect to the purchase or sale of any securities. |
|
 |
Gold & Silver Index Posted Standout Gain
Kenneth J. Gruneisen - Passed the CAN SLIM® Master's Exam
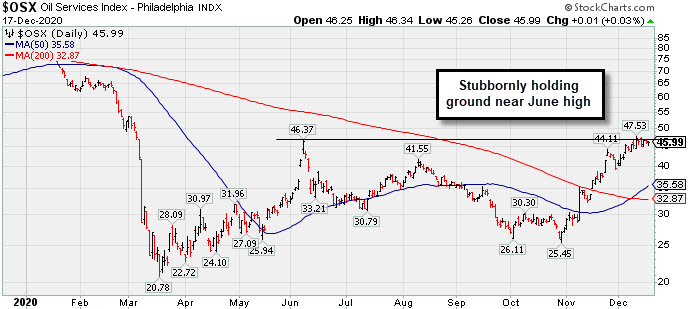
The Gold & Silver Index ($XAU +3.71%) posted a standout gain. The Biotech Index ($BTK +1.89%) led the tech sector while the Networking Index ($NWX +1.28%) also posted a solid gain and the Semiconductor Index ($SOX +0.18%) inched higher. The Broker/Dealer Index ($XBD +0.58%) and Retail Index ($RLX +0.25%) each posted a modest gain while the Bank Index ($BKX -0.17%) ended slightly lower. Energy-linked groups including the Integrated Oil Index ($XOI -0.37%) were little changed.
PICTURED: The Oil Services Index ($OSX +0.03%) has been stubbornly holding its ground near the June high. Its 50-day moving average (DMA) line has recently crossed above the 200 DMA line, termed a "golden cross".by some technical analysts.
| Oil Services |
$OSX |
45.99 |
+0.01 |
+0.03% |
-41.26% |
| Integrated Oil |
$XOI |
816.06 |
-3.00 |
-0.37% |
-35.77% |
| Semiconductor |
$SOX |
2,778.32 |
+4.90 |
+0.18% |
+50.21% |
| Networking |
$NWX |
697.23 |
+8.79 |
+1.28% |
+19.51% |
| Broker/Dealer |
$XBD |
371.80 |
+2.15 |
+0.58% |
+28.04% |
| Retail |
$RLX |
3,558.67 |
+8.95 |
+0.25% |
+45.30% |
| Gold & Silver |
$XAU |
148.25 |
+5.31 |
+3.71% |
+38.65% |
| Bank |
$BKX |
94.61 |
-0.16 |
-0.17% |
-16.54% |
| Biotech |
$BTK |
5,887.78 |
+109.49 |
+1.89% |
+16.19% |
|
|
|
 |
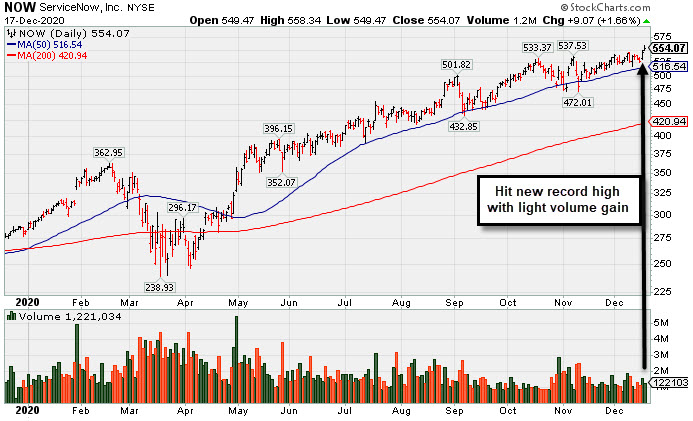
Hit New Record High With Light Volume Behind Gain
Kenneth J. Gruneisen - Passed the CAN SLIM® Master's Exam
ServiceNow Inc (NOW +$9.07 or +1.66% to $554.07) posted a gain today with light volume for a new all-time high. It found prompt support near its 50-day moving average (DMA) line ($516.52) and stubbornly held its ground in recent weeks. Recently it reported Sep '20 quarterly earnings +22% on +30% sales revenues versus the year ago period, below the +25% minimum guideline (C criteria) of the fact-based investment system.
It reported Jun '20 quarterly earnings +73% on +28% sales revenues versus the year ago period and prior results had been routinely above the +25% minimum earnings guideline (C criteria). It has an Earnings Per Share Rating of 98. The Computer Software - Enterprise group has a Group Relative Strength Rating of B- (52). NOW has a new CEO as of 1/01/20.
NOW traded up as much as +61.5% since first highlighted in yellow in the 4/30/20 mid-day report with a pivot point based on its 2/19/20 high plus 10 cents (read here). It was last shown in this FSU section on 11/24/20 with an annotated graph under the headline, ""Consolidating Above 50-Day Average Still Perched Near All-Time High". The number of top-rated funds owning its shares rose from 1,030 in Jun '17 to 2.489 in Sep '20, a reassuring sign concerning the I criteria. It has a Timeliness Rating of B and a Sponsorship Rating of A. Its current Up/Down Volume Ratio of 1.1 is an unbiased indication its shares have been under slight accumulation over the past 50 days. |
|
|
Color Codes Explained :
Y - Better candidates highlighted by our
staff of experts.
G - Previously featured
in past reports as yellow but may no longer be buyable under the
guidelines.
***Last / Change / Volume data in this table is the closing quote data***
Symbol/Exchange
Company Name
Industry Group |
PRICE |
CHANGE
(%Change) |
Day High |
Volume
(% DAV)
(% 50 day avg vol) |
52 Wk Hi
% From Hi |
Featured
Date |
Price
Featured |
Pivot Featured |
|
Max Buy |
 CRL
-
NYSE
CRL
-
NYSE
Charles River Labs Intl
DRUGS - Biotechnology
|
$247.06
|
+6.90
2.87% |
$247.23
|
260,956
82.58% of 50 DAV
50 DAV is 316,000
|
$257.88
-4.20%
|
12/17/2020
|
$247.06
|
PP = $257.98
|
|
MB = $270.88
|
 Most Recent Note - 12/17/2020 5:06:04 PM
Y - Posted a gain today with light volume. Color code is changed to yellow with new pivot point cited based on its 11/09/20 high plus 10 cents. Subsequent gans above its pivot point backed by at least +40% above average volume may trigger a new (or add-on) technical buy signal. Its 50 DMA line ($236) has been acting as support. Reported Sep '20 quarterly earnings +38% on +11% sales revenues versus the year ago period, above the +25% minimum earnings guideline (C criteria).
>>> FEATURED STOCK ARTICLE : CRL Consolidating Above 50-Day Moving Average Line - 12/14/2020 |
View all notes |
Set NEW NOTE alert |
Company Profile |
SEC
News |
Chart |
Request a new note
C
A
S
I |
AMD
-
NASDAQ
Advanced Micro Devices
ELECTRONICS - Semiconductor - Broad Line
|
$96.84
|
-0.01
-0.01% |
$97.92
|
31,815,369
66.01% of 50 DAV
50 DAV is 48,198,000
|
$97.98
-1.16%
|
11/18/2020
|
$82.54
|
PP = $88.72
|
|
MB = $93.16
|
Most Recent Note - 12/15/2020 5:44:34 PM
G - Hit a new all-time high with today's gain backed by +17% above average volume, getting more extended from the previously noted "double bottom" base. Its 50 DMA line ($84.89) defines important near term support to watch on pullbacks.
>>> FEATURED STOCK ARTICLE : Volume Heavy Behind AMD's Breakout from Double Bottom Base - 11/30/2020 |
View all notes |
Set NEW NOTE alert |
Company Profile |
SEC
News |
Chart |
Request a new note
C
A
S
I |
TER
-
NASDAQ
Teradyne Inc
ELECTRONICS - Semiconductor Equipment and Mate
|
$119.35
|
-0.42
-0.35% |
$122.37
|
1,610,102
104.82% of 50 DAV
50 DAV is 1,536,000
|
$120.84
-1.23%
|
10/21/2020
|
$92.22
|
PP = $93.54
|
|
MB = $98.22
|
Most Recent Note - 12/15/2020 5:48:35 PM
G - Posted a gain today with average volume for a new all-time high. Support to watch on pullbacks is its 50 DMA line ($99.75) and prior highs in the $93 area.
>>> FEATURED STOCK ARTICLE : Stubbornly Holding Ground and Rising for a New High - 12/7/2020 |
View all notes |
Set NEW NOTE alert |
Company Profile |
SEC
News |
Chart |
Request a new note
C
A
S
I |
AMRC
-
NYSE
Ameresco Inc Cl A
ENERGY - Alternative
|
$49.05
|
+2.35
5.03% |
$49.10
|
343,409
93.83% of 50 DAV
50 DAV is 366,000
|
$48.36
1.43%
|
12/15/2020
|
$46.72
|
PP = $47.10
|
|
MB = $49.46
|
Most Recent Note - 12/17/2020 4:58:47 PM
Y - Posted a big gain today with near average volume for another new all-time high. Finished strong after highlighted in yellow with pivot point cited based on its 11/24/20 high plus 10 cents in the 12/15/20 mid-day report. Tested its 50 DMA line ($42.40) last week and found prompt support. Reported earnings +111% on +33% sales revenues for the Sep '20 quarter versus the year ago period. Three of the 4 latest quarterly comparisons were above the +25% minimum earnings guideline (C criteria) with solid sales revenues growth. Annual earnings (A criteria) history has been good.
>>> FEATURED STOCK ARTICLE : Gain From Ascending Base Pattern Backed by Above Average Volume - 12/15/2020 |
View all notes |
Set NEW NOTE alert |
Company Profile |
SEC
News |
Chart |
Request a new note
C
A
S
I |
TREX
-
NYSE
Trex Company Inc
MATERIALS and CONSTRUCTION - General Building Materials
|
$82.50
|
+1.10
1.35% |
$83.20
|
587,218
78.93% of 50 DAV
50 DAV is 744,000
|
$84.50
-2.37%
|
6/26/2020
|
$54.53
|
PP = $66.47
|
|
MB = $69.79
|
Most Recent Note - 12/15/2020 5:41:40 PM
G - Hit a new 52-week high with today's 7th consecutive gain backed by +20% above average volume. Its 50 DMA line ($74.98) defines near-term support. Recently noted that it reported Sep '20 quarterly earnings +14% on +19% sales revenues versus the year ago period, below the +25% minimum guideline (C criteria) raising fundamental concerns.
>>> FEATURED STOCK ARTICLE : Consolidating Back Above 50-Day Moving Average Line - 12/1/2020 |
View all notes |
Set NEW NOTE alert |
Company Profile |
SEC
News |
Chart |
Request a new note
C
A
S
I |
Symbol/Exchange
Company Name
Industry Group |
PRICE |
CHANGE
(%Change) |
Day High |
Volume
(% DAV)
(% 50 day avg vol) |
52 Wk Hi
% From Hi |
Featured
Date |
Price
Featured |
Pivot Featured |
|
Max Buy |
CLFD
-
NASDAQ
Clearfield Inc
TELECOMMUNICATIONS - Cables / Satalite Equipment
|
$26.31
|
+1.14
4.53% |
$26.42
|
335,316
349.29% of 50 DAV
50 DAV is 96,000
|
$28.32
-7.10%
|
11/17/2020
|
$22.06
|
PP = $26.07
|
|
MB = $27.37
|
Most Recent Note - 12/17/2020 5:01:14 PM
Y - Posted a big gain today with +72% above average volume, rising back above the pivot point. Near term support is defined by its 50 DMA line ($23.26) and an upward trendline.
>>> FEATURED STOCK ARTICLE : Perched Near Pivot Point in Need of Confirming Gain on Volume - 12/10/2020 |
View all notes |
Set NEW NOTE alert |
Company Profile |
SEC
News |
Chart |
Request a new note
C
A
S
I |
NOW
-
NYSE
Servicenow Inc
Computer Sftwr-Enterprse
|
$554.07
|
+9.07
1.66% |
$558.34
|
1,223,707
93.56% of 50 DAV
50 DAV is 1,308,000
|
$549.88
0.76%
|
8/20/2020
|
$453.34
|
PP = $454.79
|
|
MB = $477.53
|
Most Recent Note - 12/17/2020 5:22:16 PM
G - Posted a quiet gain today for a new all-time high. Found prompt support near its 50 DMA line and stubbornly held its ground in recent weeks. Recently reported Sep '20 quarterly earnings +22% on +30% sales revenues versus the year ago period, below the +25% minimum guideline (C criteria) of the fact-based investment system. See the latest FSU analysis for more details and a new annotated graph.
>>> FEATURED STOCK ARTICLE : Hit New Record High With Light Volume Behind Gain - 12/17/2020 |
View all notes |
Set NEW NOTE alert |
Company Profile |
SEC
News |
Chart |
Request a new note
C
A
S
I |
ALRM
-
NASDAQ
Alarm.com Holdings Inc
Security/Sfty
|
$90.45
|
+3.53
4.06% |
$90.56
|
480,999
135.11% of 50 DAV
50 DAV is 356,000
|
$87.22
3.70%
|
11/6/2020
|
$71.88
|
PP = $74.76
|
|
MB = $78.50
|
Most Recent Note - 12/17/2020 5:12:58 PM
G - Powered to yet another new all-time high with today's 4th consecutive gain. Prior high ($74.66 on 7/23/20) defnes initial support to watch above its 50 DMA line ($69.05).
>>> FEATURED STOCK ARTICLE : Alarm Hits a New Record High - 12/4/2020 |
View all notes |
Set NEW NOTE alert |
Company Profile |
SEC
News |
Chart |
Request a new note
C
A
S
I |
TEAM
-
NASDAQ
Atlassian Corp Plc Cl A
Comp Sftwr-Spec Enterprs
|
$248.05
|
+4.20
1.72% |
$250.03
|
1,122,822
58.33% of 50 DAV
50 DAV is 1,925,000
|
$245.28
1.13%
|
10/12/2020
|
$193.77
|
PP = $199.60
|
|
MB = $209.58
|
Most Recent Note - 12/16/2020 12:59:53 PM
G - Extended from any sound base, posting a 5th consecutive gain today for yet another new 52-week high. Reported earnings +7% on +26% sales revenues for the Sep '20 quarter versus the year ago period, well below the +25% minimum earnings guideline (C criteria), raising concerns.
>>> FEATURED STOCK ARTICLE : Quiet Volume Behind Gain Today for a New All-Time High - 11/27/2020 |
View all notes |
Set NEW NOTE alert |
Company Profile |
SEC
News |
Chart |
Request a new note
C
A
S
I |
SHOP
-
NYSE
Shopify Inc Cl A
Computer Sftwr-Enterprse
|
$1,180.00
|
+22.69
1.96% |
$1,206.90
|
2,291,111
158.66% of 50 DAV
50 DAV is 1,444,000
|
$1,164.17
1.36%
|
12/16/2020
|
$1,146.00
|
PP = $1,147.01
|
|
MB = $1,204.36
|
Most Recent Note - 12/17/2020 12:40:30 PM
Y - Rose near its "max buy" level with today's early gain backed by abve average volume. Finished strong after highlighted in yellow with pivot point cited based on its 9/01/20 high plus 10 cents in the prior mid-day report. Hit a new all-time high with a big gain backed by +117% above average volume while while rising from a 15-week base. The gain and strong close above its pivot point helped clinch a convincing technical buy signal. Its 50 DMA line ($1,024) defines near-term support to watch above its 200 DMA line ($855). Reported Sep '20 quarterly earnings of $1.13 per share versus a loss of 29 cents per share on +96% sales revenues versus the year ago period. The Ontario, Canada-based Computer Software - Enterprise firm's prior quarters showed big earnings increases well above the +25% minimum guideline (C criteria) with very strong underlying sales revenues growth. After years of losses it had strong earnings growth in FY '17-19 (A criteria). See the latest FSU analysis for more details and an annotated graph.
>>> FEATURED STOCK ARTICLE : Volume-Driven Gain for New High After Long Consolidation - 12/16/2020 |
View all notes |
Set NEW NOTE alert |
Company Profile |
SEC
News |
Chart |
Request a new note
C
A
S
I |
Symbol/Exchange
Company Name
Industry Group |
PRICE |
CHANGE
(%Change) |
Day High |
Volume
(% DAV)
(% 50 day avg vol) |
52 Wk Hi
% From Hi |
Featured
Date |
Price
Featured |
Pivot Featured |
|
Max Buy |
YETI
-
NYSE
Yeti Holdings Inc
Leisure-Products
|
$71.97
|
-1.68
-2.28% |
$74.66
|
989,120
79.83% of 50 DAV
50 DAV is 1,239,000
|
$74.07
-2.84%
|
11/5/2020
|
$57.25
|
PP = $55.14
|
|
MB = $57.90
|
Most Recent Note - 12/17/2020 4:56:03 PM
G - Pulled back today with lighter volume after recently wedgiing to new all-time highs. Its 50 DMA line ($58.15) and prior highs in the $55-54 area define important near-term support to watch on pullbacks.
>>> FEATURED STOCK ARTICLE : Volume Totals Cooloing While Stubbornly Holding Ground at High - 12/2/2020 |
View all notes |
Set NEW NOTE alert |
Company Profile |
SEC
News |
Chart |
Request a new note
C
A
S
I |
AAXN
-
NASDAQ
Axon Enterprise Inc
Security/Sfty
|
$120.75
|
+0.81
0.68% |
$122.81
|
615,659
116.60% of 50 DAV
50 DAV is 528,000
|
$130.41
-7.41%
|
11/6/2020
|
$122.75
|
PP = $113.00
|
|
MB = $118.65
|
Most Recent Note - 12/16/2020 12:16:52 PM
G - Abruptly retreating today after early gains this week with above average volume challenged its all-time high. Its 50 DMA line ($114.21) defines near term support to watch on pullbacks. Recently reported Sep '20 quarterly earnings +43% on +27% sales revenues versus the year ago period.
>>> FEATURED STOCK ARTICLE : Volume Totals Cooling While Hovering Near All-Time High - 12/3/2020 |
View all notes |
Set NEW NOTE alert |
Company Profile |
SEC
News |
Chart |
Request a new note
C
A
S
I |
QTWO
-
NYSE
Q2 Holdings Inc
Computer Sftwr-Financial
|
$122.98
|
+3.31
2.77% |
$123.00
|
409,799
96.88% of 50 DAV
50 DAV is 423,000
|
$122.37
0.50%
|
11/12/2020
|
$105.14
|
PP = $106.54
|
|
MB = $111.87
|
Most Recent Note - 12/17/2020 5:11:25 PM
G - Posted a solid gain today with average volume hitting another new all-time high. Prior high in the $106 area and its 50 DMA line ($105.52) define important near term suport to watch on pullbacks.
>>> FEATURED STOCK ARTICLE : Computer Software - Financial Firm Hovering Near Record High - 12/8/2020 |
View all notes |
Set NEW NOTE alert |
Company Profile |
SEC
News |
Chart |
Request a new note
C
A
S
I |
|
|
|
THESE ARE NOT BUY RECOMMENDATIONS!
Comments contained in the body of this report are technical
opinions only. The material herein has been obtained
from sources believed to be reliable and accurate, however,
its accuracy and completeness cannot be guaranteed.
This site is not an investment advisor, hence it does
not endorse or recommend any securities or other investments.
Any recommendation contained in this report may not
be suitable for all investors and it is not to be deemed
an offer or solicitation on our part with respect to
the purchase or sale of any securities. All trademarks,
service marks and trade names appearing in this report
are the property of their respective owners, and are
likewise used for identification purposes only.
This report is a service available
only to active Paid Premium Members.
You may opt-out of receiving report notifications
at any time. Questions or comments may be submitted
by writing to Premium Membership Services 665 S.E. 10 Street, Suite 201 Deerfield Beach, FL 33441-5634 or by calling 1-800-965-8307
or 954-785-1121.
|
|
|