You are not logged in.
This means you
CAN ONLY VIEW reports that were published prior to Thursday, March 20, 2025.
You
MUST UPGRADE YOUR MEMBERSHIP if you want to see any current reports.
AFTER MARKET UPDATE - TUESDAY, DECEMBER 29TH, 2020
Previous After Market Report Next After Market Report >>>
|
|
|
|
DOW |
-68.30 |
30,335.67 |
-0.22% |
|
Volume |
724,295,351 |
-1% |
|
Volume |
4,645,700,400 |
-8% |
|
NASDAQ |
-49.12 |
12,850.31 |
-0.38% |
|
Advancers |
1,084 |
35% |
|
Advancers |
1,085 |
29% |
|
S&P 500 |
-7.97 |
3,727.39 |
-0.21% |
|
Decliners |
2,027 |
65% |
|
Decliners |
2,663 |
71% |
|
Russell 2000 |
-36.89 |
1,959.36 |
-1.85% |
|
52 Wk Highs |
107 |
|
|
52 Wk Highs |
189 |
|
|
S&P 600 |
-17.59 |
1,107.35 |
-1.56% |
|
52 Wk Lows |
5 |
|
|
52 Wk Lows |
24 |
|
|
 |
Major Indices Quietly Pulled Back From Record Highs
Kenneth J. Gruneisen - Passed the CAN SLIM® Master's Exam
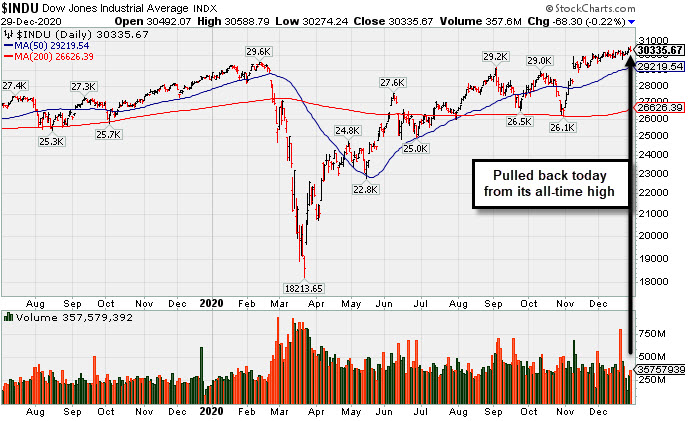
The Dow and S&P 500 both snapped a three day winning streak, slipping 68 points and 0.2%, respectively. The Nasdaq Composite fell 0.4%. The volume totals were lighter than the prior session volume totals on the NYSE and on the Nasdaq exchange. Breadth was negative as decliners led advancers by almost a 2-1 margin on the NYSE and by more than 2-1 on the Nasdaq exchange. There were 20 high-ranked companies from the Leaders List that hit new 52-week highs and were listed on the BreakOuts Page, versus the total of 67 on the prior session. New 52-week highs totals contracted yet still easily outnumbered the new 52-week lows totals on both exchanges. The major indices are in a confirmed uptrend (M criteria). Investors are reminded to always make buying and selling decisions based based on the strict criteria and rules of the fact-based investment system. PICTURED: The Dow Jones Industrial Average is perched at its record high.
Stocks finished lower on Tuesday, reversing course after reaching fresh intraday record highs earlier in the session. Despite the declines, the major averages remain on pace to close out 2020 with robust gains. Through today’s close, the S&P 500 has climbed 15.4% this year, while the Nasdaq Composite has rallied 43.2%. The Dow has lagged on a relative basis, but is on pace for a 6.3% annual advance.
Investors assessed fiscal stimulus updates. The House passed a bill on Monday that would increase stimulus checks to $2000 from the current $600 level. The measure now moves to the Senate, where the size of the payment is likely to face push back. On the data front, a release from S&P CoreLogic Case-Shiller showed home prices in 20-U.S. cities climbed 1.6% in October, and nearly 8% compared to a year ago. Treasuries were mixed, with the yield on the benchmark 10-year note rising one basis point to 0.93%.
Nine of 11 S&P 500 sectors ended in negative territory, with Health Care and Consumer Discretionary groups bucking the downtrend. In corporate news, Boeing (BA +0.07%) was flat as American Airlines (AAL -1.25%) returned the updated 737 Max jets to service. Biotech company Novavax (NVAX +2.93%) rose after the company’s COVID-19 vaccine became the fifth candidate to enter late stage testing in the United States. Elsewhere, Intel (INTC +4.93%) rose following news that activist investor Daniel Loeb called on the company to explore strategic alternatives. |
 Kenneth J. Gruneisen started out as a licensed stockbroker in August 1987, a couple of months prior to the historic stock market crash that took the Dow Jones Industrial Average down -22.6% in a single day. He has published daily fact-based fundamental and technical analysis on high-ranked stocks online for two decades. Through FACTBASEDINVESTING.COM, Kenneth provides educational articles, news, market commentary, and other information regarding proven investment systems that work in good times and bad.
Comments contained in the body of this report are technical opinions only and are not necessarily those of Gruneisen Growth Corp. The material herein has been obtained from sources believed to be reliable and accurate, however, its accuracy and completeness cannot be guaranteed. Our firm, employees, and customers may effect transactions, including transactions contrary to any recommendation herein, or have positions in the securities mentioned herein or options with respect thereto. Any recommendation contained in this report may not be suitable for all investors and it is not to be deemed an offer or solicitation on our part with respect to the purchase or sale of any securities. |
|
 |
Retail Index was a Standout Gainer
Kenneth J. Gruneisen - Passed the CAN SLIM® Master's Exam
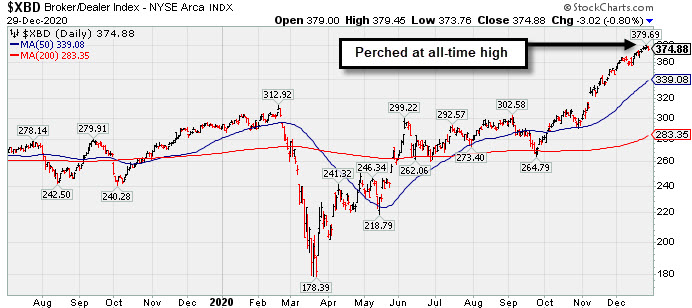
The Broker/Dealer Index ($XBD -0.80%) and Bank Index ($BKX -0.84%) both had a slightly negative bias that weighed on the major indices while the Retail Index ($RLX +0.47%) was a standout as it posted a modest gain. The Biotech Index ($BTK -1.63%) and Networking Index ($NWX -1.69%) both outpaced the Semiconductor Index ($SOX -0.23%) to the downside. The Oil Services Index ($OSX -0.99%) and Integrated Oil Index ($XOI -0.30%) both edged lower, meanwhile the Gold & Silver Index ($XAU +0.10%) eked out a tiny gain.
PICTURED: The Broker/Dealer Index ($XBD -0.80%) is perched at its all-time high. It rallied impressively from the March low.
| Oil Services |
$OSX |
43.32 |
-0.43 |
-0.99% |
-44.67% |
| Integrated Oil |
$XOI |
788.38 |
-2.38 |
-0.30% |
-37.95% |
| Semiconductor |
$SOX |
2,737.98 |
-6.32 |
-0.23% |
+48.03% |
| Networking |
$NWX |
711.26 |
-12.19 |
-1.69% |
+21.91% |
| Broker/Dealer |
$XBD |
374.88 |
-3.02 |
-0.80% |
+29.10% |
| Retail |
$RLX |
3,598.90 |
+16.69 |
+0.47% |
+46.94% |
| Gold & Silver |
$XAU |
142.48 |
+0.15 |
+0.10% |
+33.26% |
| Bank |
$BKX |
96.09 |
-0.82 |
-0.84% |
-15.24% |
| Biotech |
$BTK |
5,769.22 |
-95.42 |
-1.63% |
+13.85% |
|
|
|
 |
Pulling Back After Recently Wedging to New Highs
Kenneth J. Gruneisen - Passed the CAN SLIM® Master's Exam
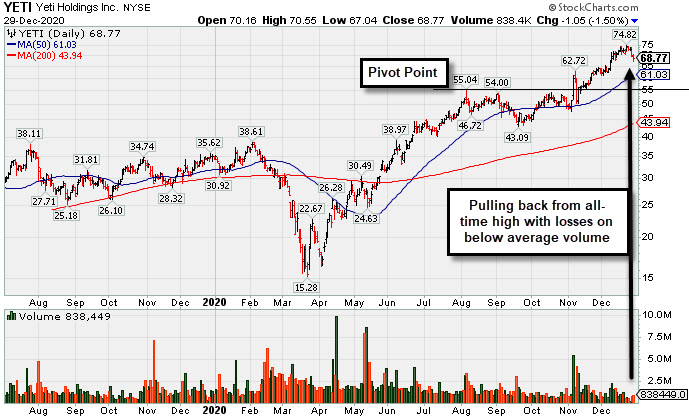
Yeti Holdings Inc (YETI -$1.05 or -1.50% to $68.77) slumped for a 2nd consecutive loss today with below average volume. It recently wedged to new all-time highs with gains lacking great volume conviction. Its 50-day moving average (DMA) line ($61.03) defines initial support to watch above prior highs in the $55-54 area.
YETI was highlighted in yellow in the 11/05/20 mid-day report with pivot point cited based on its 8/06/20 high plus 10 cents (read here). It was last shown with an annotated graph on 12/02/20 under the headline, "Volume Totals Cooling While Stubbornly Holding Ground at High". It powered to a new all-time high (N criteria) with a big volume-driven gain clearing an orderly base and triggering a technical buy signal. Volume was +390% above average behind he gain, indicative of heavy institutional buying demand, but it quickly got extended from the prior high. Disciplined investors avoid chasing stocks more than +5% above their p3ivot point.
Bullish action came after it reported earnings +126% on +29% sales revenues for the Sep '20 quarter versus the year ago period, its 5th consecutive quarterly earnings increase above the +25% minimum earnings guideline (C criteria) of the fact-based investment system. Its limited annual earnings (A criteria) history was previously noted as a concern.
It hails from the Leisure-Products group which currently has a C+ (49) Group Relative Strength rating (L criteria). There is a small supply of only 87.1 million shares outstanding (S criteria). The number of top-rated funds owning its shares rose from 310 in Dec '19 to 512 in Sep '20, a reassuring sign concerning the I criteria. Completed Secondary Offerings on 5/12/20, 2/20/20, 11/08/19 and 5/08/19 after its $18 IPO on 10/25/18.
|
|
|
Color Codes Explained :
Y - Better candidates highlighted by our
staff of experts.
G - Previously featured
in past reports as yellow but may no longer be buyable under the
guidelines.
***Last / Change / Volume data in this table is the closing quote data***
Symbol/Exchange
Company Name
Industry Group |
PRICE |
CHANGE
(%Change) |
Day High |
Volume
(% DAV)
(% 50 day avg vol) |
52 Wk Hi
% From Hi |
Featured
Date |
Price
Featured |
Pivot Featured |
|
Max Buy |
 CRL
-
NYSE
CRL
-
NYSE
Charles River Labs Intl
DRUGS - Biotechnology
|
$248.64
|
+1.47
0.59% |
$250.19
|
160,630
50.67% of 50 DAV
50 DAV is 317,000
|
$257.88
-3.58%
|
12/17/2020
|
$247.06
|
PP = $257.98
|
|
MB = $270.88
|
 Most Recent Note - 12/29/2020 5:06:36 PM
Y - Posted a small gain today with light volume. The pivot point cited is based on its 11/09/20 high plus 10 cents. Subsequent gains above its pivot point backed by at least +40% above average volume may trigger a new (or add-on) technical buy signal. Its 50 DMA line ($237) has been acting as support. Reported Sep '20 quarterly earnings +38% on +11% sales revenues versus the year ago period, above the +25% minimum earnings guideline (C criteria).
>>> FEATURED STOCK ARTICLE : CRL Consolidating Above 50-Day Moving Average Line - 12/14/2020 |
View all notes |
Set NEW NOTE alert |
Company Profile |
SEC
News |
Chart |
Request a new note
C
A
S
I |
AMD
-
NASDAQ
Advanced Micro Devices
ELECTRONICS - Semiconductor - Broad Line
|
$90.62
|
-0.98
-1.07% |
$92.46
|
31,666,888
68.61% of 50 DAV
50 DAV is 46,154,000
|
$97.98
-7.51%
|
11/18/2020
|
$82.54
|
PP = $88.72
|
|
MB = $93.16
|
Most Recent Note - 12/28/2020 5:32:20 PM
Y - Color code is changed to yellow after recently pulling back below its "max buy" level. Its 50 DMA line ($86.36) defines important near term support to watch on pullbacks.
>>> FEATURED STOCK ARTICLE : Pulling Back From its Record High Hit Last Week - 12/21/2020 |
View all notes |
Set NEW NOTE alert |
Company Profile |
SEC
News |
Chart |
Request a new note
C
A
S
I |
TER
-
NASDAQ
Teradyne Inc
ELECTRONICS - Semiconductor Equipment and Mate
|
$117.20
|
-0.53
-0.45% |
$119.07
|
956,783
62.29% of 50 DAV
50 DAV is 1,536,000
|
$122.37
-4.22%
|
10/21/2020
|
$92.22
|
PP = $93.54
|
|
MB = $98.22
|
Most Recent Note - 12/28/2020 5:24:33 PM
G - Still perched near its all-time high, stubbornly holding its ground with volume totals cooling. Support to watch on pullbacks is its 50 DMA line ($105).
>>> FEATURED STOCK ARTICLE : Stubbornly Holding Ground and Rising for a New High - 12/7/2020 |
View all notes |
Set NEW NOTE alert |
Company Profile |
SEC
News |
Chart |
Request a new note
C
A
S
I |
AMRC
-
NYSE
Ameresco Inc Cl A
ENERGY - Alternative
|
$50.84
|
-0.73
-1.42% |
$52.00
|
409,082
107.37% of 50 DAV
50 DAV is 381,000
|
$54.79
-7.21%
|
12/15/2020
|
$46.72
|
PP = $47.10
|
|
MB = $49.46
|
Most Recent Note - 12/29/2020 5:14:03 PM
G - Sputtered below its "max buy" level today but closed in the upper half of its intra-day range. Prior highs in the $46-47 area define initial support to watch on pullbacks.
>>> FEATURED STOCK ARTICLE : Gain From Ascending Base Pattern Backed by Above Average Volume - 12/15/2020 |
View all notes |
Set NEW NOTE alert |
Company Profile |
SEC
News |
Chart |
Request a new note
C
A
S
I |
TREX
-
NYSE
Trex Company Inc
MATERIALS and CONSTRUCTION - General Building Materials
|
$82.80
|
-0.76
-0.91% |
$84.18
|
481,822
63.15% of 50 DAV
50 DAV is 763,000
|
$87.88
-5.78%
|
6/26/2020
|
$54.53
|
PP = $66.47
|
|
MB = $69.79
|
Most Recent Note - 12/28/2020 5:25:53 PM
G - There was a "negative reversal" today after hitting yet another new 52-week high. Its 50 DMA line ($76) defines near-term support. Recently noted that it reported Sep '20 quarterly earnings +14% on +19% sales revenues versus the year ago period, below the +25% minimum guideline (C criteria) raising fundamental concerns.
>>> FEATURED STOCK ARTICLE : Hit New High With Light Volume Behind 4th Consecutive Gain - 12/22/2020 |
View all notes |
Set NEW NOTE alert |
Company Profile |
SEC
News |
Chart |
Request a new note
C
A
S
I |
Symbol/Exchange
Company Name
Industry Group |
PRICE |
CHANGE
(%Change) |
Day High |
Volume
(% DAV)
(% 50 day avg vol) |
52 Wk Hi
% From Hi |
Featured
Date |
Price
Featured |
Pivot Featured |
|
Max Buy |
CLFD
-
NASDAQ
Clearfield Inc
TELECOMMUNICATIONS - Cables / Satalite Equipment
|
$24.45
|
-1.09
-4.27% |
$25.54
|
72,720
72.00% of 50 DAV
50 DAV is 101,000
|
$28.32
-13.67%
|
11/17/2020
|
$22.06
|
PP = $26.07
|
|
MB = $27.37
|
Most Recent Note - 12/29/2020 3:41:59 PM
Y - Slumping further below the pivot point with today's big loss on below average volume. Near term support is defined by its 50 DMA line ($23.57) and an upward trendline. Churned higher volume in recent weeks without making meaningful price progress, action indicative of distributional pressure.
>>> FEATURED STOCK ARTICLE : Perched Near Pivot Point in Need of Confirming Gain on Volume - 12/10/2020 |
View all notes |
Set NEW NOTE alert |
Company Profile |
SEC
News |
Chart |
Request a new note
C
A
S
I |
NOW
-
NYSE
Servicenow Inc
Computer Sftwr-Enterprse
|
$545.98
|
+2.24
0.41% |
$551.63
|
925,122
68.73% of 50 DAV
50 DAV is 1,346,000
|
$566.74
-3.66%
|
8/20/2020
|
$453.34
|
PP = $454.79
|
|
MB = $477.53
|
Most Recent Note - 12/29/2020 5:08:13 PM
G - Volume totals have been cooling while still hovering near its all-time high. Found prompt support near its 50 DMA line ($522) and stubbornly held its ground in recent weeks. Recently reported Sep '20 quarterly earnings +22% on +30% sales revenues versus the year ago period, below the +25% minimum guideline (C criteria) of the fact-based investment system.
>>> FEATURED STOCK ARTICLE : Hit New Record High With Light Volume Behind Gain - 12/17/2020 |
View all notes |
Set NEW NOTE alert |
Company Profile |
SEC
News |
Chart |
Request a new note
C
A
S
I |
SMPL
-
NASDAQ
Simply Good Foods Co
Food-Confectionery
|
$29.75
|
-0.53
-1.75% |
$30.61
|
1,337,967
98.52% of 50 DAV
50 DAV is 1,358,000
|
$30.75
-3.25%
|
12/28/2020
|
$30.40
|
PP = $31.44
|
|
MB = $33.01
|
Most Recent Note - 12/28/2020 5:23:24 PM
Y - Color code was changed to yellow with pivot point cited based on its 9/09/19 high plus 10 cents. Subsequent gains above its pivot point backed by at least +40% above average volume may trigger a technical buy signal. Gapped up last week and rallied further on news it was added to the S&P 600 Small Cap Index. Completed a new Pubic Offering on 10/09/19. Reported earnings +33% on +60% sales revenues for the Aug '20 quarter versus the year ago period, its 3rd consecutive quarterly comparison above the +25% minimum earnings guideline (C criteria). Annual earnings history (A criteria) has been strong. See the latest FSU analysis for more details and a new annotated graph.
>>> FEATURED STOCK ARTICLE : Challenging All-Time High as it Joins Small Cap Index - 12/28/2020 |
View all notes |
Set NEW NOTE alert |
Company Profile |
SEC
News |
Chart |
Request a new note
C
A
S
I |
ALRM
-
NASDAQ
Alarm.com Holdings Inc
Security/Sfty
|
$100.23
|
-3.00
-2.91% |
$103.31
|
1,030,414
255.69% of 50 DAV
50 DAV is 403,000
|
$103.52
-3.18%
|
11/6/2020
|
$71.88
|
PP = $74.76
|
|
MB = $78.50
|
Most Recent Note - 12/28/2020 5:30:17 PM
G - Hit yet another new all-time high with today's gain backed by average volume, getting very extended from any sound base. Prior high ($74.66 on 7/23/20) defines initial support to watch above its 50 DMA line ($73.62).
>>> FEATURED STOCK ARTICLE : Perched at High After Impressive Streak of Gains - 12/24/2020 |
View all notes |
Set NEW NOTE alert |
Company Profile |
SEC
News |
Chart |
Request a new note
C
A
S
I |
TEAM
-
NASDAQ
Atlassian Corp Plc Cl A
Comp Sftwr-Spec Enterprs
|
$233.15
|
+1.35
0.58% |
$234.99
|
648,296
33.25% of 50 DAV
50 DAV is 1,950,000
|
$250.03
-6.75%
|
10/12/2020
|
$193.77
|
PP = $199.60
|
|
MB = $209.58
|
Most Recent Note - 12/29/2020 5:12:44 PM
G - Extended from any sound base, consolidating above its prior high and 50 DMA line which define near-term support in the $115-116 area. Showed resilience and strength after earnings rose +7% on +26% sales revenues for the Sep '20 quarter versus the year ago period, below the +25% minimum earnings guideline (C criteria), raising concerns.
>>> FEATURED STOCK ARTICLE : Extended From Any Base After Streak of Gains for New Highs - 12/18/2020 |
View all notes |
Set NEW NOTE alert |
Company Profile |
SEC
News |
Chart |
Request a new note
C
A
S
I |
Symbol/Exchange
Company Name
Industry Group |
PRICE |
CHANGE
(%Change) |
Day High |
Volume
(% DAV)
(% 50 day avg vol) |
52 Wk Hi
% From Hi |
Featured
Date |
Price
Featured |
Pivot Featured |
|
Max Buy |
SHOP
-
NYSE
Shopify Inc Cl A
Computer Sftwr-Enterprse
|
$1,171.61
|
+24.55
2.14% |
$1,200.45
|
1,418,823
92.85% of 50 DAV
50 DAV is 1,528,000
|
$1,285.19
-8.84%
|
12/16/2020
|
$1,146.00
|
PP = $1,147.01
|
|
MB = $1,204.36
|
Most Recent Note - 12/28/2020 12:41:22 PM
Y - Color code is changed to yellow after slumping below its "max buy" level with today's pullback. After spiking to new all-time highs with volume-driven gains, the prior highs in the $1,146-1,130 area define initial support to watch above its 50 DMA line ($1,039).. Reported Sep '20 quarterly earnings of $1.13 per share versus a loss of 29 cents per share on +96% sales revenues versus the year ago period. The Ontario, Canada-based Computer Software - Enterprise firm's prior quarters showed big earnings and sales revenues growth. After years of losses it had strong earnings growth in FY '17-19 (A criteria).
>>> FEATURED STOCK ARTICLE : Volume-Driven Gain for New High After Long Consolidation - 12/16/2020 |
View all notes |
Set NEW NOTE alert |
Company Profile |
SEC
News |
Chart |
Request a new note
C
A
S
I |
YETI
-
NYSE
Yeti Holdings Inc
Leisure-Products
|
$68.77
|
-1.05
-1.50% |
$70.55
|
838,439
69.70% of 50 DAV
50 DAV is 1,203,000
|
$74.82
-8.09%
|
11/5/2020
|
$57.25
|
PP = $55.14
|
|
MB = $57.90
|
Most Recent Note - 12/29/2020 5:04:21 PM
G - Slumped for a 2nd consecutive loss today after quietly wedging to new all-time highs with recent gains lacking great volume conviction. Its 50 DMA line ($61.03) defines initial support to watch above prior highs in the $55-54 area. See the latest FSU analysis for more details and a new annotated graph.
>>> FEATURED STOCK ARTICLE : Pulling Back After Recently Wedging to New Highs - 12/29/2020 |
View all notes |
Set NEW NOTE alert |
Company Profile |
SEC
News |
Chart |
Request a new note
C
A
S
I |
AAXN
-
NASDAQ
Axon Enterprise Inc
Security/Sfty
|
$123.33
|
-1.83
-1.46% |
$126.61
|
601,314
110.74% of 50 DAV
50 DAV is 543,000
|
$134.73
-8.46%
|
12/22/2020
|
$127.84
|
PP = $130.51
|
|
MB = $137.04
|
Most Recent Note - 12/28/2020 5:28:41 PM
Y - Slumped for a big loss today with below average volume. Color code was changed to yellow after a 4-week square box base pattern as it was noted - "A solid gain and close above the pivot point backed by at least +40% above average volume may trigger a new (or add-on) technical buy signal. Its 50 DMA line ($116.42) defines near term support to watch on pullbacks. Recently reported Sep '20 quarterly earnings +43% on +27% sales revenues versus the year ago period."
>>> FEATURED STOCK ARTICLE : New All-Time High With Today's 5th Consecutive Gain - 12/23/2020 |
View all notes |
Set NEW NOTE alert |
Company Profile |
SEC
News |
Chart |
Request a new note
C
A
S
I |
QTWO
-
NYSE
Q2 Holdings Inc
Computer Sftwr-Financial
|
$125.57
|
-1.36
-1.07% |
$128.32
|
233,475
54.30% of 50 DAV
50 DAV is 430,000
|
$130.59
-3.84%
|
11/12/2020
|
$105.14
|
PP = $106.54
|
|
MB = $111.87
|
Most Recent Note - 12/29/2020 5:10:13 PM
G - Pulled back with lighter volume for a 4th consecutive small loss today, still hovering near its all-time high. Its 50 DMA line ($109.62) and prior high in the $106 area define important near term support to watch.
>>> FEATURED STOCK ARTICLE : Computer Software - Financial Firm Hovering Near Record High - 12/8/2020 |
View all notes |
Set NEW NOTE alert |
Company Profile |
SEC
News |
Chart |
Request a new note
C
A
S
I |
|
|
|
THESE ARE NOT BUY RECOMMENDATIONS!
Comments contained in the body of this report are technical
opinions only. The material herein has been obtained
from sources believed to be reliable and accurate, however,
its accuracy and completeness cannot be guaranteed.
This site is not an investment advisor, hence it does
not endorse or recommend any securities or other investments.
Any recommendation contained in this report may not
be suitable for all investors and it is not to be deemed
an offer or solicitation on our part with respect to
the purchase or sale of any securities. All trademarks,
service marks and trade names appearing in this report
are the property of their respective owners, and are
likewise used for identification purposes only.
This report is a service available
only to active Paid Premium Members.
You may opt-out of receiving report notifications
at any time. Questions or comments may be submitted
by writing to Premium Membership Services 665 S.E. 10 Street, Suite 201 Deerfield Beach, FL 33441-5634 or by calling 1-800-965-8307
or 954-785-1121.
|
|
|