You are not logged in.
This means you
CAN ONLY VIEW reports that were published prior to Thursday, March 20, 2025.
You
MUST UPGRADE YOUR MEMBERSHIP if you want to see any current reports.
AFTER MARKET UPDATE - MONDAY, DECEMBER 14TH, 2020
Previous After Market Report Next After Market Report >>>
|
|
|
|
DOW |
-184.82 |
29,861.55 |
-0.62% |
|
Volume |
1,029,912,233 |
+13% |
|
Volume |
4,429,421,100 |
+5% |
|
NASDAQ |
+61.98 |
12,439.85 |
+0.50% |
|
Advancers |
1,236 |
39% |
|
Advancers |
1,812 |
50% |
|
S&P 500 |
-15.97 |
3,647.49 |
-0.44% |
|
Decliners |
1,916 |
61% |
|
Decliners |
1,835 |
50% |
|
Russell 2000 |
+2.16 |
1,913.86 |
+0.11% |
|
52 Wk Highs |
221 |
|
|
52 Wk Highs |
337 |
|
|
S&P 600 |
-3.54 |
1,083.05 |
-0.33% |
|
52 Wk Lows |
2 |
|
|
52 Wk Lows |
15 |
|
|
 |
Leadership Improved While Nasdaq Composite Outpaced Peers Again
Kenneth J. Gruneisen - Passed the CAN SLIM® Master's Exam
After climbing as much as 250 points earlier in the day, the Dow finished 184 points lower. The S&P 500 slipped 0.4%, while the Nasdaq Composite climbed 0.5% as Technology and Consumer Discretionary stocks outperformed. The volume totals Monday were higher than the prior session on the NYSE and on the Nasdaq exchange. Decliners led advancers by a 3-2 margin on the NYSE while the mix was nearly even on the Nasdaq exchange. There were 69 high-ranked companies from the Leaders List that hit new 52-week highs and were listed on the BreakOuts Page, versus the total of 40 on the prior session. New 52-week highs totals expanded and solidly outnumbered new 52-week lows totals on both exchanges. The major indices are in a confirmed uptrend (M criteria). Investors are reminded to always make buying and selling decisions based based on the strict criteria and rules of the fact-based investment system.  PICTURED: The S&P 600 Small Cap Index recently hit a new record high.
Stocks were mixed on Monday, as investors assessed fiscal stimulus developments and weighed vaccine optimism against lingering coronavirus concerns. Equities opened higher on news that a group of bipartisan lawmakers is expected to unveil a two-part, $908 billion coronavirus relief measure, which aims to separate key partisan stumbling blocks from the main bill. Meanwhile, news that Pfizer (PFE -4.64%) began the rollout of its FDA-approved COVID-19 vaccine was tempered by further lockdown restrictions across the U.S. and Europe.
Nine of 11 S&P 500 sectors finished lower, with Energy stocks lagging following an OPEC report which predicted softer crude demand in 2021. A flurry of M&A deals headlined the corporate news flow on Monday. AstraZeneca (AZN -7.81%) fell after agreeing to buy Alexion Pharmaceuticals (ALXN +29.20%) for $39 billion. Electronic Arts (EA +1.28%) rose after announcing a deal to acquire U.K. videogame maker Codemaster for $1.2 billion. Finally, TCF Financial (TCF +6.24%) after accepting a $6 billion offer from Huntington Bancshares (HBAN -3.25%) .
The data docket was light Monday, leaving investors looking ahead to the Federal Reserve’s final meeting of 2020, which is set to conclude on Wednesday. Treasuries fluctuated throughout the session, with the yield on the benchmark 10-year note ultimately finishing flat at 0.90%. |
 Kenneth J. Gruneisen started out as a licensed stockbroker in August 1987, a couple of months prior to the historic stock market crash that took the Dow Jones Industrial Average down -22.6% in a single day. He has published daily fact-based fundamental and technical analysis on high-ranked stocks online for two decades. Through FACTBASEDINVESTING.COM, Kenneth provides educational articles, news, market commentary, and other information regarding proven investment systems that work in good times and bad.
Comments contained in the body of this report are technical opinions only and are not necessarily those of Gruneisen Growth Corp. The material herein has been obtained from sources believed to be reliable and accurate, however, its accuracy and completeness cannot be guaranteed. Our firm, employees, and customers may effect transactions, including transactions contrary to any recommendation herein, or have positions in the securities mentioned herein or options with respect thereto. Any recommendation contained in this report may not be suitable for all investors and it is not to be deemed an offer or solicitation on our part with respect to the purchase or sale of any securities. |
|
 |
Financial and Commodity-Linked Groups Fell
Kenneth J. Gruneisen - Passed the CAN SLIM® Master's Exam
The Retail Index ($RLX +0.73%) posted a modest gain but losses for the Broker/Dealer Index ($XBD -1.09%) and Bank Index ($BKX -1.57%) created a drag on the major indices. The Biotech Index ($BTK +3.42%) led the tech sector higher while the Semiconductor Index ($SOX +1.18%) posted a smaller gain and the Networking Index ($NWX +0.26%) inched higher. Commodity-linked groups clearly had a negative bias as the Oil Services Index ($OSX -2.84%) and Integrated Oil Index ($XOI -3.57%) both outpaced the Gold & Silver Index ($XAU -2.35%) to the downside.
PICTURED: The Networking Index ($NWX +0.26%) hit a new record high.
| Oil Services |
$OSX |
44.92 |
-1.31 |
-2.84% |
-42.62% |
| Integrated Oil |
$XOI |
809.02 |
-29.91 |
-3.57% |
-36.32% |
| Semiconductor |
$SOX |
2,736.01 |
+31.93 |
+1.18% |
+47.92% |
| Networking |
$NWX |
677.07 |
+1.73 |
+0.26% |
+16.05% |
| Broker/Dealer |
$XBD |
356.41 |
-3.91 |
-1.09% |
+22.74% |
| Retail |
$RLX |
3,465.41 |
+25.05 |
+0.73% |
+41.49% |
| Gold & Silver |
$XAU |
135.35 |
-3.26 |
-2.35% |
+26.59% |
| Bank |
$BKX |
92.72 |
-1.47 |
-1.57% |
-18.21% |
| Biotech |
$BTK |
5,731.85 |
+189.44 |
+3.42% |
+13.11% |
|
|
|
 |
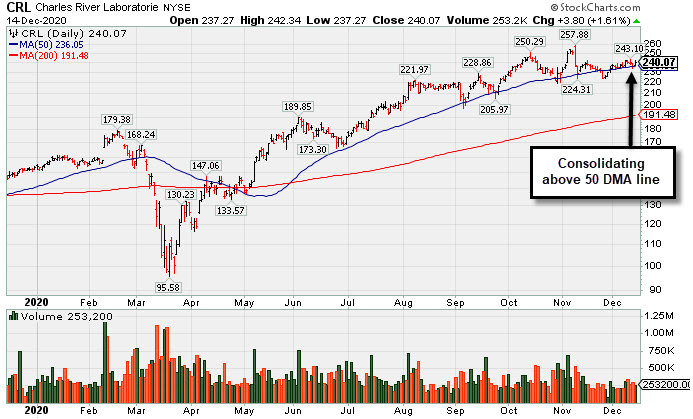
CRL Consolidating Above 50-Day Moving Average Line
Kenneth J. Gruneisen - Passed the CAN SLIM® Master's Exam
Charles River Labs Intl (CRL +$3.80 or +1.61% to $240.07) has been consolidating above its 50-day moving average (DMA) line ($236) which has been acting as support. More damaging losses would raise greater concerns and may trigger worrisome technical sell signals. There was a noted "negative reversal" at its all-time high on 11/09/20.
CRL reported Sep '20 quarterly earnings +38% on +11% sales revenues versus the year ago period, above the +25% minimum earnings guideline (C criteria). Fundamental concerns had been raised when it reported Jun '20 quarterly earnings -3% on +4% sales revenues, below the +25% minimum guideline (C criteria), but the results were better than expected and the company also raised its guidance. It now has a 91 Earnings Per Share Rating, down from 96 prior to the report. The 2 prior quarterly earnings increases were above the +25% minimum guideline (C criteria) of the fact-based investment system. Annual earnings (A criteria) history has been strong and steady.
CRL traded up as much as +29.9% since it was highlighted in yellow with pivot point cited based on its 6/03/20 high plus 10 cents in the 7/15/20 mid-day report (read here). It was last shown in this FSU section on 11/23/20 with an annotated graph under the headline, "Consolidating Near Important Support Levels".
It hails from the Medical - Research Equipment/Services industry group which has an 69 Group Relative Strength Rating (L criteria). The number of top-rated funds owning its shares rose from 681 in Dec '19 to 795 in Sep '20, and its Up/Down Volume Ratio is 0.8 is an unbiased indication its shares have been under distributional pressure over the past 50 days. There is a small number of only 49.7 million shares (S criteria) outstanding, which can contribute to greater price volatility in the event of institutional buying or selling.
|
|
|
Color Codes Explained :
Y - Better candidates highlighted by our
staff of experts.
G - Previously featured
in past reports as yellow but may no longer be buyable under the
guidelines.
***Last / Change / Volume data in this table is the closing quote data***
Symbol/Exchange
Company Name
Industry Group |
PRICE |
CHANGE
(%Change) |
Day High |
Volume
(% DAV)
(% 50 day avg vol) |
52 Wk Hi
% From Hi |
Featured
Date |
Price
Featured |
Pivot Featured |
|
Max Buy |
 CRL
-
NYSE
CRL
-
NYSE
Charles River Labs Intl
DRUGS - Biotechnology
|
$240.07
|
+3.80
1.61% |
$242.34
|
253,200
80.89% of 50 DAV
50 DAV is 313,000
|
$257.88
-6.91%
|
7/15/2020
|
$192.66
|
PP = $189.95
|
|
MB = $199.45
|
 Most Recent Note - 12/14/2020 4:55:53 PM
G - Still consolidating above its 50 DMA line ($236) which has been acting as support. Reported Sep '20 quarterly earnings +38% on +11% sales revenues versus the year ago period, above the +25% minimum earnings guideline (C criteria). See the latest FSU analysis for more details and a new annotated graph.
>>> FEATURED STOCK ARTICLE : CRL Consolidating Above 50-Day Moving Average Line - 12/14/2020 |
View all notes |
Set NEW NOTE alert |
Company Profile |
SEC
News |
Chart |
Request a new note
C
A
S
I |
AMD
-
NASDAQ
Advanced Micro Devices
ELECTRONICS - Semiconductor - Broad Line
|
$94.78
|
+3.13
3.42% |
$95.41
|
46,903,144
96.82% of 50 DAV
50 DAV is 48,446,000
|
$96.37
-1.65%
|
11/18/2020
|
$82.54
|
PP = $88.72
|
|
MB = $93.16
|
Most Recent Note - 12/14/2020 5:03:50 PM
G - Posted a big gain today with near average volume for a best-ever close. Its 50 DMA line ($84.67) defines important near term support to watch on pulllbacks.
>>> FEATURED STOCK ARTICLE : Volume Heavy Behind AMD's Breakout from Double Bottom Base - 11/30/2020 |
View all notes |
Set NEW NOTE alert |
Company Profile |
SEC
News |
Chart |
Request a new note
C
A
S
I |
TER
-
NASDAQ
Teradyne Inc
ELECTRONICS - Semiconductor Equipment and Mate
|
$117.18
|
+1.81
1.57% |
$118.21
|
1,255,436
82.76% of 50 DAV
50 DAV is 1,517,000
|
$118.96
-1.50%
|
10/21/2020
|
$92.22
|
PP = $93.54
|
|
MB = $98.22
|
Most Recent Note - 12/14/2020 5:00:16 PM
G - Posted a small gain today with below average volume, hovering near its all-time high. Support to watch on pullbacks is its 50 DMA line ($99) and prior highs in the $93 area.
>>> FEATURED STOCK ARTICLE : Stubbornly Holding Ground and Rising for a New High - 12/7/2020 |
View all notes |
Set NEW NOTE alert |
Company Profile |
SEC
News |
Chart |
Request a new note
C
A
S
I |
TREX
-
NYSE
Trex Company Inc
MATERIALS and CONSTRUCTION - General Building Materials
|
$79.65
|
+1.99
2.56% |
$81.04
|
957,139
130.76% of 50 DAV
50 DAV is 732,000
|
$81.23
-1.95%
|
6/26/2020
|
$54.53
|
PP = $66.47
|
|
MB = $69.79
|
Most Recent Note - 12/9/2020 12:40:35 PM
G - Gapped up today and it is perched within striking distance of its 52-week high. Its 50 DMA line ($74.56) defines near-term support. Recently noted that it reported Sep '20 quarterly earnings +14% on +19% sales revenues versus the year ago period, below the +25% minimum guideline (C criteria) raising fundamental concerns.
>>> FEATURED STOCK ARTICLE : Consolidating Back Above 50-Day Moving Average Line - 12/1/2020 |
View all notes |
Set NEW NOTE alert |
Company Profile |
SEC
News |
Chart |
Request a new note
C
A
S
I |
CLFD
-
NASDAQ
Clearfield Inc
TELECOMMUNICATIONS - Cables / Satalite Equipment
|
$26.43
|
+1.01
3.97% |
$28.32
|
324,530
352.75% of 50 DAV
50 DAV is 92,000
|
$26.54
-0.41%
|
11/17/2020
|
$22.06
|
PP = $26.07
|
|
MB = $27.37
|
Most Recent Note - 12/14/2020 12:34:22 PM
Y - Hitting a new 52-week high and trading above its "max buy" level earlier with today's big volume-driven gain triggering a technical buy signal. Near term support is defined by its 50 DMA line ($23.10) and an upward trendline.
>>> FEATURED STOCK ARTICLE : Perched Near Pivot Point in Need of Confirming Gain on Volume - 12/10/2020 |
View all notes |
Set NEW NOTE alert |
Company Profile |
SEC
News |
Chart |
Request a new note
C
A
S
I |
Symbol/Exchange
Company Name
Industry Group |
PRICE |
CHANGE
(%Change) |
Day High |
Volume
(% DAV)
(% 50 day avg vol) |
52 Wk Hi
% From Hi |
Featured
Date |
Price
Featured |
Pivot Featured |
|
Max Buy |
NOW
-
NYSE
Servicenow Inc
Computer Sftwr-Enterprse
|
$532.48
|
-4.88
-0.91% |
$539.11
|
1,126,665
86.00% of 50 DAV
50 DAV is 1,310,000
|
$545.00
-2.30%
|
8/20/2020
|
$453.34
|
PP = $454.79
|
|
MB = $477.53
|
Most Recent Note - 12/14/2020 4:57:57 PM
G - Holding its ground stubbornly near its all-time high after finding prompt support near its 50 DMA line. Recently reported Sep '20 quarterly earnings +22% on +30% sales revenues versus the year ago period, below the +25% minimum guideline (C criteria) of the fact-based investment system.
>>> FEATURED STOCK ARTICLE : Consolidating Above 50-Day Average Still Perched Near All-Time High - 11/24/2020 |
View all notes |
Set NEW NOTE alert |
Company Profile |
SEC
News |
Chart |
Request a new note
C
A
S
I |
ALRM
-
NASDAQ
Alarm.com Holdings Inc
Security/Sfty
|
$78.23
|
+0.38
0.49% |
$79.33
|
231,960
68.02% of 50 DAV
50 DAV is 341,000
|
$80.99
-3.41%
|
11/6/2020
|
$71.88
|
PP = $74.76
|
|
MB = $78.50
|
Most Recent Note - 12/10/2020 5:29:42 PM
G - Overcame early weakness and managed a "positive reversal" today, posting a gain with light volume. Perched near its all-time high stubbornly holding its ground. Prior high ($74.66 on 7/23/20) defnes initial support to watch above its 50 DMA line.
>>> FEATURED STOCK ARTICLE : Alarm Hits a New Record High - 12/4/2020 |
View all notes |
Set NEW NOTE alert |
Company Profile |
SEC
News |
Chart |
Request a new note
C
A
S
I |
TEAM
-
NASDAQ
Atlassian Corp Plc Cl A
Comp Sftwr-Spec Enterprs
|
$234.74
|
+2.73
1.18% |
$240.70
|
2,015,999
106.89% of 50 DAV
50 DAV is 1,886,000
|
$235.17
-0.18%
|
10/12/2020
|
$193.77
|
PP = $199.60
|
|
MB = $209.58
|
Most Recent Note - 12/11/2020 5:02:22 PM
G - Extended from any sound base, it posted another gain with below average volume today for a best-ever close. Reported earnings +7% on +26% sales revenues for the Sep '20 quarter versus the year ago period, well below the +25% minimum earnings guideline (C criteria), raising concerns.
>>> FEATURED STOCK ARTICLE : Quiet Volume Behind Gain Today for a New All-Time High - 11/27/2020 |
View all notes |
Set NEW NOTE alert |
Company Profile |
SEC
News |
Chart |
Request a new note
C
A
S
I |
YETI
-
NYSE
Yeti Holdings Inc
Leisure-Products
|
$70.81
|
+2.55
3.74% |
$71.34
|
1,235,880
99.91% of 50 DAV
50 DAV is 1,237,000
|
$72.06
-1.73%
|
11/5/2020
|
$57.25
|
PP = $55.14
|
|
MB = $57.90
|
Most Recent Note - 12/14/2020 5:05:18 PM
G - Posted a big gain today with lighter volume while hovering near its all-time high. Its 50 DMA line ($56.73) and prior highs in the $55-54 area define important near-term support to watch on pullbacks.
>>> FEATURED STOCK ARTICLE : Volume Totals Cooloing While Stubbornly Holding Ground at High - 12/2/2020 |
View all notes |
Set NEW NOTE alert |
Company Profile |
SEC
News |
Chart |
Request a new note
C
A
S
I |
AAXN
-
NASDAQ
Axon Enterprise Inc
Security/Sfty
|
$127.24
|
+4.12
3.35% |
$129.80
|
917,247
179.15% of 50 DAV
50 DAV is 512,000
|
$130.41
-2.43%
|
11/6/2020
|
$122.75
|
PP = $113.00
|
|
MB = $118.65
|
Most Recent Note - 12/14/2020 5:02:37 PM
G - Posted a gain today with above average volume challenging its all-time high. Its 50 DMA line ($112.91) defines near term support to watch on pullbacks. Recently reported Sep '20 quarterly earnings +43% on +27% sales revenues versus the year ago period.
>>> FEATURED STOCK ARTICLE : Volume Totals Cooling While Hovering Near All-Time High - 12/3/2020 |
View all notes |
Set NEW NOTE alert |
Company Profile |
SEC
News |
Chart |
Request a new note
C
A
S
I |
Symbol/Exchange
Company Name
Industry Group |
PRICE |
CHANGE
(%Change) |
Day High |
Volume
(% DAV)
(% 50 day avg vol) |
52 Wk Hi
% From Hi |
Featured
Date |
Price
Featured |
Pivot Featured |
|
Max Buy |
QTWO
-
NYSE
Q2 Holdings Inc
Computer Sftwr-Financial
|
$120.09
|
+3.23
2.76% |
$121.11
|
839,034
206.15% of 50 DAV
50 DAV is 407,000
|
$119.97
0.10%
|
11/12/2020
|
$105.14
|
PP = $106.54
|
|
MB = $111.87
|
Most Recent Note - 12/14/2020 4:59:00 PM
G - Posted a solid gain today with above average volume hitting a new all-time high. Prior high in the $106 area and its 50 DMA line ($104) define important near term suport to watch on pullbacks.
>>> FEATURED STOCK ARTICLE : Computer Software - Financial Firm Hovering Near Record High - 12/8/2020 |
View all notes |
Set NEW NOTE alert |
Company Profile |
SEC
News |
Chart |
Request a new note
C
A
S
I |
|
|
|
THESE ARE NOT BUY RECOMMENDATIONS!
Comments contained in the body of this report are technical
opinions only. The material herein has been obtained
from sources believed to be reliable and accurate, however,
its accuracy and completeness cannot be guaranteed.
This site is not an investment advisor, hence it does
not endorse or recommend any securities or other investments.
Any recommendation contained in this report may not
be suitable for all investors and it is not to be deemed
an offer or solicitation on our part with respect to
the purchase or sale of any securities. All trademarks,
service marks and trade names appearing in this report
are the property of their respective owners, and are
likewise used for identification purposes only.
This report is a service available
only to active Paid Premium Members.
You may opt-out of receiving report notifications
at any time. Questions or comments may be submitted
by writing to Premium Membership Services 665 S.E. 10 Street, Suite 201 Deerfield Beach, FL 33441-5634 or by calling 1-800-965-8307
or 954-785-1121.
|
|
|