You are not logged in.
This means you
CAN ONLY VIEW reports that were published prior to Thursday, March 20, 2025.
You
MUST UPGRADE YOUR MEMBERSHIP if you want to see any current reports.
AFTER MARKET UPDATE - THURSDAY, DECEMBER 24TH, 2020
Previous After Market Report Next After Market Report >>>
|
|
|
|
DOW |
+70.04 |
30,199.87 |
+0.23% |
|
Volume |
381,099,662 |
-53% |
|
Volume |
3,243,164,400 |
-54% |
|
NASDAQ |
+34.10 |
12,805.22 |
+0.27% |
|
Advancers |
1,887 |
61% |
|
Advancers |
1,779 |
48% |
|
S&P 500 |
+13.05 |
3,703.06 |
+0.35% |
|
Decliners |
1,207 |
39% |
|
Decliners |
1,906 |
52% |
|
Russell 2000 |
-3.16 |
2,003.95 |
-0.16% |
|
52 Wk Highs |
191 |
|
|
52 Wk Highs |
257 |
|
|
S&P 600 |
-0.23 |
1,121.51 |
-0.02% |
|
52 Wk Lows |
2 |
|
|
52 Wk Lows |
8 |
|
|
 |
Major Indices Inched Higher on Shortened Christmas Eve Session
Kenneth J. Gruneisen - Passed the CAN SLIM® Master's Exam
The Dow added 70 points, while the S&P 500 gained 0.4%. The Nasdaq Composite rose 0.3%. Thursday's shortened-session volume totals were lighter than the prior session on the NYSE and on the Nasdaq exchange. Advancers led decliners by a 3-2 margin on the NYSE while decliners narrowly outnumbered advancers on the Nasdaq exchange. There were 33 high-ranked companies from the Leaders List that hit new 52-week highs and were listed on the BreakOuts Page, versus the total of 80 on the prior session. New 52-week highs totals contracted yet solidly outnumbered the new 52-week lows totals which were in the single digits on both exchanges. The major indices are in a confirmed uptrend (M criteria). Investors are reminded to always make buying and selling decisions based based on the strict criteria and rules of the fact-based investment system. 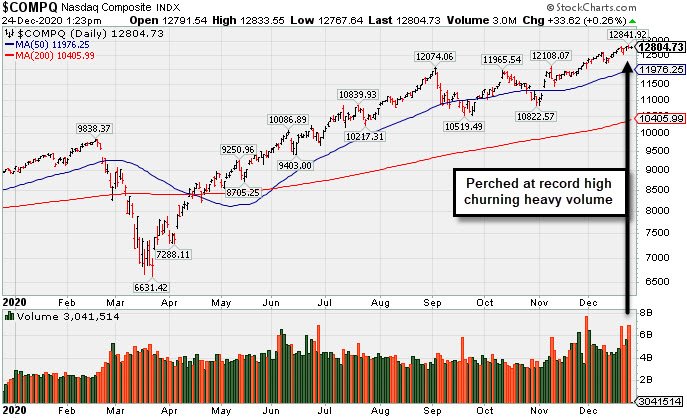 PICTURED: The Nasdaq Composite Index is perched at its record high churning heavy volume.
Stocks finished higher during an abbreviated trading session before the holiday weekend. U.S equity markets and most global bourses will be closed for Christmas Day tomorrow. Geopolitical updates remained in focus, as the EU and the U.K. secured a highly-anticipated and long-discussed post-Brexit trade deal. Investors also kept tabs on fiscal stimulus updates, after President Trump raised the possibility that he may veto the bipartisan federal spending bill that was expected to fund the government through next September and included the fifth coronavirus relief measure.
Despite the gains, the S&P 500 posted a 0.2% weekly decline. The Dow ended the holiday-shortened week just above the flat line, while the Nasdaq Composite outperformed with a 0.4% advance. There were no notable domestic economic releases today. Treasuries advanced modestly, with the yield on the benchmark 10-year note down two basis points to 0.92%. In commodities, gold rose 0.3% to $1,879.90/ounce amid a weaker dollar.
Ten of 11 S&P 500 sectors ended in positive territory, with the Information Technology group pacing the gains. The Energy group was the lone laggard, with WTI crude posting its first weekly decline in nearly two months. In corporate news, U.S.-listed shares of Chinese eCommerce giant Alibaba (BABA -13.21%) fell after government regulators in Beijing launched an antitrust probe into the company. |
 Kenneth J. Gruneisen started out as a licensed stockbroker in August 1987, a couple of months prior to the historic stock market crash that took the Dow Jones Industrial Average down -22.6% in a single day. He has published daily fact-based fundamental and technical analysis on high-ranked stocks online for two decades. Through FACTBASEDINVESTING.COM, Kenneth provides educational articles, news, market commentary, and other information regarding proven investment systems that work in good times and bad.
Comments contained in the body of this report are technical opinions only and are not necessarily those of Gruneisen Growth Corp. The material herein has been obtained from sources believed to be reliable and accurate, however, its accuracy and completeness cannot be guaranteed. Our firm, employees, and customers may effect transactions, including transactions contrary to any recommendation herein, or have positions in the securities mentioned herein or options with respect thereto. Any recommendation contained in this report may not be suitable for all investors and it is not to be deemed an offer or solicitation on our part with respect to the purchase or sale of any securities. |
|
 |
Semiconductor Index and Gold & Silver Index Rose
Kenneth J. Gruneisen - Passed the CAN SLIM® Master's Exam
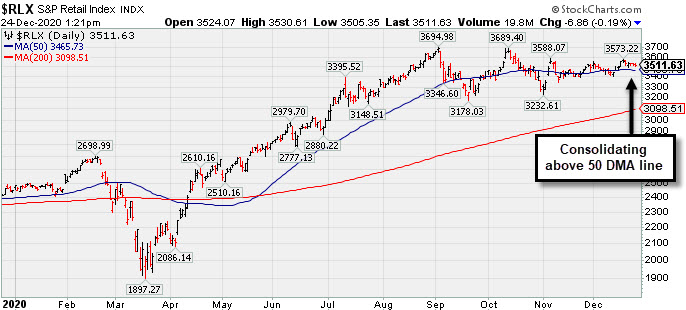
The Semiconductor Index ($SOX +0.98%) led the tech sector while the Networking Index ($NWX +0.07%) finished flat and the Biotech Index ($BTK -0.33%) edged lower. The Broker/Dealer Index ($XBD +0.06%) finished flat while the Bank Index ($BKX -0.45%) and Retail Index ($RLX -0.20%) both edged lower. Commodity-linked groups were mixed as the Oil Services Index ($OSX -1.45%) and Integrated Oil Index ($XOI -0.48%) fell while the Gold & Silver Index ($XAU +0.46%) edged higher.
PICTURED: The Retail Index ($RLX -0.20%) is consolidating above its 50-day moving average (DMA) line. It rallied impressively from the March low, but stalled in early September, and since then it has essentially held its ground.
| Oil Services |
$OSX |
44.16 |
-0.65 |
-1.45% |
-43.60% |
| Integrated Oil |
$XOI |
794.40 |
-3.83 |
-0.48% |
-37.48% |
| Semiconductor |
$SOX |
2,750.19 |
+26.66 |
+0.98% |
+48.69% |
| Networking |
$NWX |
714.47 |
+0.47 |
+0.07% |
+22.46% |
| Broker/Dealer |
$XBD |
377.00 |
+0.24 |
+0.06% |
+29.83% |
| Retail |
$RLX |
3,511.51 |
-6.98 |
-0.20% |
+43.37% |
| Gold & Silver |
$XAU |
143.66 |
+0.65 |
+0.46% |
+34.36% |
| Bank |
$BKX |
96.39 |
-0.43 |
-0.45% |
-14.97% |
| Biotech |
$BTK |
5,936.48 |
-19.37 |
-0.33% |
+17.15% |
|
|
|
 |
Perched at High After Impressive Streak of Gains
Kenneth J. Gruneisen - Passed the CAN SLIM® Master's Exam
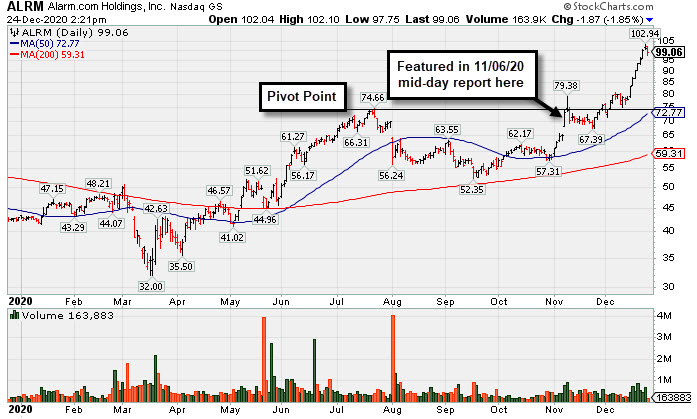
Alarm.com Holdings Inc (ALRM -$2.05 or -2.03% to $98.88) pulled back from its all-time high with today's loss breaking a streak of 8 consecutive gains. It is very extended from any sound base. The prior high ($74.66 on 7/23/20) defines initial support to watch above its 50-day moving average (DMA) line ($72.77). Its gain on 11/30/20 was backed by +74% above average volume as it rallied and closed above the pivot point triggering a technical buy signal.
Recently ALRM reported earnings +32% on +24% sales revenues for the Sep '20 quarter versus the year ago period, an improvement after +3% earnings in the Jun quarter. Prior quarterly comparisons were near or above the +25% minimum earnings guideline (C criteria). Annual earnings (A criteria) growth has been strong, a good match with the fact-based investment system.
ALRM has traded up as much as +42% since it was highlighted in yellow in the 11/06/20 mid-day report (read here). It was last shown in this FSU section on 12/04/20 with an annotated graph under the headline, "Alarm Hits a New Record High". he number of top-rated funds owning its shares rose from 262 in Mar '18 to 409 in Sep '20, a reassuring sign concerning the I criteria. Its current Up/Down Volume Ratio of 2.1 is an unbiased indication its shares have been under accumulation over the past 50 days. It has earned a Timeliness Rating of B and a Sponsorship Rating of D.
Charts courtesy of www.stockcharts.com
 |
|
|
Color Codes Explained :
Y - Better candidates highlighted by our
staff of experts.
G - Previously featured
in past reports as yellow but may no longer be buyable under the
guidelines.
***Last / Change / Volume data in this table is the closing quote data***
Symbol/Exchange
Company Name
Industry Group |
PRICE |
CHANGE
(%Change) |
Day High |
Volume
(% DAV)
(% 50 day avg vol) |
52 Wk Hi
% From Hi |
Featured
Date |
Price
Featured |
Pivot Featured |
|
Max Buy |
 CRL
-
NYSE
CRL
-
NYSE
Charles River Labs Intl
DRUGS - Biotechnology
|
$251.71
|
-0.09
-0.04% |
$252.78
|
150,768
46.97% of 50 DAV
50 DAV is 321,000
|
$257.88
-2.39%
|
12/17/2020
|
$247.06
|
PP = $257.98
|
|
MB = $270.88
|
Most Recent Note - 12/22/2020 5:14:13 PM
Y - Posted a 4th consecutive gain today with light volume for a best ever close. Color code was changed to yellow with new pivot point cited based on its 11/09/20 high plus 10 cents. Subsequent gains above its pivot point backed by at least +40% above average volume may trigger a new (or add-on) technical buy signal. Its 50 DMA line ($237) has been acting as support. Reported Sep '20 quarterly earnings +38% on +11% sales revenues versus the year ago period, above the +25% minimum earnings guideline (C criteria).
>>> FEATURED STOCK ARTICLE : CRL Consolidating Above 50-Day Moving Average Line - 12/14/2020 |
View all notes |
Set NEW NOTE alert |
Company Profile |
SEC
News |
Chart |
Request a new note
C
A
S
I |
AMD
-
NASDAQ
Advanced Micro Devices
ELECTRONICS - Semiconductor - Broad Line
|
$91.81
|
+0.26
0.28% |
$92.51
|
16,593,125
35.54% of 50 DAV
50 DAV is 46,690,000
|
$97.98
-6.30%
|
11/18/2020
|
$82.54
|
PP = $88.72
|
|
MB = $93.16
|
Most Recent Note - 12/21/2020 5:37:53 PM
G - Pulled back from its all-time high, slumping near its "max buy" level with average volume behind today's 4th consecutive loss. Its 50 DMA line ($85.73) defines important near term support to watch on pullbacks. See the latest FSU anaylsys for more details and a new annotated graph.
>>> FEATURED STOCK ARTICLE : Pulling Back From its Record High Hit Last Week - 12/21/2020 |
View all notes |
Set NEW NOTE alert |
Company Profile |
SEC
News |
Chart |
Request a new note
C
A
S
I |
TER
-
NASDAQ
Teradyne Inc
ELECTRONICS - Semiconductor Equipment and Mate
|
$118.88
|
+1.62
1.38% |
$118.90
|
418,464
26.93% of 50 DAV
50 DAV is 1,554,000
|
$122.37
-2.85%
|
10/21/2020
|
$92.22
|
PP = $93.54
|
|
MB = $98.22
|
Most Recent Note - 12/21/2020 5:40:45 PM
G - Perched near its all-time high, stubbornly holding its ground. Support to watch on pullbacks is its 50 DMA line ($102.70).
>>> FEATURED STOCK ARTICLE : Stubbornly Holding Ground and Rising for a New High - 12/7/2020 |
View all notes |
Set NEW NOTE alert |
Company Profile |
SEC
News |
Chart |
Request a new note
C
A
S
I |
AMRC
-
NYSE
Ameresco Inc Cl A
ENERGY - Alternative
|
$49.39
|
-2.37
-4.58% |
$51.77
|
277,788
72.91% of 50 DAV
50 DAV is 381,000
|
$54.79
-9.86%
|
12/15/2020
|
$46.72
|
PP = $47.10
|
|
MB = $49.46
|
 Most Recent Note - 12/24/2020 11:14:45 AM
G - Slumping near its "max buy" level today after a "negative reversal" on the prior session at its all-time high. Prior highs in the $46-47 area define initial support to watch on pullbacks.
>>> FEATURED STOCK ARTICLE : Gain From Ascending Base Pattern Backed by Above Average Volume - 12/15/2020 |
View all notes |
Set NEW NOTE alert |
Company Profile |
SEC
News |
Chart |
Request a new note
C
A
S
I |
TREX
-
NYSE
Trex Company Inc
MATERIALS and CONSTRUCTION - General Building Materials
|
$86.29
|
+0.47
0.55% |
$86.71
|
292,317
38.01% of 50 DAV
50 DAV is 769,000
|
$86.75
-0.53%
|
6/26/2020
|
$54.53
|
PP = $66.47
|
|
MB = $69.79
|
Most Recent Note - 12/22/2020 5:07:10 PM
G - Hit yet another new 52-week high with light volume behind today's 4th gain. Its 50 DMA line ($75.63) defines near-term support. Recently noted that it reported Sep '20 quarterly earnings +14% on +19% sales revenues versus the year ago period, below the +25% minimum guideline (C criteria) raising fundamental concerns. See the latest FSU analysis for more details and a new annotated graph.
>>> FEATURED STOCK ARTICLE : Hit New High With Light Volume Behind 4th Consecutive Gain - 12/22/2020 |
View all notes |
Set NEW NOTE alert |
Company Profile |
SEC
News |
Chart |
Request a new note
C
A
S
I |
Symbol/Exchange
Company Name
Industry Group |
PRICE |
CHANGE
(%Change) |
Day High |
Volume
(% DAV)
(% 50 day avg vol) |
52 Wk Hi
% From Hi |
Featured
Date |
Price
Featured |
Pivot Featured |
|
Max Buy |
CLFD
-
NASDAQ
Clearfield Inc
TELECOMMUNICATIONS - Cables / Satalite Equipment
|
$24.80
|
-0.49
-1.94% |
$25.49
|
21,956
21.53% of 50 DAV
50 DAV is 102,000
|
$28.32
-12.43%
|
11/17/2020
|
$22.06
|
PP = $26.07
|
|
MB = $27.37
|
Most Recent Note - 12/22/2020 5:12:49 PM
Y - Sputtering below the pivot point after churning higher volume last week without making meaningful price progress. Near term support is defined by its 50 DMA line ($23.36) and an upward trendline.
>>> FEATURED STOCK ARTICLE : Perched Near Pivot Point in Need of Confirming Gain on Volume - 12/10/2020 |
View all notes |
Set NEW NOTE alert |
Company Profile |
SEC
News |
Chart |
Request a new note
C
A
S
I |
NOW
-
NYSE
Servicenow Inc
Computer Sftwr-Enterprse
|
$553.89
|
+3.83
0.70% |
$560.54
|
623,572
46.12% of 50 DAV
50 DAV is 1,352,000
|
$566.74
-2.27%
|
8/20/2020
|
$453.34
|
PP = $454.79
|
|
MB = $477.53
|
Most Recent Note - 12/22/2020 5:10:29 PM
G - Posted a gain today with light volume for its second best ever close. Found prompt support near its 50 DMA line and stubbornly held its ground in recent weeks. Recently reported Sep '20 quarterly earnings +22% on +30% sales revenues versus the year ago period, below the +25% minimum guideline (C criteria) of the fact-based investment system.
>>> FEATURED STOCK ARTICLE : Hit New Record High With Light Volume Behind Gain - 12/17/2020 |
View all notes |
Set NEW NOTE alert |
Company Profile |
SEC
News |
Chart |
Request a new note
C
A
S
I |
ALRM
-
NASDAQ
Alarm.com Holdings Inc
Security/Sfty
|
$98.88
|
-2.05
-2.03% |
$102.10
|
193,414
48.84% of 50 DAV
50 DAV is 396,000
|
$102.94
-3.94%
|
11/6/2020
|
$71.88
|
PP = $74.76
|
|
MB = $78.50
|
Most Recent Note - 12/24/2020 2:35:00 PM
G - Pulled back from its all-time high with today's loss breaking a streak of 8 consecutive gains. Very extended from any sound base. Prior high ($74.66 on 7/23/20) defines initial support to watch above its 50 DMA line ($72.77). See the latest FSU analysis for more details and a new annotated graph.
>>> FEATURED STOCK ARTICLE : Perched at High After Impressive Streak of Gains - 12/24/2020 |
View all notes |
Set NEW NOTE alert |
Company Profile |
SEC
News |
Chart |
Request a new note
C
A
S
I |
TEAM
-
NASDAQ
Atlassian Corp Plc Cl A
Comp Sftwr-Spec Enterprs
|
$241.79
|
+0.91
0.38% |
$243.73
|
656,522
32.97% of 50 DAV
50 DAV is 1,991,000
|
$250.03
-3.30%
|
10/12/2020
|
$193.77
|
PP = $199.60
|
|
MB = $209.58
|
Most Recent Note - 12/22/2020 5:15:48 PM
G - Volume totals cooled while stubbornly holding its ground perched at its 52-week high. Showed resilience and strength after earnings rose +7% on +26% sales revenues for the Sep '20 quarter versus the year ago period, below the +25% minimum earnings guideline (C criteria), raising concerns.
>>> FEATURED STOCK ARTICLE : Extended From Any Base After Streak of Gains for New Highs - 12/18/2020 |
View all notes |
Set NEW NOTE alert |
Company Profile |
SEC
News |
Chart |
Request a new note
C
A
S
I |
SHOP
-
NYSE
Shopify Inc Cl A
Computer Sftwr-Enterprse
|
$1,225.52
|
+27.56
2.30% |
$1,238.98
|
920,164
60.66% of 50 DAV
50 DAV is 1,517,000
|
$1,285.19
-4.64%
|
12/16/2020
|
$1,146.00
|
PP = $1,147.01
|
|
MB = $1,204.36
|
Most Recent Note - 12/24/2020 11:43:32 AM
G - Consolidating above its "max buy" level after spiking to new all-time highs with volume-driven gains. Prior highs in the $1,146-1,130 area define initial support to watch above its 50 DMA line ($1,037).. Reported Sep '20 quarterly earnings of $1.13 per share versus a loss of 29 cents per share on +96% sales revenues versus the year ago period. The Ontario, Canada-based Computer Software - Enterprise firm's prior quarters showed big earnings and sales revenues growth. After years of losses it had strong earnings growth in FY '17-19 (A criteria).
>>> FEATURED STOCK ARTICLE : Volume-Driven Gain for New High After Long Consolidation - 12/16/2020 |
View all notes |
Set NEW NOTE alert |
Company Profile |
SEC
News |
Chart |
Request a new note
C
A
S
I |
Symbol/Exchange
Company Name
Industry Group |
PRICE |
CHANGE
(%Change) |
Day High |
Volume
(% DAV)
(% 50 day avg vol) |
52 Wk Hi
% From Hi |
Featured
Date |
Price
Featured |
Pivot Featured |
|
Max Buy |
YETI
-
NYSE
Yeti Holdings Inc
Leisure-Products
|
$73.09
|
+0.20
0.27% |
$73.83
|
166,747
13.66% of 50 DAV
50 DAV is 1,221,000
|
$74.82
-2.31%
|
11/5/2020
|
$57.25
|
PP = $55.14
|
|
MB = $57.90
|
Most Recent Note - 12/22/2020 3:21:33 PM
G - Quietly wedging to new all-time highs with recent gains lacking great volume conviction. Its 50 DMA line ($59.54) defines initial support to watch above prior highs in the $55-54 area.
>>> FEATURED STOCK ARTICLE : Volume Totals Cooloing While Stubbornly Holding Ground at High - 12/2/2020 |
View all notes |
Set NEW NOTE alert |
Company Profile |
SEC
News |
Chart |
Request a new note
C
A
S
I |
AAXN
-
NASDAQ
Axon Enterprise Inc
Security/Sfty
|
$130.75
|
-1.08
-0.82% |
$132.46
|
187,122
33.53% of 50 DAV
50 DAV is 558,000
|
$134.73
-2.95%
|
12/22/2020
|
$127.84
|
PP = $130.51
|
|
MB = $137.04
|
Most Recent Note - 12/23/2020 6:02:46 PM
Y - Hit a new all-time high with average volume behind today's 4th consecutive gain. Color code was changed to yellow after a 4-week square box base pattern as it was noted - "A solid gain and close above the pivot point backed by at least +40% above average volume may trigger a new (or add-on) technical buy signal. Its 50 DMA line ($116.42) defines near term support to watch on pullbacks. Recently reported Sep '20 quarterly earnings +43% on +27% sales revenues versus the year ago period." See the latest FSU analysis for more details and a new annotated graph.
>>> FEATURED STOCK ARTICLE : New All-Time High With Today's 5th Consecutive Gain - 12/23/2020 |
View all notes |
Set NEW NOTE alert |
Company Profile |
SEC
News |
Chart |
Request a new note
C
A
S
I |
QTWO
-
NYSE
Q2 Holdings Inc
Computer Sftwr-Financial
|
$127.98
|
-0.61
-0.47% |
$129.54
|
87,798
20.85% of 50 DAV
50 DAV is 421,000
|
$130.59
-2.00%
|
11/12/2020
|
$105.14
|
PP = $106.54
|
|
MB = $111.87
|
Most Recent Note - 12/22/2020 3:23:05 PM
G - Posting a 4th consecutive gain today hitting another new all-time high. Prior high in the $106 area and its 50 DMA line ($107.20) define important near term support to watch on pullbacks.
>>> FEATURED STOCK ARTICLE : Computer Software - Financial Firm Hovering Near Record High - 12/8/2020 |
View all notes |
Set NEW NOTE alert |
Company Profile |
SEC
News |
Chart |
Request a new note
C
A
S
I |
|
|
|
THESE ARE NOT BUY RECOMMENDATIONS!
Comments contained in the body of this report are technical
opinions only. The material herein has been obtained
from sources believed to be reliable and accurate, however,
its accuracy and completeness cannot be guaranteed.
This site is not an investment advisor, hence it does
not endorse or recommend any securities or other investments.
Any recommendation contained in this report may not
be suitable for all investors and it is not to be deemed
an offer or solicitation on our part with respect to
the purchase or sale of any securities. All trademarks,
service marks and trade names appearing in this report
are the property of their respective owners, and are
likewise used for identification purposes only.
This report is a service available
only to active Paid Premium Members.
You may opt-out of receiving report notifications
at any time. Questions or comments may be submitted
by writing to Premium Membership Services 665 S.E. 10 Street, Suite 201 Deerfield Beach, FL 33441-5634 or by calling 1-800-965-8307
or 954-785-1121.
|
|
|