You are not logged in.
This means you
CAN ONLY VIEW reports that were published prior to Tuesday, March 25, 2025.
You
MUST UPGRADE YOUR MEMBERSHIP if you want to see any current reports.
AFTER MARKET UPDATE - FRIDAY, DECEMBER 4TH, 2020
Previous After Market Report Next After Market Report >>>
|
|
|
|
DOW |
+248.74 |
30,218.26 |
+0.83% |
|
Volume |
975,214,010 |
-0% |
|
Volume |
5,024,967,800 |
-2% |
|
NASDAQ |
+84.25 |
12,461.43 |
+0.68% |
|
Advancers |
2,428 |
78% |
|
Advancers |
2,661 |
74% |
|
S&P 500 |
+32.40 |
3,699.12 |
+0.88% |
|
Decliners |
675 |
22% |
|
Decliners |
949 |
26% |
|
Russell 2000 |
+43.75 |
1,892.45 |
+2.37% |
|
52 Wk Highs |
279 |
|
|
52 Wk Highs |
417 |
|
|
S&P 600 |
+26.41 |
1,085.44 |
+2.49% |
|
52 Wk Lows |
4 |
|
|
52 Wk Lows |
10 |
|
|
 |
Major Indices Unanimously Rallied for New All-Time Highs
Kenneth J. Gruneisen - Passed the CAN SLIM® Master's Exam
The Dow rallied 248 points to its second close above 30,000. The S&P 500 and Nasdaq Composite advanced 0.9% and 0.7%, respectively. All three major indices finished at fresh all-time highs and notched robust weekly gains. The S&P 500 jumped 1.7% for the week, while the Dow gained 1%. The Nasdaq Composite outperformed, climbing 2.1%. The volume totals on Friday were lighter than the prior session on the NYSE and on the Nasdaq exchange. Breadth was positive as advancers led decliners by more than a 3-1 margin on the NYSE and by nearly 3-1 on the Nasdaq exchange. There were 86 high-ranked companies from the Leaders List that hit new 52-week highs and were listed on the BreakOuts Page, versus the total of 59 on the prior session. New 52-week highs totals expanded and solidly outnumbered new 52-week lows totals on both exchanges. The major indices confirmed a new uptrend (M criteria) with recent follow-through gains backed by higher volume and more leadership. Investors are reminded to always make buying and selling decisions based based on the strict criteria and rules of the fact-based investment system. 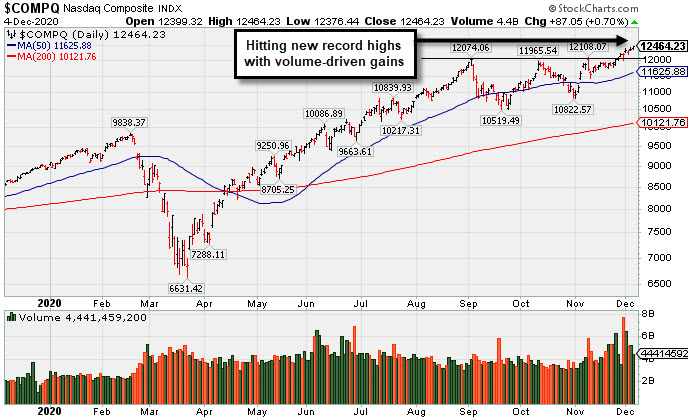 PICTURED: The Nasdaq Composite Index has been hitting new record highs with a recent spurt of volume-driven gains.
Stocks ended higher on Friday as a weaker than expected November jobs report stoked hopes for additional fiscal stimulus before year-end. On the data front, the Department of Labor's nonfarm payroll report for November showed the U.S. added 245,000 jobs, lower than the 460,000 anticipated and the downwardly revised 610,000 gain in October. Meanwhile, the unemployment rate inched down to 6.7% in November from 6.9% the prior month. Investors kept a close eye on fiscal stimulus deliberations. After months of stalemate, Senate Majority leader McConnell said on Thursday that a compromise is "within reach." Further, President-elect Joe Biden noted the latest jobs report underscored the need for additional federal aid by month-end and also in January. Treasuries declined, with the yield on the benchmark 10-year note jumping six basis points to 0.97%.
Nine of 11 S&P 500 sectors finished higher. Energy stocks paced the gains with a 5.4% jump as WTI crude closed above $46/barrel for the first time since March. The other value-oriented groups, Materials and Industrials also outperformed their growth counterparts, while Financials climbed with treasury yields. In corporate news, Ulta Beauty (ULTA -3.45%) fell after the company missed revenue expectations. DocuSign (DOCU +5.29%) rose after giving upbeat forward guidance.. |
 Kenneth J. Gruneisen started out as a licensed stockbroker in August 1987, a couple of months prior to the historic stock market crash that took the Dow Jones Industrial Average down -22.6% in a single day. He has published daily fact-based fundamental and technical analysis on high-ranked stocks online for two decades. Through FACTBASEDINVESTING.COM, Kenneth provides educational articles, news, market commentary, and other information regarding proven investment systems that work in good times and bad.
Comments contained in the body of this report are technical opinions only and are not necessarily those of Gruneisen Growth Corp. The material herein has been obtained from sources believed to be reliable and accurate, however, its accuracy and completeness cannot be guaranteed. Our firm, employees, and customers may effect transactions, including transactions contrary to any recommendation herein, or have positions in the securities mentioned herein or options with respect thereto. Any recommendation contained in this report may not be suitable for all investors and it is not to be deemed an offer or solicitation on our part with respect to the purchase or sale of any securities. |
|
 |
Energy, Financial, and Tech Groups Rose
Kenneth J. Gruneisen - Passed the CAN SLIM® Master's Exam
The Oil Services Index ($OSX +7.37%) and Integrated Oil Index ($XOI +6.01%) both posted standout gains on Friday. The Semiconductor Index ($SOX +2.83%), Networking Index ($NWX +1.95%), and Biotech Index ($BTK +0.89%) posted unanimous gains. The Broker/Dealer Index ($XBD +1.55%) and Bank Index ($BKX +1.63%) both were a positive influence on the major indices as financials rose. The Retail Index ($RLX -0.53%) edged lower along with the Gold & Silver Index ($XAU -0.20%).
PICTURED: The Oil Services Index ($OSX +7.37%) posted a big gain on Friday challlenging its June high while still recovering from deep multi-year lows.
| Oil Services |
$OSX |
45.27 |
+3.11 |
+7.37% |
-42.17% |
| Integrated Oil |
$XOI |
832.72 |
+47.21 |
+6.01% |
-34.46% |
| Semiconductor |
$SOX |
2,793.05 |
+76.89 |
+2.83% |
+51.01% |
| Networking |
$NWX |
666.28 |
+12.77 |
+1.95% |
+14.21% |
| Broker/Dealer |
$XBD |
365.37 |
+5.58 |
+1.55% |
+25.83% |
| Retail |
$RLX |
3,473.00 |
-18.68 |
-0.53% |
+41.80% |
| Gold & Silver |
$XAU |
139.33 |
-0.27 |
-0.20% |
+30.31% |
| Bank |
$BKX |
95.62 |
+1.53 |
+1.63% |
-15.65% |
| Biotech |
$BTK |
5,619.64 |
+49.84 |
+0.89% |
+10.90% |
|
|
|
 |
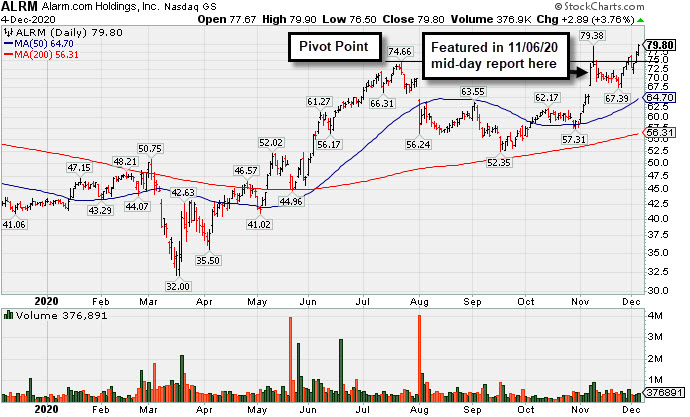
Alarm Hits a New Record High
Kenneth J. Gruneisen - Passed the CAN SLIM® Master's Exam
Alarm.com Holdings Inc (ALRM +$2.89 or +3.76% to $79.80) posted a 3rd consecutive gain today with near averaage volume, rising back above its cited pivot point and hitting a new all-time high. Its gain on 11/30/20 was backed by +74% above average volume as it rallied and closed above the pivot point triggering a technical buy signal.
Recently ALRM reported earnings +32% on +24% sales revenues for the Sep '20 quarter versus the year ago period, an improvement after +3% earnings in the Jun quarter. Prior quarterly comparisons were near or above the +25% minimum earnings guideline (C criteria). Annual earnings (A criteria) growth has been strong, a good match with the fact-based investment system.
The number of top-rated funds owning its shares rose from 262 in Mar '18 to 412 in Sep '20, a reassuring sign concerning the I criteria. Its current Up/Down Volume Ratio of 1.5 is an unbiased indication its shares have been under accumulation over the past 50 days. It has earned a Timeliness Rating of A and a Sponsorship Rating of D.
Charts courtesy of www.stockcharts.com
 |
|
|
Color Codes Explained :
Y - Better candidates highlighted by our
staff of experts.
G - Previously featured
in past reports as yellow but may no longer be buyable under the
guidelines.
***Last / Change / Volume data in this table is the closing quote data***
Symbol/Exchange
Company Name
Industry Group |
PRICE |
CHANGE
(%Change) |
Day High |
Volume
(% DAV)
(% 50 day avg vol) |
52 Wk Hi
% From Hi |
Featured
Date |
Price
Featured |
Pivot Featured |
|
Max Buy |
 CRL
-
NYSE
CRL
-
NYSE
Charles River Labs Intl
DRUGS - Biotechnology
|
$237.42
|
+2.43
1.03% |
$238.45
|
215,226
68.33% of 50 DAV
50 DAV is 315,000
|
$257.88
-7.93%
|
7/15/2020
|
$192.66
|
PP = $189.95
|
|
MB = $199.45
|
Most Recent Note - 11/30/2020 6:27:35 PM
G - The prompt rebound above its 50 DMA line ($232.62) helped its outlook improve. Reported Sep '20 quarterly earnings +38% on +11% sales revenues versus the year ago period, above the +25% minimum earnings guideline (C criteria).
>>> FEATURED STOCK ARTICLE : Consolidating Near Important Support Levels - 11/23/2020 |
View all notes |
Set NEW NOTE alert |
Company Profile |
SEC
News |
Chart |
Request a new note
C
A
S
I |
AMD
-
NASDAQ
Advanced Micro Devices
ELECTRONICS - Semiconductor - Broad Line
|
$94.04
|
+1.73
1.87% |
$94.58
|
45,132,929
89.99% of 50 DAV
50 DAV is 50,156,000
|
$96.37
-2.42%
|
11/18/2020
|
$82.54
|
PP = $88.72
|
|
MB = $93.16
|
Most Recent Note - 12/2/2020 12:17:24 PM
G - Trading further above its "max buy" level and hitting a new all-time high with today's gain. Rallied above the pivot point on 11/30/20 with a noted big gain backed by +69% above average volume triggering a technical buy signal. Its 50 DMA line ($82.63) defines important near term support.
>>> FEATURED STOCK ARTICLE : Volume Heavy Behind AMD's Breakout from Double Bottom Base - 11/30/2020 |
View all notes |
Set NEW NOTE alert |
Company Profile |
SEC
News |
Chart |
Request a new note
C
A
S
I |
TER
-
NASDAQ
Teradyne Inc
ELECTRONICS - Semiconductor Equipment and Mate
|
$116.03
|
+2.29
2.01% |
$116.28
|
1,167,025
74.95% of 50 DAV
50 DAV is 1,557,000
|
$117.22
-1.02%
|
10/21/2020
|
$92.22
|
PP = $93.54
|
|
MB = $98.22
|
Most Recent Note - 12/1/2020 6:45:50 PM
G - Posted a big gain today with above average volume for another new all-time high close. Reported earnings +53% on +41% sales revenues for the Sep '20 quarter versus the year ago period, its 4th consecutive quarterly comparison with earnings above the +25% minimum earnings guideline (C criteria). Sequential comparisons show encouraging acceleration in its sales revenues growth rate. Its annual earnings (A criteria) history has been strong.
>>> FEATURED STOCK ARTICLE : Recent Gains for New Highs Lacked Great Volume Conviction - 11/11/2020 |
View all notes |
Set NEW NOTE alert |
Company Profile |
SEC
News |
Chart |
Request a new note
C
A
S
I |
TREX
-
NYSE
Trex Company Inc
MATERIALS and CONSTRUCTION - General Building Materials
|
$74.45
|
-1.73
-2.27% |
$76.49
|
653,023
90.32% of 50 DAV
50 DAV is 723,000
|
$81.23
-8.35%
|
6/26/2020
|
$54.53
|
PP = $66.47
|
|
MB = $69.79
|
Most Recent Note - 12/3/2020 5:23:23 PM
G - Posted a solid gain today with +20% above average volume. Its 50 DMA line ($74.04) defines near-term support. Recently noted that it reported Sep '20 quarterly earnings +14% on +19% sales revenues versus the year ago period, below the +25% minimum guideline (C criteria) raising fundamental concerns. See the latest FSU analysis for more details and an annotated graph.
>>> FEATURED STOCK ARTICLE : Consolidating Back Above 50-Day Moving Average Line - 12/1/2020 |
View all notes |
Set NEW NOTE alert |
Company Profile |
SEC
News |
Chart |
Request a new note
C
A
S
I |
CLFD
-
NASDAQ
Clearfield Inc
TELECOMMUNICATIONS - Cables / Satalite Equipment
|
$24.15
|
+0.17
0.71% |
$24.37
|
48,218
53.58% of 50 DAV
50 DAV is 90,000
|
$25.97
-7.01%
|
11/17/2020
|
$22.06
|
PP = $26.07
|
|
MB = $27.37
|
Most Recent Note - 12/3/2020 5:20:58 PM
Y - Posted a gain today with light volume, still perched within close striking distance of its 52-week high. Near term support is defined by its 50 DMA line ($22.32) and an upward trendline. Subsequent gains above the pivot point marked by +40% above average volume are needed to trigger a proper technical buy signal.
>>> FEATURED STOCK ARTICLE : Formed Ascending Base Following Earlier Breakway Gap - 11/17/2020 |
View all notes |
Set NEW NOTE alert |
Company Profile |
SEC
News |
Chart |
Request a new note
C
A
S
I |
Symbol/Exchange
Company Name
Industry Group |
PRICE |
CHANGE
(%Change) |
Day High |
Volume
(% DAV)
(% 50 day avg vol) |
52 Wk Hi
% From Hi |
Featured
Date |
Price
Featured |
Pivot Featured |
|
Max Buy |
NOW
-
NYSE
Servicenow Inc
Computer Sftwr-Enterprse
|
$525.70
|
+0.46
0.09% |
$529.75
|
741,336
57.69% of 50 DAV
50 DAV is 1,285,000
|
$541.74
-2.96%
|
8/20/2020
|
$453.34
|
PP = $454.79
|
|
MB = $477.53
|
Most Recent Note - 11/30/2020 6:26:10 PM
G - Posted a gain with above average volume for its second best ever close. Tested the prior low ($472 on 11/03/20) noted as important support where a damaging violation raises greater concerns. Recently reported Sep '20 quarterly earnings +22% on +30% sales revenues versus the year ago period, below the +25% minimum guideline (C criteria) of the fact-based investment system.
>>> FEATURED STOCK ARTICLE : Consolidating Above 50-Day Average Still Perched Near All-Time High - 11/24/2020 |
View all notes |
Set NEW NOTE alert |
Company Profile |
SEC
News |
Chart |
Request a new note
C
A
S
I |
VEEV
-
NYSE
Veeva Systems Inc Cl A
Computer Sftwr-Medical
|
$271.72
|
-2.18
-0.80% |
$276.72
|
828,231
88.49% of 50 DAV
50 DAV is 936,000
|
$313.99
-13.46%
|
10/6/2020
|
$287.71
|
PP = $298.86
|
|
MB = $313.80
|
Most Recent Note - 12/2/2020 12:49:55 PM
G - Rebounded from the early low after gapping down today, slumping back below its 50 DMA line ($282.64) and nearly testing the prior low ($253.42 on 11/10/20). Reported Oct '20 quarterly earnings +30% on +34% sales revenues versus the year ago period. Volume and volatility often increase near earnings news. Faces resistance due to overhead supply up to the $314 area.
>>> FEATURED STOCK ARTICLE : Weak Technical Action Raised Recent Concerns - 11/16/2020 |
View all notes |
Set NEW NOTE alert |
Company Profile |
SEC
News |
Chart |
Request a new note
C
A
S
I |
ALRM
-
NASDAQ
Alarm.com Holdings Inc
Security/Sfty
|
$79.80
|
+2.89
3.76% |
$79.90
|
376,891
109.88% of 50 DAV
50 DAV is 343,000
|
$79.38
0.53%
|
11/6/2020
|
$71.88
|
PP = $74.76
|
|
MB = $78.50
|
 Most Recent Note - 12/4/2020 5:35:59 PM
G - Posted a 3rd consecutive gain today with near average volume, rising back above its "max buy" level for a new all-time high and its color code is changed to green. See the latest FSU analysis for more details and a new annotated graph.
>>> FEATURED STOCK ARTICLE : Alarm Hits a New Record High - 12/4/2020 |
View all notes |
Set NEW NOTE alert |
Company Profile |
SEC
News |
Chart |
Request a new note
C
A
S
I |
TEAM
-
NASDAQ
Atlassian Corp Plc Cl A
Comp Sftwr-Spec Enterprs
|
$225.01
|
-1.18
-0.52% |
$229.58
|
1,259,410
65.42% of 50 DAV
50 DAV is 1,925,000
|
$234.44
-4.02%
|
10/12/2020
|
$193.77
|
PP = $199.60
|
|
MB = $209.58
|
Most Recent Note - 12/2/2020 6:01:07 PM
G - Posted a gain with below average volume today for a new best-ever close. Found prompt support after undercutting the prior low ($180) but it has not formed a sound new base of sufficient length. Reported earnings +7% on +26% sales revenues for the Sep '20 quarter versus the year ago period, well below the +25% minimum earnings guideline (C criteria), raising concerns.
>>> FEATURED STOCK ARTICLE : Quiet Volume Behind Gain Today for a New All-Time High - 11/27/2020 |
View all notes |
Set NEW NOTE alert |
Company Profile |
SEC
News |
Chart |
Request a new note
C
A
S
I |
YETI
-
NYSE
Yeti Holdings Inc
Leisure-Products
|
$62.81
|
-1.68
-2.61% |
$64.90
|
610,033
51.31% of 50 DAV
50 DAV is 1,189,000
|
$65.49
-4.09%
|
11/5/2020
|
$57.25
|
PP = $55.14
|
|
MB = $57.90
|
Most Recent Note - 12/3/2020 5:26:45 PM
G - Posted a gain today with near average volume while hitting a new high. Prior highs in the $55-54 area define initial support to watch above its 50 DMA line ($53.65). See the latest FSU analysis for more details and an annotated graph.
>>> FEATURED STOCK ARTICLE : Volume Totals Cooloing While Stubbornly Holding Ground at High - 12/2/2020 |
View all notes |
Set NEW NOTE alert |
Company Profile |
SEC
News |
Chart |
Request a new note
C
A
S
I |
Symbol/Exchange
Company Name
Industry Group |
PRICE |
CHANGE
(%Change) |
Day High |
Volume
(% DAV)
(% 50 day avg vol) |
52 Wk Hi
% From Hi |
Featured
Date |
Price
Featured |
Pivot Featured |
|
Max Buy |
BJ
-
NYSE
B J S Whlsl Club Hldgs
Retail-DiscountandVariety
|
$38.67
|
-0.05
-0.13% |
$38.71
|
2,608,271
114.10% of 50 DAV
50 DAV is 2,286,000
|
$47.46
-18.52%
|
11/19/2020
|
$42.97
|
PP = $47.56
|
|
MB = $49.94
|
Most Recent Note - 12/3/2020 5:19:20 PM
G - Slumped further below its 50 DMA line ($40.80) raisingf more concerns with a 7th consecutive loss today backed by higher volume. A rebound above the 50 DMA line is needed for its outlook to improve.
>>> FEATURED STOCK ARTICLE : Rebounding Near High With 3rd Strong Quarterly Report - 11/19/2020 |
View all notes |
Set NEW NOTE alert |
Company Profile |
SEC
News |
Chart |
Request a new note
C
A
S
I |
AAXN
-
NASDAQ
Axon Enterprise Inc
Security/Sfty
|
$124.18
|
+0.33
0.27% |
$124.93
|
249,307
47.04% of 50 DAV
50 DAV is 530,000
|
$130.41
-4.78%
|
11/6/2020
|
$122.75
|
PP = $113.00
|
|
MB = $118.65
|
Most Recent Note - 12/3/2020 5:15:02 PM
G - Still perched near its all time high with volume totals cooling. Wedged to new high territory with gains lacking volume conviction. Recently reported Sep '20 quarterly earnings +43% on +27% sales revenues versus the year ago period. It broke out of a cup-with-high-handle base with volume drying up during the handle. See the latest FSU analysis for more details and a new annotated graph.
>>> FEATURED STOCK ARTICLE : Volume Totals Cooling While Hovering Near All-Time High - 12/3/2020 |
View all notes |
Set NEW NOTE alert |
Company Profile |
SEC
News |
Chart |
Request a new note
C
A
S
I |
QTWO
-
NYSE
Q2 Holdings Inc
Computer Sftwr-Financial
|
$116.50
|
-0.35
-0.30% |
$119.97
|
577,924
147.05% of 50 DAV
50 DAV is 393,000
|
$117.67
-0.99%
|
11/12/2020
|
$105.14
|
PP = $106.54
|
|
MB = $111.87
|
Most Recent Note - 12/3/2020 5:24:46 PM
G - Posted a gain today with average volume while hitting a new high. Showed great earning increases with strong underlying sales revenues growth for the Jun and Sep '20 quarters versus the year ago periods. Annual earnings growth has been strong. Completed new Public Offerings on 6/06/19 and 5/13/20.
>>> FEATURED STOCK ARTICLE : Churning Action Near Prior High Indicative of Distributional Pressure - 11/12/2020 |
View all notes |
Set NEW NOTE alert |
Company Profile |
SEC
News |
Chart |
Request a new note
C
A
S
I |
|
|
|
THESE ARE NOT BUY RECOMMENDATIONS!
Comments contained in the body of this report are technical
opinions only. The material herein has been obtained
from sources believed to be reliable and accurate, however,
its accuracy and completeness cannot be guaranteed.
This site is not an investment advisor, hence it does
not endorse or recommend any securities or other investments.
Any recommendation contained in this report may not
be suitable for all investors and it is not to be deemed
an offer or solicitation on our part with respect to
the purchase or sale of any securities. All trademarks,
service marks and trade names appearing in this report
are the property of their respective owners, and are
likewise used for identification purposes only.
This report is a service available
only to active Paid Premium Members.
You may opt-out of receiving report notifications
at any time. Questions or comments may be submitted
by writing to Premium Membership Services 665 S.E. 10 Street, Suite 201 Deerfield Beach, FL 33441-5634 or by calling 1-800-965-8307
or 954-785-1121.
|
|
|


