You are not logged in.
This means you
CAN ONLY VIEW reports that were published prior to Wednesday, April 30, 2025.
You
MUST UPGRADE YOUR MEMBERSHIP if you want to see any current reports.
AFTER MARKET UPDATE - THURSDAY, DECEMBER 3RD, 2020
Previous After Market Report Next After Market Report >>>
|
|
|
|
DOW |
+85.73 |
29,969.52 |
+0.29% |
|
Volume |
979,943,240 |
-2% |
|
Volume |
5,145,027,600 |
+1% |
|
NASDAQ |
+27.73 |
12,377.09 |
+0.22% |
|
Advancers |
2,009 |
65% |
|
Advancers |
2,144 |
61% |
|
S&P 500 |
-2.29 |
3,666.72 |
-0.06% |
|
Decliners |
1,061 |
35% |
|
Decliners |
1,394 |
39% |
|
Russell 2000 |
+10.67 |
1,848.70 |
+0.58% |
|
52 Wk Highs |
181 |
|
|
52 Wk Highs |
315 |
|
|
S&P 600 |
+7.34 |
1,059.03 |
+0.70% |
|
52 Wk Lows |
2 |
|
|
52 Wk Lows |
10 |
|
|
 |
Leadership Improved And Breadth Was Positive
Kenneth J. Gruneisen - Passed the CAN SLIM® Master's Exam
The Dow pared a more than 150 point gain to end 85 points higher, while the S&P 500 finished 0.1% below yesterday's record closing level. The Nasdaq Composite gained 0.2% to a new all-time high. The volume totals were mixed, lighter than the prior session on the NYSE and higher on the Nasdaq exchange. Breadth was positive as advancers led decliners by almost a 2-1 margin on the NYSE and by 3-2 on the Nasdaq exchange. There were 59 high-ranked companies from the Leaders List that hit new 52-week highs and were listed on the BreakOuts Page, more than doubling the total of 23 on the prior session. New 52-week highs totals expanded and solidly outnumbered new 52-week lows totals on both exchanges. The major indices confirmed a new uptrend (M criteria) with recent follow-through gains backed by higher volume and more leadership. Investors are reminded to always make buying and selling decisions based based on the strict criteria and rules of the fact-based investment system.  PICTURED: The Dow Jones Industrial Average is perched near its record high.
Stocks finished off the day's best levels amid a disappointing vaccine update from Pfizer (PFE -1.72%). The pharmaceutical company cut its 2020 vaccine rollout plan by 50% citing supply-chain issues. Earlier, all three major averages traded at record highs as investors assessed encouraging fiscal stimulus updates and digested upbeat economic data. Democratic House and Senate leaders recommended lawmakers use the bipartisan $900 billion proposal as a baseline for stimulus negotiations, while Senate majority leader Mitch McConnell signaled optimism saying a "compromise is within reach."
On the data front, initial jobless claims declined for the first time in three weeks to 712,000 from the prior period's upwardly revised 787,000 figure. Separately, the final November reading of services PMI from IHS Markit unexpectedly improved to 58.4, while the Institute for Supply Management's (ISM) services index showed activity in the sector expanded at a slower pace last month compared to October. Treasuries advanced, with the yield on the 10-year note down three basis points to 0.91%. Meanwhile, the U.S. dollar fell 0.5%, on track for a 1% weekly decline.
Six of 11 S&P 500 sectors ended in positive territory, with Energy pacing the gains. In corporate news, Splunk (SPLK -23.25%) gapped down violating its 50 and 200 DMA lines after posting a wider-than-anticipated loss in the most recent quarter. XPO Logistics (XPO +5.81%) rose after announcing it will be splitting its trucking and logistics units into two separate publicly traded companies. |
 Kenneth J. Gruneisen started out as a licensed stockbroker in August 1987, a couple of months prior to the historic stock market crash that took the Dow Jones Industrial Average down -22.6% in a single day. He has published daily fact-based fundamental and technical analysis on high-ranked stocks online for two decades. Through FACTBASEDINVESTING.COM, Kenneth provides educational articles, news, market commentary, and other information regarding proven investment systems that work in good times and bad.
Comments contained in the body of this report are technical opinions only and are not necessarily those of Gruneisen Growth Corp. The material herein has been obtained from sources believed to be reliable and accurate, however, its accuracy and completeness cannot be guaranteed. Our firm, employees, and customers may effect transactions, including transactions contrary to any recommendation herein, or have positions in the securities mentioned herein or options with respect thereto. Any recommendation contained in this report may not be suitable for all investors and it is not to be deemed an offer or solicitation on our part with respect to the purchase or sale of any securities. |
|
 |
Broker/Dealer, Networking, and Energy-Linked Groups Rose
Kenneth J. Gruneisen - Passed the CAN SLIM® Master's Exam
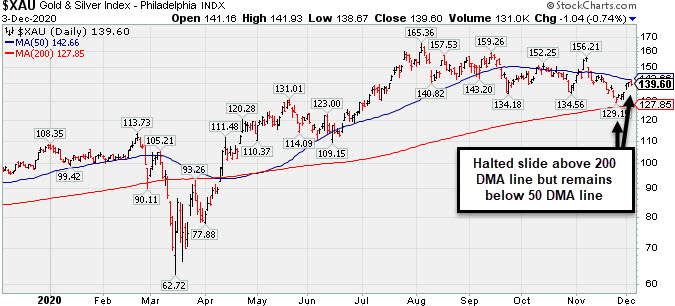
A small gain from the Broker/Dealer Index ($XBD +0.43%) and the Bank Index ($BKX +0.11%) was offset by slight weakness in the Retail Index ($RLX -0.41%). The Networking Index ($NWX +0.74%) led he tech sector while the Semiconductor Index ($SOX -0.02%) and Biotech Index ($BTK -0.01%) both finished flat. Commodity-linked groups were mixed as the Oil Services Index ($OSX +0.83%) and Integrated Oil Index ($XOI +1.14%) both rose but the Gold & Silver Index ($XAU -0.74%) edged lower.
PICTURED: The Gold & Silver Index ($XAU -0.74%) recently halted its slide above the 200-day moving average (DMA) line, but it edged lower on Thursday after meeting resistance at its 50 DMA line.
| Oil Services |
$OSX |
42.19 |
+0.35 |
+0.83% |
-46.12% |
| Integrated Oil |
$XOI |
785.51 |
+8.83 |
+1.14% |
-38.18% |
| Semiconductor |
$SOX |
2,716.15 |
-0.20 |
-0.02% |
+46.75% |
| Networking |
$NWX |
653.52 |
+4.77 |
+0.74% |
+12.02% |
| Broker/Dealer |
$XBD |
359.79 |
+1.53 |
+0.43% |
+23.90% |
| Retail |
$RLX |
3,491.68 |
-14.24 |
-0.41% |
+42.56% |
| Gold & Silver |
$XAU |
139.60 |
-1.04 |
-0.74% |
+30.57% |
| Bank |
$BKX |
94.09 |
+0.10 |
+0.11% |
-17.00% |
| Biotech |
$BTK |
5,569.80 |
-0.50 |
-0.01% |
+9.91% |
|
|
|
 |
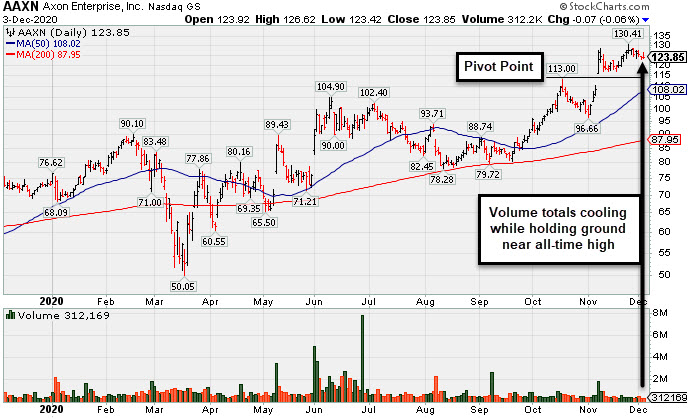
Volume Totals Cooling While Hovering Near All-Time High
Kenneth J. Gruneisen - Passed the CAN SLIM® Master's Exam
Axon Enterprise Inc's (AAXN -$0.07 or -0.06% to $123.85) is perched near its all time high with volume totals cooling. It recently wedged to new high territory with gains lacking volume conviction. It broke out of a cup-with-high-handle base with volume drying up during the handle. AAXN was last shown in this FSU section on 11/06/20 with an annotated graph under the headline, "Breakaway Gap From Cup-With-High-Handle Pattern". It was highlighted in yellow in the 11/06/20 mid-day report (read here) while hitting a new all-time high with a "breakaway gap" and volume-driven gain triggering a technical buy signal. Bullish action came after reporting Sep '20 quarterly earnings +43% on +27% sales revenues versus the year ago period.
AAXN completed a new Pubic Offering on 6/17/20. Such offerings often hinder price progress temporarily, yet they help companies attract greater institutional ownership interest (I criteria). AAXN was first highlighted in yellow in the 5/08/20 mid-day report with pivot point cited based upon its 2/19/20 high plus 10 cents (read here). AAXN found support at its 200 DMA line during the consolidation after dropped from the Featured Stocks list on 7/28/20.
The company has a small supply of only 63.5 million shares outstanding (S criteria) which can contribute to greater price volatility in the event of institutional buying or selling. The number of top-rated funds owning its shares rose from 400 in Sep '19 to 574 in Sep '20, a reassuring sign concerning the I criteria. AAXN has a Timeliness Rating of B and an Accumulation/Distribution Rating of A-. The Security/Safety industry group currently has a Group Relative Strength Rating of B- (59).
The Jun '20 quarterly comparison was a one cent per share loss versus 14 cent per share gain on +26% sales revenues, a noted blemish on its otherwise strong record. The Sep, Dec '19 and Mar '20 quarterly comparisons versus the year ago periods showed earnings increases above the +25% minimum guideline (C criteria) with strong underlying sales revenues increases. Its annual earnings (A criteria) history has also been strong, helping it get a 86 Earnings Per Share Rating. |
|
|
Color Codes Explained :
Y - Better candidates highlighted by our
staff of experts.
G - Previously featured
in past reports as yellow but may no longer be buyable under the
guidelines.
***Last / Change / Volume data in this table is the closing quote data***
Symbol/Exchange
Company Name
Industry Group |
PRICE |
CHANGE
(%Change) |
Day High |
Volume
(% DAV)
(% 50 day avg vol) |
52 Wk Hi
% From Hi |
Featured
Date |
Price
Featured |
Pivot Featured |
|
Max Buy |
 CRL
-
NYSE
CRL
-
NYSE
Charles River Labs Intl
DRUGS - Biotechnology
|
$234.99
|
-0.47
-0.20% |
$238.78
|
203,751
64.68% of 50 DAV
50 DAV is 315,000
|
$257.88
-8.88%
|
7/15/2020
|
$192.66
|
PP = $189.95
|
|
MB = $199.45
|
Most Recent Note - 11/30/2020 6:27:35 PM
G - The prompt rebound above its 50 DMA line ($232.62) helped its outlook improve. Reported Sep '20 quarterly earnings +38% on +11% sales revenues versus the year ago period, above the +25% minimum earnings guideline (C criteria).
>>> FEATURED STOCK ARTICLE : Consolidating Near Important Support Levels - 11/23/2020 |
View all notes |
Set NEW NOTE alert |
Company Profile |
SEC
News |
Chart |
Request a new note
C
A
S
I |
AMD
-
NASDAQ
Advanced Micro Devices
ELECTRONICS - Semiconductor - Broad Line
|
$92.31
|
-1.43
-1.53% |
$94.70
|
35,743,253
71.08% of 50 DAV
50 DAV is 50,285,000
|
$96.37
-4.21%
|
11/18/2020
|
$82.54
|
PP = $88.72
|
|
MB = $93.16
|
Most Recent Note - 12/2/2020 12:17:24 PM
G - Trading further above its "max buy" level and hitting a new all-time high with today's gain. Rallied above the pivot point on 11/30/20 with a noted big gain backed by +69% above average volume triggering a technical buy signal. Its 50 DMA line ($82.63) defines important near term support.
>>> FEATURED STOCK ARTICLE : Volume Heavy Behind AMD's Breakout from Double Bottom Base - 11/30/2020 |
View all notes |
Set NEW NOTE alert |
Company Profile |
SEC
News |
Chart |
Request a new note
C
A
S
I |
TER
-
NASDAQ
Teradyne Inc
ELECTRONICS - Semiconductor Equipment and Mate
|
$113.74
|
-0.22
-0.19% |
$117.22
|
1,699,860
108.62% of 50 DAV
50 DAV is 1,565,000
|
$115.94
-1.90%
|
10/21/2020
|
$92.22
|
PP = $93.54
|
|
MB = $98.22
|
Most Recent Note - 12/1/2020 6:45:50 PM
G - Posted a big gain today with above average volume for another new all-time high close. Reported earnings +53% on +41% sales revenues for the Sep '20 quarter versus the year ago period, its 4th consecutive quarterly comparison with earnings above the +25% minimum earnings guideline (C criteria). Sequential comparisons show encouraging acceleration in its sales revenues growth rate. Its annual earnings (A criteria) history has been strong.
>>> FEATURED STOCK ARTICLE : Recent Gains for New Highs Lacked Great Volume Conviction - 11/11/2020 |
View all notes |
Set NEW NOTE alert |
Company Profile |
SEC
News |
Chart |
Request a new note
C
A
S
I |
TREX
-
NYSE
Trex Company Inc
MATERIALS and CONSTRUCTION - General Building Materials
|
$76.18
|
+2.33
3.16% |
$77.34
|
868,364
119.94% of 50 DAV
50 DAV is 724,000
|
$81.23
-6.22%
|
6/26/2020
|
$54.53
|
PP = $66.47
|
|
MB = $69.79
|
 Most Recent Note - 12/3/2020 5:23:23 PM
G - Posted a solid gain today with +20% above average volume. Its 50 DMA line ($74.04) defines near-term support. Recently noted that it reported Sep '20 quarterly earnings +14% on +19% sales revenues versus the year ago period, below the +25% minimum guideline (C criteria) raising fundamental concerns. See the latest FSU analysis for more details and an annotated graph.
>>> FEATURED STOCK ARTICLE : Consolidating Back Above 50-Day Moving Average Line - 12/1/2020 |
View all notes |
Set NEW NOTE alert |
Company Profile |
SEC
News |
Chart |
Request a new note
C
A
S
I |
CLFD
-
NASDAQ
Clearfield Inc
TELECOMMUNICATIONS - Cables / Satalite Equipment
|
$23.98
|
+0.24
1.01% |
$24.34
|
44,626
49.58% of 50 DAV
50 DAV is 90,000
|
$25.97
-7.66%
|
11/17/2020
|
$22.06
|
PP = $26.07
|
|
MB = $27.37
|
Most Recent Note - 12/3/2020 5:20:58 PM
Y - Posted a gain today with light volume, still perched within close striking distance of its 52-week high. Near term support is defined by its 50 DMA line ($22.32) and an upward trendline. Subsequent gains above the pivot point marked by +40% above average volume are needed to trigger a proper technical buy signal.
>>> FEATURED STOCK ARTICLE : Formed Ascending Base Following Earlier Breakway Gap - 11/17/2020 |
View all notes |
Set NEW NOTE alert |
Company Profile |
SEC
News |
Chart |
Request a new note
C
A
S
I |
Symbol/Exchange
Company Name
Industry Group |
PRICE |
CHANGE
(%Change) |
Day High |
Volume
(% DAV)
(% 50 day avg vol) |
52 Wk Hi
% From Hi |
Featured
Date |
Price
Featured |
Pivot Featured |
|
Max Buy |
NOW
-
NYSE
Servicenow Inc
Computer Sftwr-Enterprse
|
$525.24
|
-1.28
-0.24% |
$539.50
|
1,004,597
78.42% of 50 DAV
50 DAV is 1,281,000
|
$541.74
-3.05%
|
8/20/2020
|
$453.34
|
PP = $454.79
|
|
MB = $477.53
|
Most Recent Note - 11/30/2020 6:26:10 PM
G - Posted a gain with above average volume for its second best ever close. Tested the prior low ($472 on 11/03/20) noted as important support where a damaging violation raises greater concerns. Recently reported Sep '20 quarterly earnings +22% on +30% sales revenues versus the year ago period, below the +25% minimum guideline (C criteria) of the fact-based investment system.
>>> FEATURED STOCK ARTICLE : Consolidating Above 50-Day Average Still Perched Near All-Time High - 11/24/2020 |
View all notes |
Set NEW NOTE alert |
Company Profile |
SEC
News |
Chart |
Request a new note
C
A
S
I |
VEEV
-
NYSE
Veeva Systems Inc Cl A
Computer Sftwr-Medical
|
$273.90
|
+1.50
0.55% |
$277.15
|
787,950
83.91% of 50 DAV
50 DAV is 939,000
|
$313.99
-12.77%
|
10/6/2020
|
$287.71
|
PP = $298.86
|
|
MB = $313.80
|
Most Recent Note - 12/2/2020 12:49:55 PM
G - Rebounded from the early low after gapping down today, slumping back below its 50 DMA line ($282.64) and nearly testing the prior low ($253.42 on 11/10/20). Reported Oct '20 quarterly earnings +30% on +34% sales revenues versus the year ago period. Volume and volatility often increase near earnings news. Faces resistance due to overhead supply up to the $314 area.
>>> FEATURED STOCK ARTICLE : Weak Technical Action Raised Recent Concerns - 11/16/2020 |
View all notes |
Set NEW NOTE alert |
Company Profile |
SEC
News |
Chart |
Request a new note
C
A
S
I |
ALRM
-
NASDAQ
Alarm.com Holdings Inc
Security/Sfty
|
$76.91
|
+2.64
3.55% |
$77.87
|
324,999
94.48% of 50 DAV
50 DAV is 344,000
|
$79.38
-3.11%
|
11/6/2020
|
$71.88
|
PP = $74.76
|
|
MB = $78.50
|
Most Recent Note - 12/3/2020 5:16:59 PM
Y - Posted a gain today with near averaage volume, rising back above its cited pivot point and finishing at a best efver close. Gain on 11/30/20 was backed by +74% above average volume as it rallied and closed above the pivot point triggering a technical buy signal. Reported earnings +32% on +24% sales revenues for the Sep '20 quarter versus the year ago period, an improvement after +3% earnings in the Jun quarter. Prior quarterly comparisons were near or above the +25% minimum earnings guideline (C criteria). Annual earnings (A criteria) growth has been strong, a good match with the fact-based investment system.
>>> FEATURED STOCK ARTICLE : Encountered Distributional Pressure as it Hit a New High - 11/9/2020 |
View all notes |
Set NEW NOTE alert |
Company Profile |
SEC
News |
Chart |
Request a new note
C
A
S
I |
TEAM
-
NASDAQ
Atlassian Corp Plc Cl A
Comp Sftwr-Spec Enterprs
|
$226.19
|
-1.80
-0.79% |
$234.44
|
2,006,435
105.66% of 50 DAV
50 DAV is 1,899,000
|
$228.97
-1.21%
|
10/12/2020
|
$193.77
|
PP = $199.60
|
|
MB = $209.58
|
Most Recent Note - 12/2/2020 6:01:07 PM
G - Posted a gain with below average volume today for a new best-ever close. Found prompt support after undercutting the prior low ($180) but it has not formed a sound new base of sufficient length. Reported earnings +7% on +26% sales revenues for the Sep '20 quarter versus the year ago period, well below the +25% minimum earnings guideline (C criteria), raising concerns.
>>> FEATURED STOCK ARTICLE : Quiet Volume Behind Gain Today for a New All-Time High - 11/27/2020 |
View all notes |
Set NEW NOTE alert |
Company Profile |
SEC
News |
Chart |
Request a new note
C
A
S
I |
YETI
-
NYSE
Yeti Holdings Inc
Leisure-Products
|
$64.49
|
+1.68
2.67% |
$65.49
|
1,087,932
91.50% of 50 DAV
50 DAV is 1,189,000
|
$64.37
0.19%
|
11/5/2020
|
$57.25
|
PP = $55.14
|
|
MB = $57.90
|
Most Recent Note - 12/3/2020 5:26:45 PM
G - Posted a gain today with near average volume while hitting a new high. Prior highs in the $55-54 area define initial support to watch above its 50 DMA line ($53.65). See the latest FSU analysis for more details and an annotated graph.
>>> FEATURED STOCK ARTICLE : Volume Totals Cooloing While Stubbornly Holding Ground at High - 12/2/2020 |
View all notes |
Set NEW NOTE alert |
Company Profile |
SEC
News |
Chart |
Request a new note
C
A
S
I |
Symbol/Exchange
Company Name
Industry Group |
PRICE |
CHANGE
(%Change) |
Day High |
Volume
(% DAV)
(% 50 day avg vol) |
52 Wk Hi
% From Hi |
Featured
Date |
Price
Featured |
Pivot Featured |
|
Max Buy |
BJ
-
NYSE
B J S Whlsl Club Hldgs
Retail-DiscountandVariety
|
$38.72
|
-1.02
-2.57% |
$39.79
|
3,667,078
162.84% of 50 DAV
50 DAV is 2,252,000
|
$47.46
-18.42%
|
11/19/2020
|
$42.97
|
PP = $47.56
|
|
MB = $49.94
|
Most Recent Note - 12/3/2020 5:19:20 PM
G - Slumped further below its 50 DMA line ($40.80) raisingf more concerns with a 7th consecutive loss today backed by higher volume. A rebound above the 50 DMA line is needed for its outlook to improve.
>>> FEATURED STOCK ARTICLE : Rebounding Near High With 3rd Strong Quarterly Report - 11/19/2020 |
View all notes |
Set NEW NOTE alert |
Company Profile |
SEC
News |
Chart |
Request a new note
C
A
S
I |
AAXN
-
NASDAQ
Axon Enterprise Inc
Security/Sfty
|
$123.85
|
-0.07
-0.06% |
$126.62
|
312,169
58.13% of 50 DAV
50 DAV is 537,000
|
$130.41
-5.03%
|
11/6/2020
|
$122.75
|
PP = $113.00
|
|
MB = $118.65
|
Most Recent Note - 12/3/2020 5:15:02 PM
G - Still perched near its all time high with volume totals cooling. Wedged to new high territory with gains lacking volume conviction. Recently reported Sep '20 quarterly earnings +43% on +27% sales revenues versus the year ago period. It broke out of a cup-with-high-handle base with volume drying up during the handle. See the latest FSU analysis for more details and a new annotated graph.
>>> FEATURED STOCK ARTICLE : Volume Totals Cooling While Hovering Near All-Time High - 12/3/2020 |
View all notes |
Set NEW NOTE alert |
Company Profile |
SEC
News |
Chart |
Request a new note
C
A
S
I |
QTWO
-
NYSE
Q2 Holdings Inc
Computer Sftwr-Financial
|
$116.85
|
+3.02
2.65% |
$117.67
|
397,003
101.54% of 50 DAV
50 DAV is 391,000
|
$116.95
-0.09%
|
11/12/2020
|
$105.14
|
PP = $106.54
|
|
MB = $111.87
|
Most Recent Note - 12/3/2020 5:24:46 PM
G - Posted a gain today with average volume while hitting a new high. Showed great earning increases with strong underlying sales revenues growth for the Jun and Sep '20 quarters versus the year ago periods. Annual earnings growth has been strong. Completed new Public Offerings on 6/06/19 and 5/13/20.
>>> FEATURED STOCK ARTICLE : Churning Action Near Prior High Indicative of Distributional Pressure - 11/12/2020 |
View all notes |
Set NEW NOTE alert |
Company Profile |
SEC
News |
Chart |
Request a new note
C
A
S
I |
|
|
|
THESE ARE NOT BUY RECOMMENDATIONS!
Comments contained in the body of this report are technical
opinions only. The material herein has been obtained
from sources believed to be reliable and accurate, however,
its accuracy and completeness cannot be guaranteed.
This site is not an investment advisor, hence it does
not endorse or recommend any securities or other investments.
Any recommendation contained in this report may not
be suitable for all investors and it is not to be deemed
an offer or solicitation on our part with respect to
the purchase or sale of any securities. All trademarks,
service marks and trade names appearing in this report
are the property of their respective owners, and are
likewise used for identification purposes only.
This report is a service available
only to active Paid Premium Members.
You may opt-out of receiving report notifications
at any time. Questions or comments may be submitted
by writing to Premium Membership Services 665 S.E. 10 Street, Suite 201 Deerfield Beach, FL 33441-5634 or by calling 1-800-965-8307
or 954-785-1121.
|
|
|