***Last / Change / Volume data in this table is the closing quote data***
Symbol/Exchange
Company Name
Industry Group |
PRICE |
CHANGE
(%Change) |
Day High |
Volume
(% DAV)
(% 50 day avg vol) |
52 Wk Hi
% From Hi |
Featured
Date |
Price
Featured |
Pivot Featured |
|
Max Buy |
OSBC
-
NASDAQ
Old Second Bancorp Inc
BANKING - Regional - Midwest Banks
|
$15.55
|
+0.31
2.03% |
$16.30
|
208,814
233.31% of 50 DAV
50 DAV is 89,500
|
$15.60
-0.32%
|
5/21/2018
|
$15.50
|
PP = $15.10
|
|
MB = $15.86
|
Most Recent Note - 7/23/2018 4:02:04 PM
Y - Rebounding above its 50 DMA line ($14.97). Its prior low ($14) and 200 DMA line define the next important support level. Its Relative Strength Rating has slumped to 74, below the 80+ minimum guideline for buy candidates. Due to report earnings news on 7/25/18. Volume and volatility often increase near earnings news.
>>> FEATURED STOCK ARTICLE : Consolidating Above 50-Day Moving Average - 7/9/2018 |
View all notes |
Set NEW NOTE alert |
Company Profile |
SEC
News |
Chart |
Request a new note
C
A
S
I |
PFBC
-
NASDAQ
Preferred Bank Los Angls
BANKING - Regional - Pacific Banks
|
$64.66
|
+0.48
0.75% |
$65.22
|
71,099
36.63% of 50 DAV
50 DAV is 194,100
|
$69.48
-6.94%
|
5/18/2018
|
$62.91
|
PP = $67.75
|
|
MB = $71.14
|
Most Recent Note - 7/25/2018 6:41:53 PM
G - Undercut its 50 DMA line ($65.20) again and th color code is changed to green. Recent low ($63.35 on 7/18/18) defines near-term support where more damaging losses would raise serious concerns. Relative Strength Rating is now 50, remaining below the 80+ minimum guideline for buy candidates, and it is -7.6% off its all-time high.
>>> FEATURED STOCK ARTICLE : Volume-Driven Gains Hit New All-Time High - 7/3/2018 |
View all notes |
Set NEW NOTE alert |
Company Profile |
SEC
News |
Chart |
Request a new note
C
A
S
I |
SIVB
-
NASDAQ
S V B Financial Group
BANKING - Regional - Pacific Banks
|
$311.23
|
+0.47
0.15% |
$316.18
|
626,930
134.82% of 50 DAV
50 DAV is 465,000
|
$329.65
-5.59%
|
3/12/2018
|
$267.79
|
PP = $263.19
|
|
MB = $276.35
|
Most Recent Note - 7/23/2018 4:37:14 PM
G - Rebounded above the 50 DMA line ($311.38) with today's gain helping its outlook improve. Faces resistance due to overhead supply up to the $329 level. The recent low ($284.42 on 7/02/18) defines the next important near-term support to watch on pullbacks.
>>> FEATURED STOCK ARTICLE : Still Sputtering Below 50-Day Moving Average - 7/10/2018 |
View all notes |
Set NEW NOTE alert |
Company Profile |
SEC
News |
Chart |
Request a new note
C
A
S
I |
UCFC
-
NASDAQ
United Community Finl Cp
BANKING - Savings and Loans
|
$10.90
|
+0.05
0.46% |
$11.00
|
206,027
97.00% of 50 DAV
50 DAV is 212,400
|
$11.98
-9.02%
|
5/30/2018
|
$10.50
|
PP = $10.80
|
|
MB = $11.34
|
Most Recent Note - 7/25/2018 6:26:28 PM
Y - Testing its 50 DMA line ($10.94) with today's 5th consecutive loss. The prior high ($10.70 on 4/19/18) defines the next near-term support to watch. Recently reported earnings +19% on +6% sales revenues for the Jun '18 quarter, below the +25% minimum earnings guideline (C criteria).
>>> FEATURED STOCK ARTICLE : Consolidating Above 50-Day Average and Prior Highs - 7/17/2018 |
View all notes |
Set NEW NOTE alert |
Company Profile |
SEC
News |
Chart |
Request a new note
C
A
S
I |
EPAM
-
NYSE
Epam Systems Inc
COMPUTER SOFTWARE and SERVICES - Information Technology Service
|
$133.93
|
+0.30
0.22% |
$134.89
|
267,341
56.16% of 50 DAV
50 DAV is 476,000
|
$137.73
-2.76%
|
7/5/2018
|
$123.70
|
PP = $131.85
|
|
MB = $138.44
|
Most Recent Note - 7/24/2018 5:17:51 PM
Y - There was a "negative reversal" today after touching a new all-time high. Recent gains above the pivot point lacked the +40% above average volume needed to trigger a proper new (or add-on) technical buy signal. Its 50 DMA line ($126.26) defines near-term support above the recent low ($118.34 on 6/25/18).
>>> FEATURED STOCK ARTICLE : Sputtering Below 50-Day Average After Negating Prior Breakout - 6/27/2018 |
View all notes |
Set NEW NOTE alert |
Company Profile |
SEC
News |
Chart |
Request a new note
C
A
S
I |
Symbol/Exchange
Company Name
Industry Group |
PRICE |
CHANGE
(%Change) |
Day High |
Volume
(% DAV)
(% 50 day avg vol) |
52 Wk Hi
% From Hi |
Featured
Date |
Price
Featured |
Pivot Featured |
|
Max Buy |
FLT
-
NYSE
Fleetcor Technologies
DIVERSIFIED SERVICES - Business/Management Services
|
$223.91
|
-1.64
-0.73% |
$225.39
|
653,949
51.90% of 50 DAV
50 DAV is 1,260,000
|
$225.92
-0.89%
|
6/18/2018
|
$219.31
|
PP = $213.84
|
|
MB = $224.53
|
Most Recent Note - 7/19/2018 3:50:37 PM
Y - Still perched within close striking distance of its 52-week high. Found support above its 50 DMA line ($209.12) during the recent consolidation.
>>> FEATURED STOCK ARTICLE : Breakaway Gap With Heavy Volume - 6/18/2018 |
View all notes |
Set NEW NOTE alert |
Company Profile |
SEC
News |
Chart |
Request a new note
C
A
S
I |
MA
-
NYSE
Mastercard Inc Cl A
Finance-CrdtCard/PmtPr
|
$207.37
|
-6.79
-3.17% |
$211.80
|
7,277,868
236.76% of 50 DAV
50 DAV is 3,074,000
|
$214.28
-3.22%
|
7/11/2018
|
$203.84
|
PP = $204.10
|
|
MB = $214.31
|
 Most Recent Note - 7/26/2018 12:58:56 PM
Y - Reported earnings +51% on +20% sales revenues for the Jun '18 quarter. Gapped down today, retreating from a new all-time high. Its 50 DMA line ($199) and recent low ($193.16 on 6/27/18) define important near-term support to watch.
>>> FEATURED STOCK ARTICLE : Extended From Prior Base and Perched at All-Time High - 6/20/2018 |
View all notes |
Set NEW NOTE alert |
Company Profile |
SEC
News |
Chart |
Request a new note
C
A
S
I |
V
-
NYSE
Visa Inc Cl A
Finance-CrdtCard/PmtPr
|
$142.50
|
-0.14
-0.10% |
$142.79
|
10,519,926
144.41% of 50 DAV
50 DAV is 7,285,000
|
$142.77
-0.19%
|
4/26/2018
|
$126.68
|
PP = $126.98
|
|
MB = $133.33
|
Most Recent Note - 7/23/2018 4:34:44 PM
G - Due to report earnings news on 7/25/18 after the close. Volume and volatility often increase near earnings news. Extended from any sound base, stubbornly holding its ground perched at its all-time high. The 50 DMA line ($134) defines support above the prior low ($129.53 on 6/25/18).
>>> FEATURED STOCK ARTICLE : Encountered Distributional Pressure at All-Time High - 6/11/2018 |
View all notes |
Set NEW NOTE alert |
Company Profile |
SEC
News |
Chart |
Request a new note
C
A
S
I |
BRKS
-
NASDAQ
Brooks Automation
ELECTRONICS - Semiconductor Equipment and Mate
|
$30.58
|
+0.48
1.59% |
$30.90
|
575,402
79.71% of 50 DAV
50 DAV is 721,900
|
$36.45
-16.10%
|
6/15/2018
|
$35.44
|
PP = $34.87
|
|
MB = $36.61
|
Most Recent Note - 7/25/2018 6:22:56 PM
G - Color code is changed to green while slumping well below its 50 DMA line ($32.50) with today's 5th consecutive loss. A rebound above the 50 DMA line is needed for its outlook to improve. Its Relative Strength rating has slumped to 74, below the 80+ minimum guideline for buy candidates.
>>> FEATURED STOCK ARTICLE : Volume Was Heavy Behind Big Breakout Gain - 6/15/2018 |
View all notes |
Set NEW NOTE alert |
Company Profile |
SEC
News |
Chart |
Request a new note
C
A
S
I |
ENV
-
NYSE
Envestnet Inc
FINANCIAL SERVICES - Diversified Investments
|
$62.30
|
+0.60
0.97% |
$62.95
|
326,816
85.78% of 50 DAV
50 DAV is 381,000
|
$62.25
0.08%
|
6/15/2018
|
$57.85
|
PP = $60.37
|
|
MB = $63.39
|
Most Recent Note - 7/24/2018 5:15:45 PM
Y - There was a "negative reversal" today on higher volume after touching a new all-time high, raising concerns as it encountered distributional pressure. A volume-driven gain for a new high on the prior session had triggered a technical buy signal. The recent low ($53.75 on 6/28/18) and 200 DMA line define important near-term support.
>>> FEATURED STOCK ARTICLE : Gain With Above Average Volume Challenged Prior High - 6/19/2018 |
View all notes |
Set NEW NOTE alert |
Company Profile |
SEC
News |
Chart |
Request a new note
C
A
S
I |
Symbol/Exchange
Company Name
Industry Group |
PRICE |
CHANGE
(%Change) |
Day High |
Volume
(% DAV)
(% 50 day avg vol) |
52 Wk Hi
% From Hi |
Featured
Date |
Price
Featured |
Pivot Featured |
|
Max Buy |
TPL
-
NYSE
Texas Pacific Land Trust
Real Estate Dvlpmt/Ops
|
$750.00
|
-23.90
-3.09% |
$776.23
|
9,853
61.58% of 50 DAV
50 DAV is 16,000
|
$816.28
-8.12%
|
7/5/2018
|
$714.90
|
PP = $739.99
|
|
MB = $776.99
|
Most Recent Note - 7/20/2018 7:11:48 PM
Y - Volume totals have been cooling while consolidating back below its "max buy" level following the recent breakout. Prior high in the $740 area defines near-term support above its 50 DMA line ($707.22). See the latest FSU analysis for more details and a new annotated graph.
>>> FEATURED STOCK ARTICLE : Volume Totals Cooling While Consolidating Above Prior High - 7/20/2018 |
View all notes |
Set NEW NOTE alert |
Company Profile |
SEC
News |
Chart |
Request a new note
C
A
S
I |
STMP
-
NASDAQ
Stamps.com Inc
Retail-Internet
|
$279.40
|
-0.60
-0.21% |
$283.80
|
134,701
54.31% of 50 DAV
50 DAV is 248,000
|
$285.75
-2.22%
|
5/4/2018
|
$234.15
|
PP = $233.23
|
|
MB = $244.89
|
Most Recent Note - 7/25/2018 6:39:04 PM
G - Rebounded near its all-time high with today's gain backed by light volume. Has not formed a sound base of sufficient length. Its 50 DMA line ($262.43) defines near-term support above the prior low ($241.55).
>>> FEATURED STOCK ARTICLE : Big Loss on Heavy Volume Tests 50-Day Moving Average - 6/21/2018 |
View all notes |
Set NEW NOTE alert |
Company Profile |
SEC
News |
Chart |
Request a new note
C
A
S
I |
CHDN
-
NASDAQ
Churchill Downs Inc
LEISURE - Gaming Activities
|
$288.35
|
-12.25
-4.08% |
$300.55
|
76,432
93.21% of 50 DAV
50 DAV is 82,000
|
$314.60
-8.34%
|
6/20/2018
|
$285.80
|
PP = $314.70
|
|
MB = $330.44
|
Most Recent Note - 7/23/2018 3:53:06 PM
Y - Volume totals have been cooling while consolidating above its 50 DMA line ($301.16). Below that short-term average, the prior low ($285.50 on 6/28/18) defines the next important support. Violations would raise concerns and trigger technical sell signals. A new pivot point was cited based on its 5/16/18 high plus 10 cents. Subsequent volume-driven gains for a new high are needed to trigger a new (or add-on) technical buy signal.
>>> FEATURED STOCK ARTICLE : Consolidating Near 50-Day Moving Average - 6/29/2018 |
View all notes |
Set NEW NOTE alert |
Company Profile |
SEC
News |
Chart |
Request a new note
C
A
S
I |
HTHT
-
NASDAQ
Huazhu Group Ads
LEISURE - Lodging
|
$41.32
|
+0.13
0.32% |
$41.78
|
869,904
37.82% of 50 DAV
50 DAV is 2,300,000
|
$49.60
-16.69%
|
5/15/2018
|
$34.52
|
PP = $41.57
|
|
MB = $43.65
|
Most Recent Note - 7/23/2018 3:58:57 PM
G - Still sputtering below its 50 DMA line ($43.82) yet finding support near prior highs in the $40-41 area. A rebound above the 50 DMA line is needed for its outlook to improve.
>>> FEATURED STOCK ARTICLE : At Prior High and Slumping Below 50-Day Average After 4:1 Split - 7/2/2018 |
View all notes |
Set NEW NOTE alert |
Company Profile |
SEC
News |
Chart |
Request a new note
C
A
S
I |
NFLX
-
NASDAQ
Netflix Inc
SPECIALTY RETAIL - Music and Video Stores
|
$363.09
|
+0.22
0.06% |
$365.54
|
6,979,754
59.61% of 50 DAV
50 DAV is 11,710,000
|
$423.21
-14.20%
|
5/24/2018
|
$348.85
|
PP = $338.92
|
|
MB = $355.87
|
Most Recent Note - 7/20/2018 11:34:12 AM
G - Sputtering below its 50 DMA line ($373) following damaging volume-driven losses. Reported very strong earnings and sales increases for the Jun '18 quarter, however, subscriber growth was below consensus estimates.
>>> FEATURED STOCK ARTICLE : Extended From Base and Pulling Back From All-Time High - 7/13/2018 |
View all notes |
Set NEW NOTE alert |
Company Profile |
SEC
News |
Chart |
Request a new note
C
A
S
I |
Symbol/Exchange
Company Name
Industry Group |
PRICE |
CHANGE
(%Change) |
Day High |
Volume
(% DAV)
(% 50 day avg vol) |
52 Wk Hi
% From Hi |
Featured
Date |
Price
Featured |
Pivot Featured |
|
Max Buy |
DPZ
-
NYSE
Dominos Pizza Inc
Retail-Restaurants
|
$260.00
|
-2.20
-0.84% |
$263.06
|
504,886
81.83% of 50 DAV
50 DAV is 617,000
|
$293.81
-11.51%
|
5/21/2018
|
$248.13
|
PP = $255.10
|
|
MB = $267.86
|
Most Recent Note - 7/24/2018 5:19:28 PM
G - Violated its 50 DMA line ($269.41) with today's big loss on higher volume triggering a technical sell signal. Has a new CEO effective 7/02/18.
>>> FEATURED STOCK ARTICLE : Consolidating Near 50-Day Moving Average Line - 7/23/2018 |
View all notes |
Set NEW NOTE alert |
Company Profile |
SEC
News |
Chart |
Request a new note
C
A
S
I |
FIVE
-
NASDAQ
Five Below Inc
Retail-DiscountandVariety
|
$98.96
|
+0.10
0.10% |
$100.13
|
484,327
34.35% of 50 DAV
50 DAV is 1,410,000
|
$109.09
-9.29%
|
7/6/2018
|
$98.90
|
PP = $104.09
|
|
MB = $109.29
|
Most Recent Note - 7/24/2018 12:52:21 PM
Y - Retreating from its all-time high with today's 3rd consecutive loss. The prior low ($96.32 on 7/02/18) defines important near-term support above its 50 DMA line ($91.41). Recent gains above the pivot point lacked the minimum +40% above average volume necessary to trigger a proper technical buy signal.
>>> FEATURED STOCK ARTICLE : Hovering Near Record High After Big Gap Up and Volume-Driven Gain - 6/25/2018 |
View all notes |
Set NEW NOTE alert |
Company Profile |
SEC
News |
Chart |
Request a new note
C
A
S
I |
NOW
-
NYSE
Servicenow Inc
Computer Sftwr-Enterprse
|
$192.32
|
+8.46
4.60% |
$194.67
|
3,787,755
235.26% of 50 DAV
50 DAV is 1,610,000
|
$194.81
-1.28%
|
5/8/2018
|
$174.63
|
PP = $176.66
|
|
MB = $185.49
|
Most Recent Note - 7/26/2018 1:13:57 PM
G - Reported earnings +123% on +41% sales revenues, continuing its strong earnings history. Endured distributional pressure but quickly rebounded near its all-time high and above the previously cited "max buy" level. The 50 DMA line ($181) and recent low ($167) define important near-term support.
>>> FEATURED STOCK ARTICLE : Recent Slump Below 50-Day Average Hurt Outlook - 6/26/2018 |
View all notes |
Set NEW NOTE alert |
Company Profile |
SEC
News |
Chart |
Request a new note
C
A
S
I |
NVEE
-
NASDAQ
N V 5 Global Inc
Comml Svcs-Consulting
|
$75.60
|
+2.10
2.86% |
$76.85
|
66,910
119.48% of 50 DAV
50 DAV is 56,000
|
$74.53
1.44%
|
6/15/2018
|
$7,070.00
|
PP = $72.00
|
|
MB = $75.60
|
Most Recent Note - 7/19/2018 3:55:50 PM
Y - Volume totals have been cooling in recent weeks while hovering in a very tight range perched near its all-time high. Confirming gains above the pivot point backed by at least +40% above average volume may trigger a technical buy signal. Its 50 DMA line ($66.17) defines near-term support above the prior low ($56.65 on 5/15/18).
>>> FEATURED STOCK ARTICLE : Holding its Ground in Tight Range Near All-Time High - 6/28/2018 |
View all notes |
Set NEW NOTE alert |
Company Profile |
SEC
News |
Chart |
Request a new note
C
A
S
I |
PANW
-
NYSE
Palo Alto Networks
Computer Sftwr-Security
|
$215.37
|
+0.63
0.29% |
$216.91
|
848,282
63.59% of 50 DAV
50 DAV is 1,334,000
|
$219.38
-1.83%
|
6/12/2018
|
$206.55
|
PP = $214.69
|
|
MB = $225.42
|
Most Recent Note - 7/23/2018 4:04:35 PM
Y - Hovering near its all-time high with volume totals cooling. Quietly consolidating above its 50 DMA line ($208). The prior low ($199.22 on 6/28/18) defines the next important support level.
>>> FEATURED STOCK ARTICLE : New High Close After 2 Consecutive Volume Driven Gains - 6/13/2018 |
View all notes |
Set NEW NOTE alert |
Company Profile |
SEC
News |
Chart |
Request a new note
C
A
S
I |
Symbol/Exchange
Company Name
Industry Group |
PRICE |
CHANGE
(%Change) |
Day High |
Volume
(% DAV)
(% 50 day avg vol) |
52 Wk Hi
% From Hi |
Featured
Date |
Price
Featured |
Pivot Featured |
|
Max Buy |
QLYS
-
NASDAQ
Qualys Inc
Computer Sftwr-Security
|
$95.10
|
-1.70
-1.76% |
$97.15
|
427,899
127.73% of 50 DAV
50 DAV is 335,000
|
$98.30
-3.25%
|
7/23/2018
|
$97.05
|
PP = $97.85
|
|
MB = $102.74
|
Most Recent Note - 7/24/2018 5:12:16 PM
Y - There was a "negative reversal" today after touching a new all-time high. A new pivot point was cited based on its 6/14/18 high plus 10 cents. Subsequent gains above the pivot point backed by at least +40% above average volume may trigger a new (or add-on) technical buy signal. Its 50 DMA line ($85.93) defines near-term support above the prior low ($82.51 on 6/28/18).
>>> FEATURED STOCK ARTICLE : Computer Software-Security Firm Hovering Near All-Time High - 7/16/2018 |
View all notes |
Set NEW NOTE alert |
Company Profile |
SEC
News |
Chart |
Request a new note
C
A
S
I |
SPLK
-
NASDAQ
Splunk Inc
Computer Sftwr-Database
|
$104.04
|
+0.00
0.00% |
$104.93
|
1,535,550
80.31% of 50 DAV
50 DAV is 1,912,000
|
$121.64
-14.47%
|
5/8/2018
|
$113.14
|
PP = $112.76
|
|
MB = $118.40
|
Most Recent Note - 7/25/2018 6:24:11 PM
G - Still needs a rebound above the 50 DMA line (109.45) for its outlook to improve. Recent low ($95.10 on 6/28/18) defines near-term support above its 200 DMA line ($92.39).
>>> FEATURED STOCK ARTICLE : Splunk Still Sputtering Below 50-Day Moving Average - 7/18/2018 |
View all notes |
Set NEW NOTE alert |
Company Profile |
SEC
News |
Chart |
Request a new note
C
A
S
I |
SUPN
-
NASDAQ
Supernus Pharmaceuticals
Medical-Biomed/Biotech
|
$53.35
|
-1.20
-2.20% |
$54.52
|
419,739
55.59% of 50 DAV
50 DAV is 755,000
|
$61.25
-12.90%
|
6/20/2018
|
$58.05
|
PP = $59.15
|
|
MB = $62.11
|
Most Recent Note - 7/24/2018 5:10:00 PM
G - There was a "negative reversal" today as it met resistance at its 50 DMA line ($55.37). Deterioration below the recent low ($49.75 on 7/09/18) would raise more serious concerns. See the latest FSU analysis for more details and a new annotated graph.
>>> FEATURED STOCK ARTICLE : Met Resistance at 50-Day Moving Average - 7/24/2018 |
View all notes |
Set NEW NOTE alert |
Company Profile |
SEC
News |
Chart |
Request a new note
C
A
S
I |
GRUB
-
NYSE
Grubhub Inc
INTERNET - Content
|
$135.51
|
+0.78
0.58% |
$141.06
|
3,225,195
175.66% of 50 DAV
50 DAV is 1,836,000
|
$138.85
-2.41%
|
5/30/2018
|
$107.56
|
PP = $105.68
|
|
MB = $110.96
|
Most Recent Note - 7/26/2018 12:46:44 PM
G - Gapped up on the prior session and rallied into new all-time high territory, quickly getting extended from prior highs. Reported earnings +92% on +51% sales revenues for the Jun '18 quarter versus the year ago period. Volume and volatility often increase near earnings news. Patient investors may watch for a new base or secondary buy point to develop and be noted in the weeks ahead.
>>> FEATURED STOCK ARTICLE : Gain With +25% Above Average Volume for Best Ever Close - 6/12/2018 |
View all notes |
Set NEW NOTE alert |
Company Profile |
SEC
News |
Chart |
Request a new note
C
A
S
I |
HQY
-
NASDAQ
Healthequity Inc
COMPUTER SOFTWARE and SERVICES - Healthcare Information Service
|
$82.56
|
+0.28
0.34% |
$82.69
|
216,906
42.28% of 50 DAV
50 DAV is 513,000
|
$83.34
-0.94%
|
5/2/2018
|
$66.31
|
PP = $68.85
|
|
MB = $72.29
|
Most Recent Note - 7/25/2018 6:18:36 PM
G - Posted a big gain today with light volume, rebounding near its all-time high. The 50 DMA line ($78.24) defines near-term support to watch on pullbacks. See the latest FSU analysis for more details and a new annotated graph.
>>> FEATURED STOCK ARTICLE : Perched Near All-Time High After Testing Support at 50-Day Average - 7/25/2018 |
View all notes |
Set NEW NOTE alert |
Company Profile |
SEC
News |
Chart |
Request a new note
C
A
S
I |
Symbol/Exchange
Company Name
Industry Group |
PRICE |
CHANGE
(%Change) |
Day High |
Volume
(% DAV)
(% 50 day avg vol) |
52 Wk Hi
% From Hi |
Featured
Date |
Price
Featured |
Pivot Featured |
|
Max Buy |
LOB
-
NASDAQ
Live Oak Bancshares Inc
Banks-Southeast
|
$29.70
|
-2.15
-6.75% |
$31.85
|
566,194
390.48% of 50 DAV
50 DAV is 145,000
|
$32.95
-9.86%
|
5/21/2018
|
$29.35
|
PP = $30.15
|
|
MB = $31.66
|
Most Recent Note - 7/26/2018 12:55:32 PM
G - Violated its 50 DMA line ($30.66) with today's big volume-driven loss triggering a technical sell signal. Prior low ($29.05 on 6/15/18) defines an important chart support level. A prompt rebound above the 50 DMA line is needed for its outlook to improve.
>>> FEATURED STOCK ARTICLE : Bank Making Gradual Progress After Support Found at 50-Day Average - 7/11/2018 |
View all notes |
Set NEW NOTE alert |
Company Profile |
SEC
News |
Chart |
Request a new note
C
A
S
I |
PYPL
-
NASDAQ
Paypal Holdings Inc
Finance-CrdtCard/PmtPr
|
$89.14
|
-2.23
-2.44% |
$90.68
|
14,484,534
198.31% of 50 DAV
50 DAV is 7,304,000
|
$92.35
-3.48%
|
7/23/2018
|
$89.24
|
PP = $87.55
|
|
MB = $91.93
|
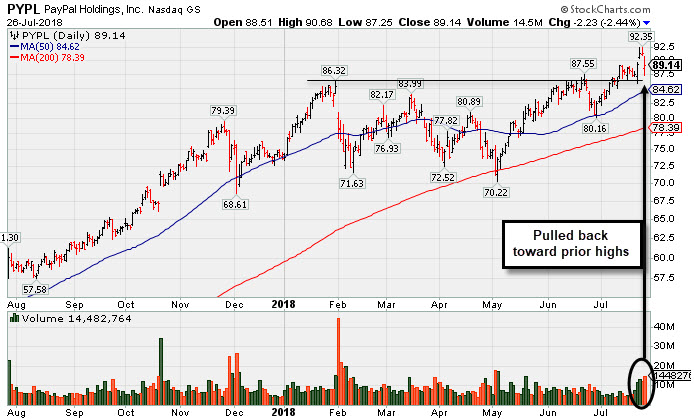
Most Recent Note - 7/26/2018 1:23:49 PM
Y - Perched near its all-time high after today's early weakness. Gains backed by above average volume while hitting new all-time highs were noted indications of recent institutional buying demand. Reported earnings +26% on +23% sales revenues for the Jun '18 quarter. A valid secondary buy point exists up to 5% above the prior high ($87.55 on 6/21/18) since finding support at the 10 WMA line following a prior breakout. The 50 DMA line ($84.64) defines near-term support above the prior low ($80.16 on 6/28/18).
>>> FEATURED STOCK ARTICLE : Paypal Pulling Back From Record High - 7/26/2018 |
View all notes |
Set NEW NOTE alert |
Company Profile |
SEC
News |
Chart |
Request a new note
C
A
S
I |
OLLI
-
NASDAQ
Ollie's Bargain Outlet
Retail-DiscountandVariety
|
$73.15
|
-0.85
-1.15% |
$74.55
|
539,390
61.16% of 50 DAV
50 DAV is 882,000
|
$77.50
-5.61%
|
7/12/2018
|
$74.43
|
PP = $77.60
|
|
MB = $81.48
|
Most Recent Note - 7/19/2018 3:57:13 PM
Y - Subsequent volume driven gains for new highs may trigger a new (or add-on) technical buy signal. Volume totals have been cooling while consolidating above its 50 DMA line ($72.34) which defines important near-term support to watch.
>>> FEATURED STOCK ARTICLE : Found Recent Support at 50-Day Moving Average Line - 7/5/2018 |
View all notes |
Set NEW NOTE alert |
Company Profile |
SEC
News |
Chart |
Request a new note
C
A
S
I |
MOMO
-
NASDAQ
Momo Inc Ads Cl A
INTERNET - Content
|
$43.12
|
-0.05
-0.12% |
$43.94
|
2,882,493
53.33% of 50 DAV
50 DAV is 5,405,000
|
$54.24
-20.50%
|
6/1/2018
|
$48.62
|
PP = $46.79
|
|
MB = $49.13
|
Most Recent Note - 7/24/2018 12:48:57 PM
G - Color code is changed to green after slumping well below its 50 DMA line ($45.79) with today's big volume-driven loss raising concerns. Subsequent losses below the recent low ($41.11 on 6/27/18) would trigger a more worrisome technical sell signal.
>>> FEATURED STOCK ARTICLE : Chinese Internet Content Firm Below 50-Day Moving Average - 7/19/2018 |
View all notes |
Set NEW NOTE alert |
Company Profile |
SEC
News |
Chart |
Request a new note
C
A
S
I |
NOVT
-
NASDAQ
Novanta Inc
Elec-Scientific/Msrng
|
$68.55
|
+0.80
1.18% |
$68.80
|
111,963
59.55% of 50 DAV
50 DAV is 188,000
|
$69.90
-1.93%
|
7/12/2018
|
$65.90
|
PP = $68.10
|
|
MB = $71.51
|
Most Recent Note - 7/20/2018 11:34:53 AM
Y - Hitting a new 52-week high today. Volume-driven gains above the pivot point may trigger a new (or add-on) technical buy signal. The 50 DMA line ($64.42 and recent low ($59.25) define important near-term support.
>>> FEATURED STOCK ARTICLE : Gain Challenged 52-Week High and New Pivot Point - 7/12/2018 |
View all notes |
Set NEW NOTE alert |
Company Profile |
SEC
News |
Chart |
Request a new note
C
A
S
I |
Symbol/Exchange
Company Name
Industry Group |
PRICE |
CHANGE
(%Change) |
Day High |
Volume
(% DAV)
(% 50 day avg vol) |
52 Wk Hi
% From Hi |
Featured
Date |
Price
Featured |
Pivot Featured |
|
Max Buy |
BZUN
-
NASDAQ
Baozun Inc Cl A Ads
Computer Sftwr-Enterprse
|
$64.22
|
+0.65
1.02% |
$65.03
|
1,107,982
45.19% of 50 DAV
50 DAV is 2,452,000
|
$67.41
-4.73%
|
5/15/2018
|
$45.38
|
PP = $52.43
|
|
MB = $55.05
|
Most Recent Note - 7/24/2018 12:55:24 PM
G - There was a "negative reversal" after today's early gains challenged its all-time high. Its 50 DMA line ($58.74) defines near-term support above the recent low ($51.50 on 6/27/18).
>>> FEATURED STOCK ARTICLE : Found Support Near Prior Highs and 50 Day Moving Average - 7/6/2018 |
View all notes |
Set NEW NOTE alert |
Company Profile |
SEC
News |
Chart |
Request a new note
C
A
S
I |